-
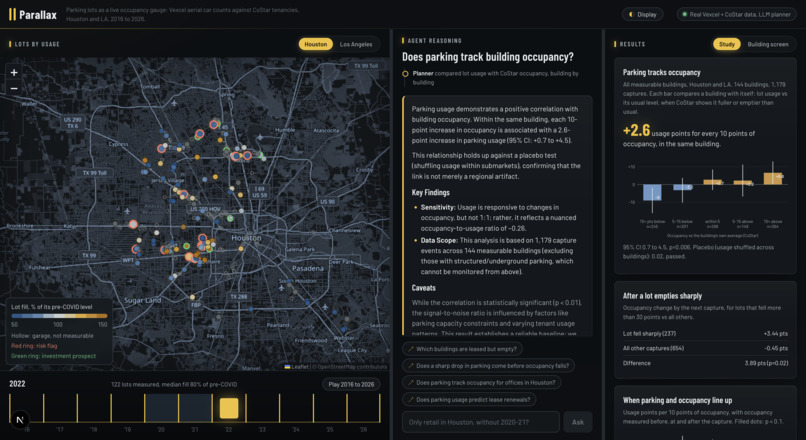
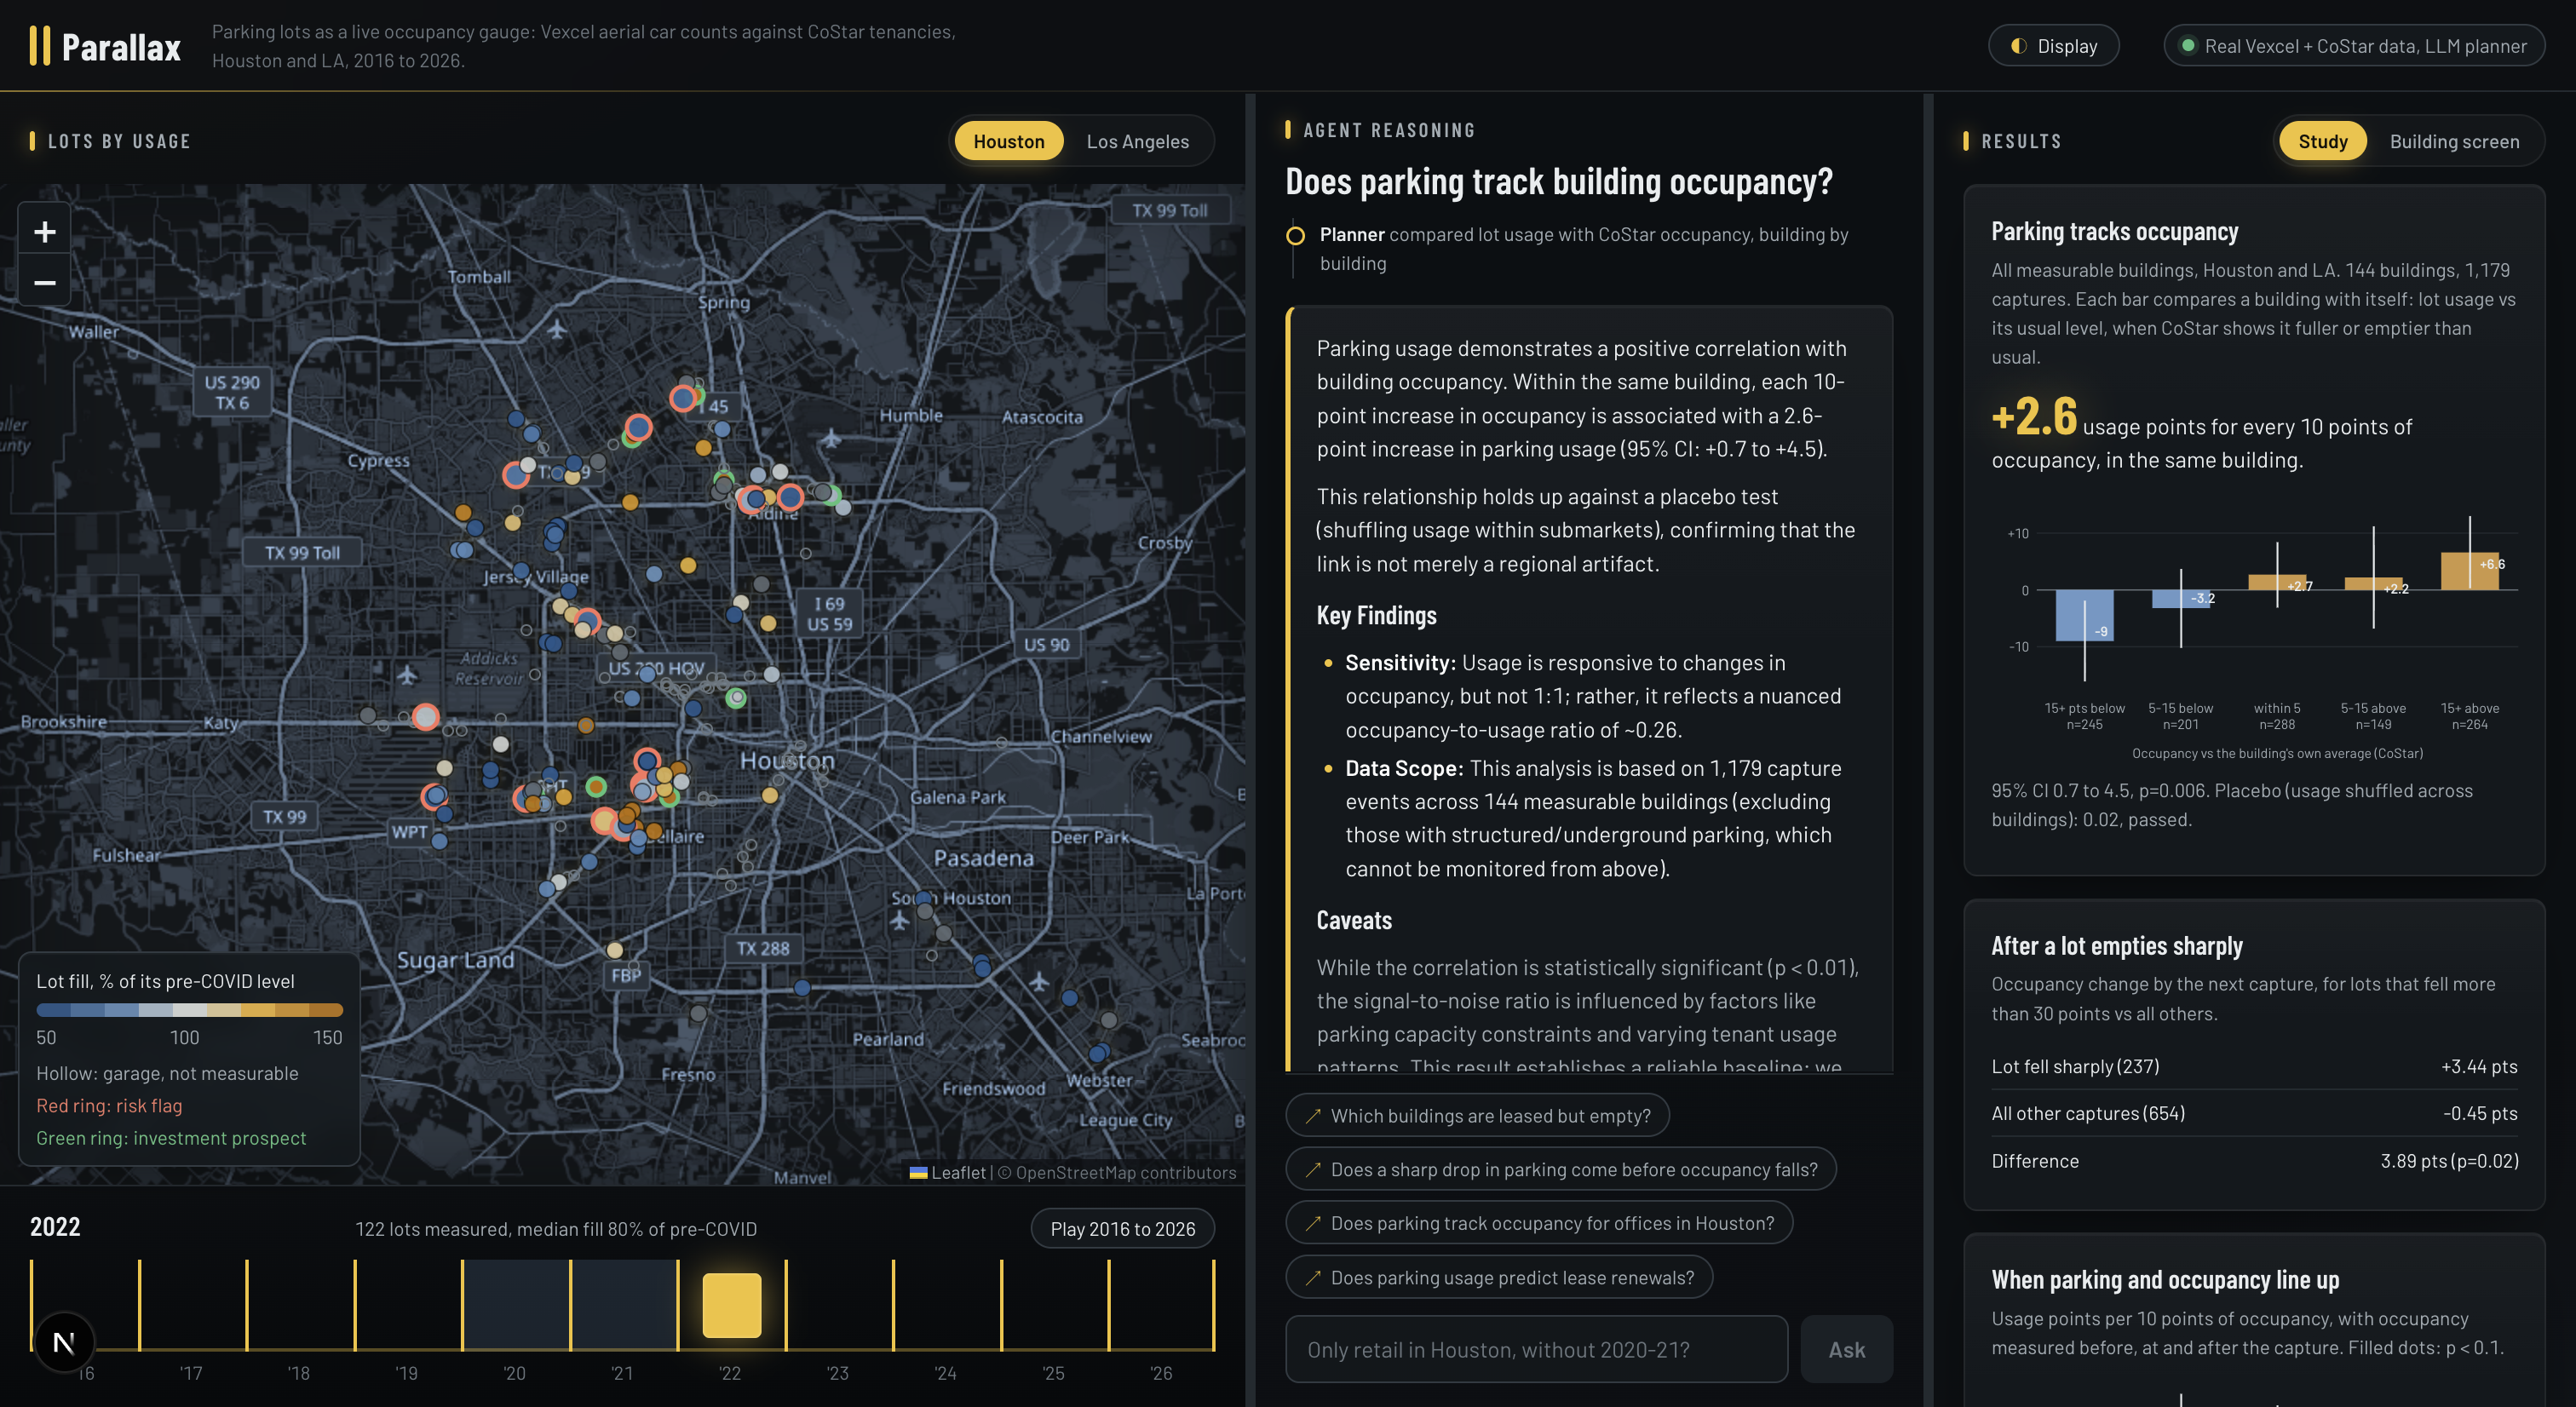
The agent tests 144 buildings: every 10 pts of occupancy means a 2.6-pt busier lot (p = 0.006). A placebo test confirms it.
-
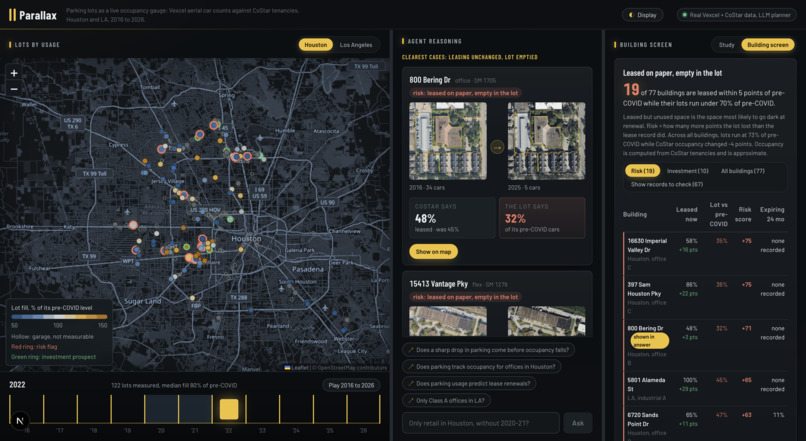
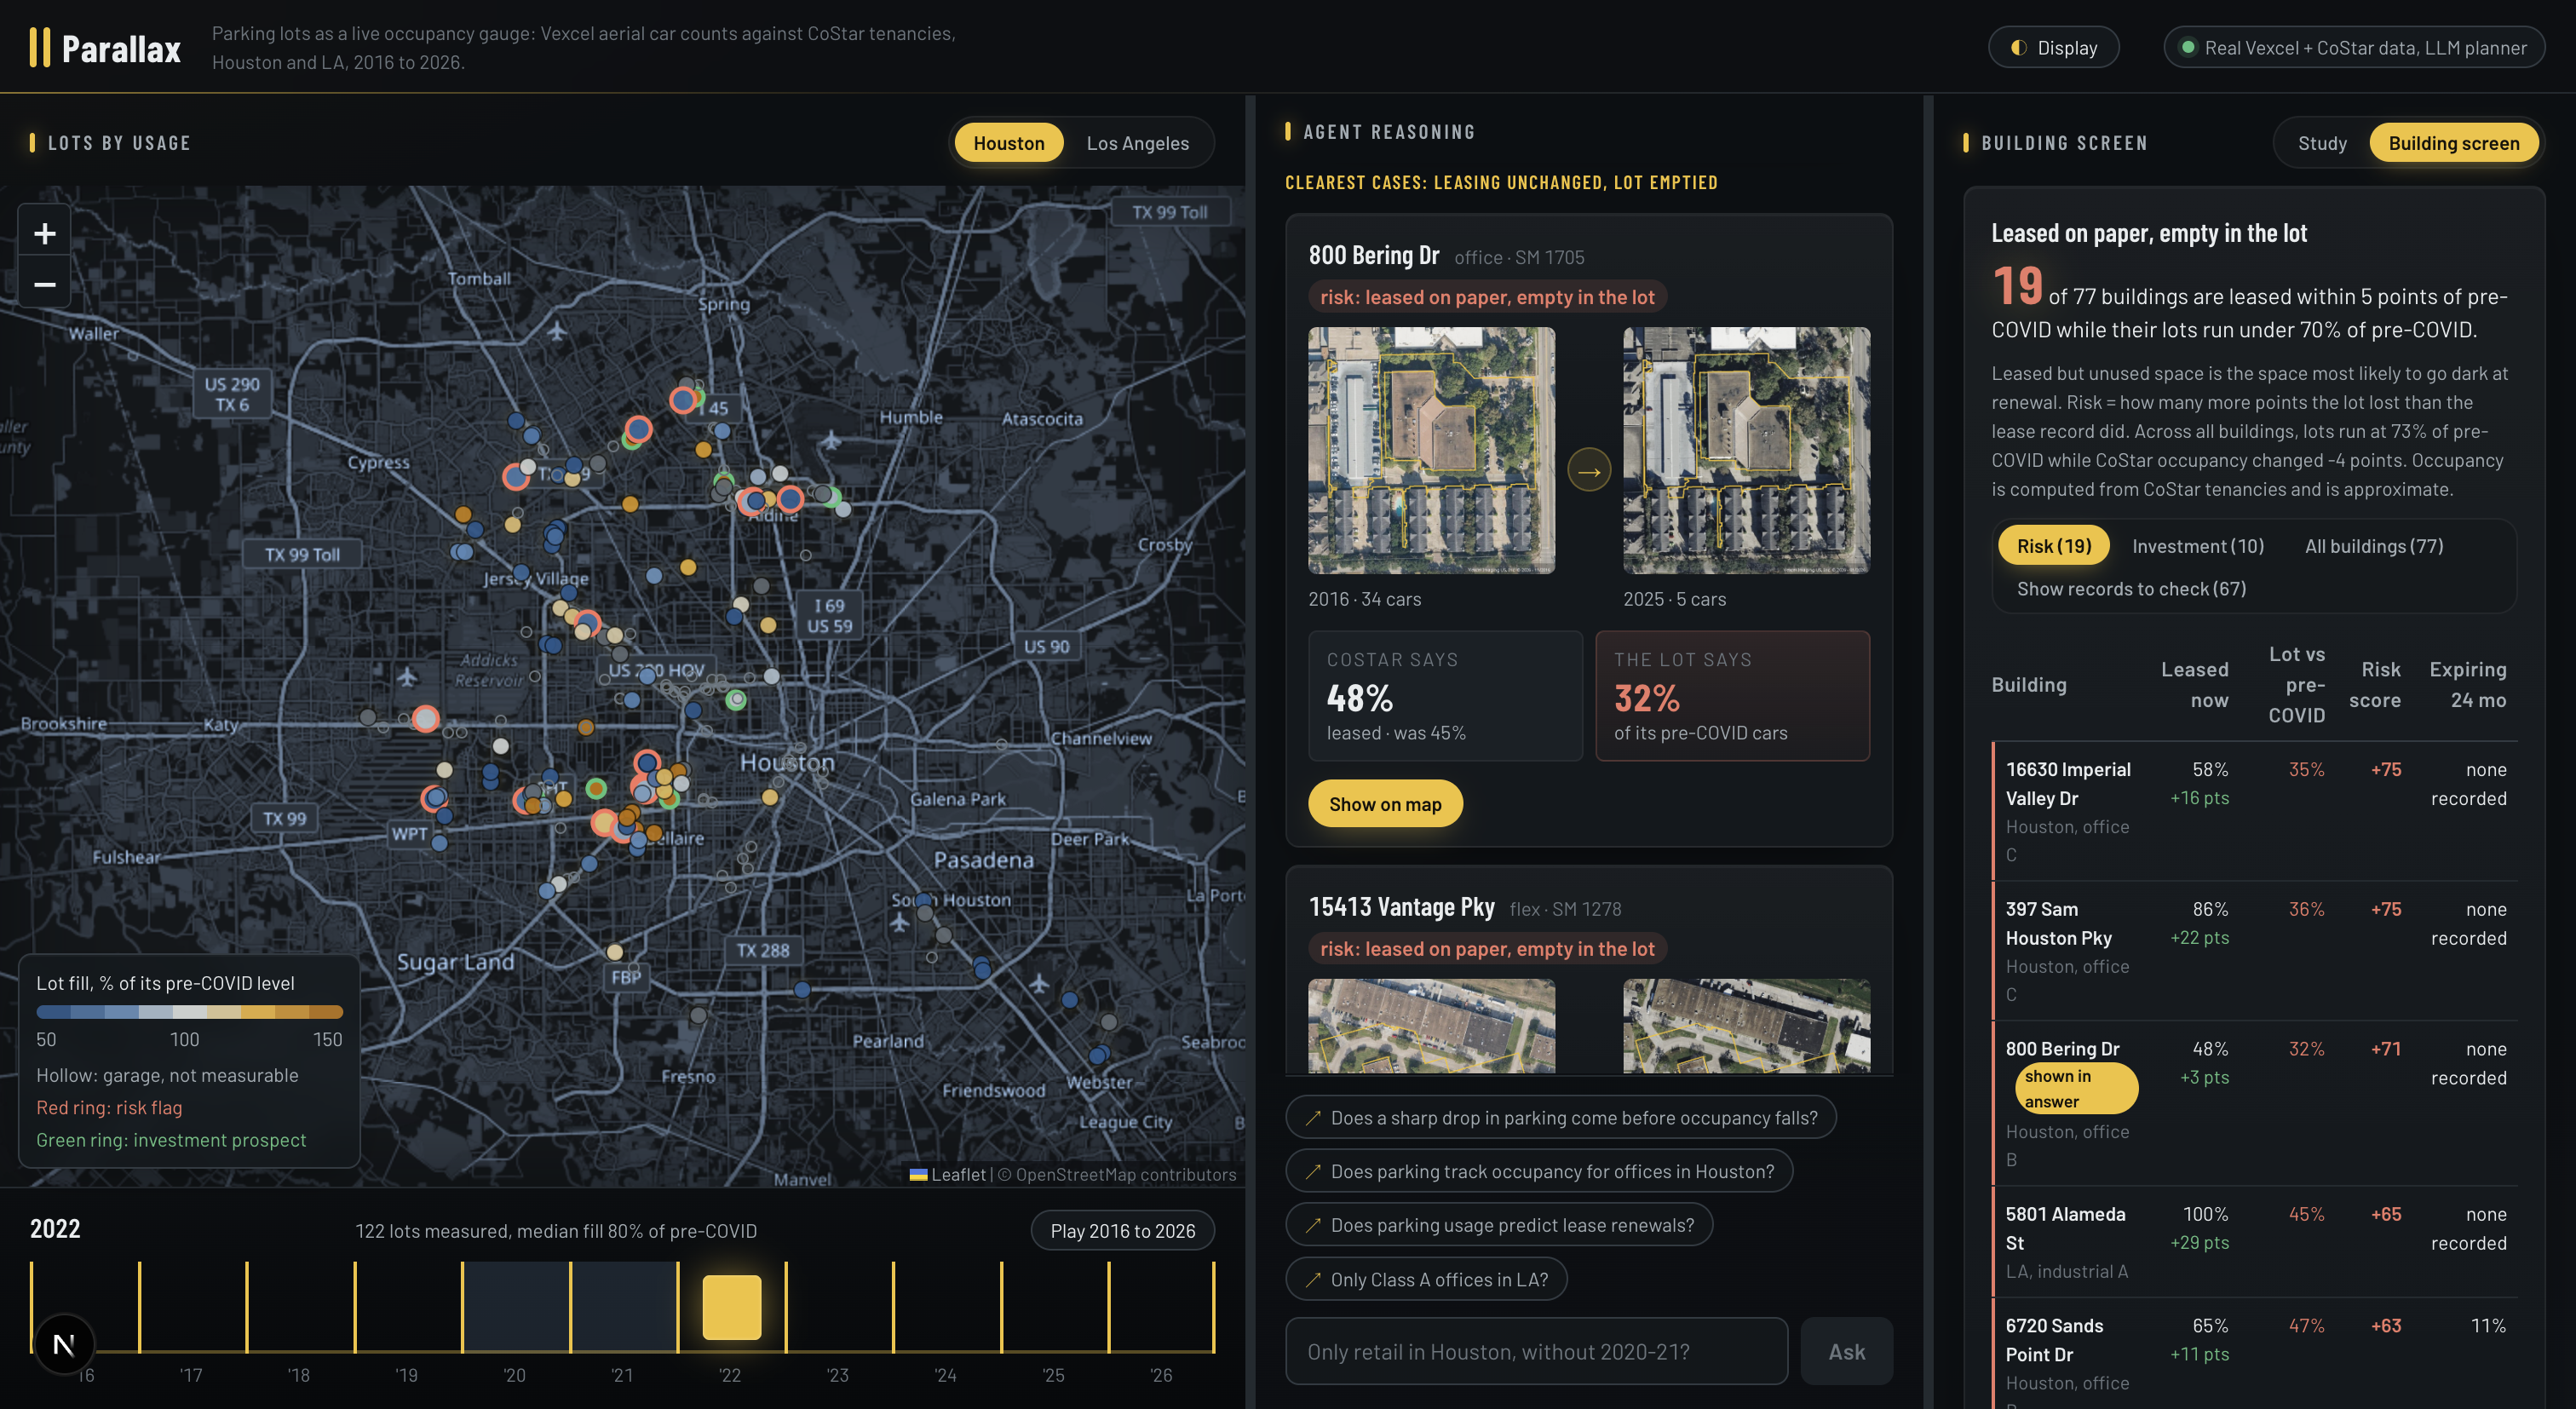
Risk: 800 Bering Dr is 48% leased, but its lot fell from 34 cars to 5. One of 19 buildings likely to go dark at renewal.
-
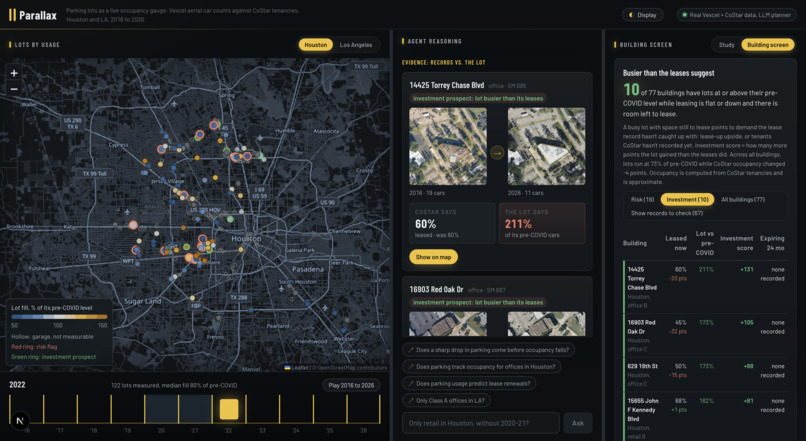
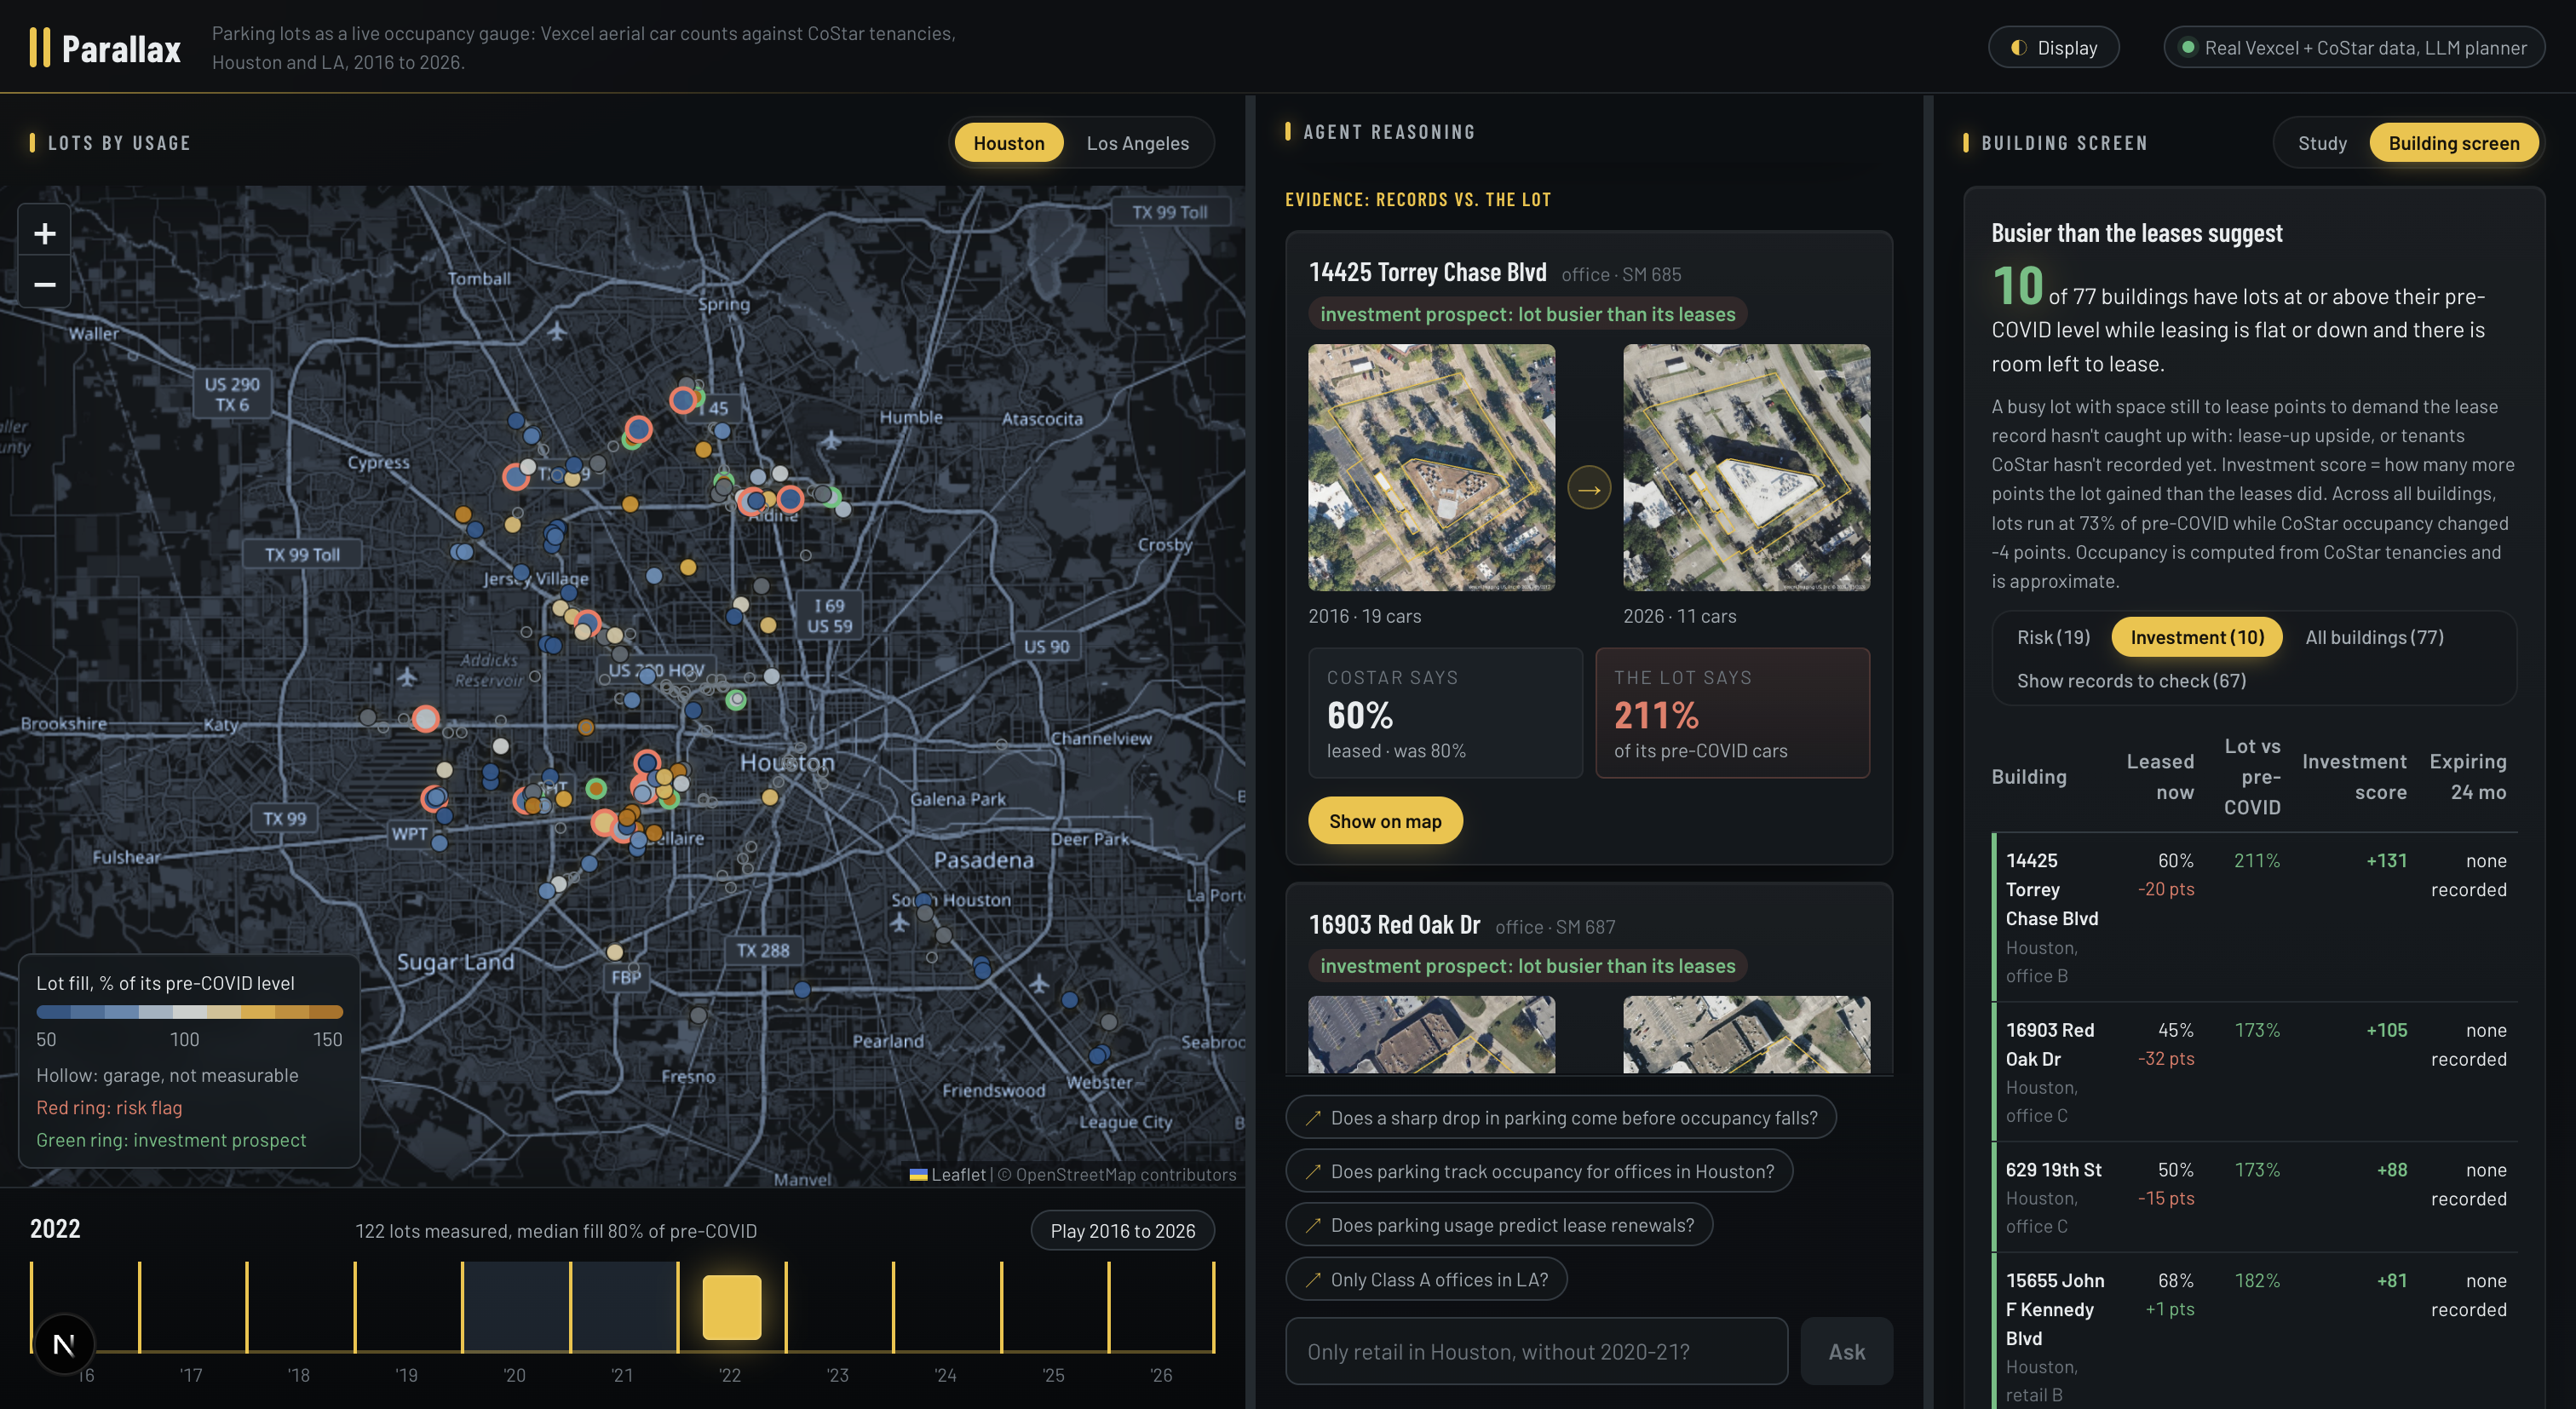
Investment: 14425 Torrey Chase Blvd’s lot is at 211% of pre-COVID while leasing fell to 60%. One of 10 lots busier than its leases.
-
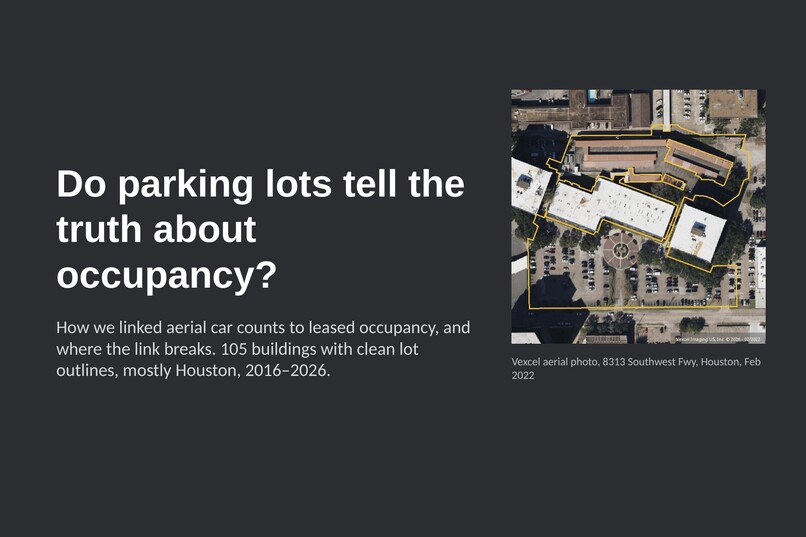
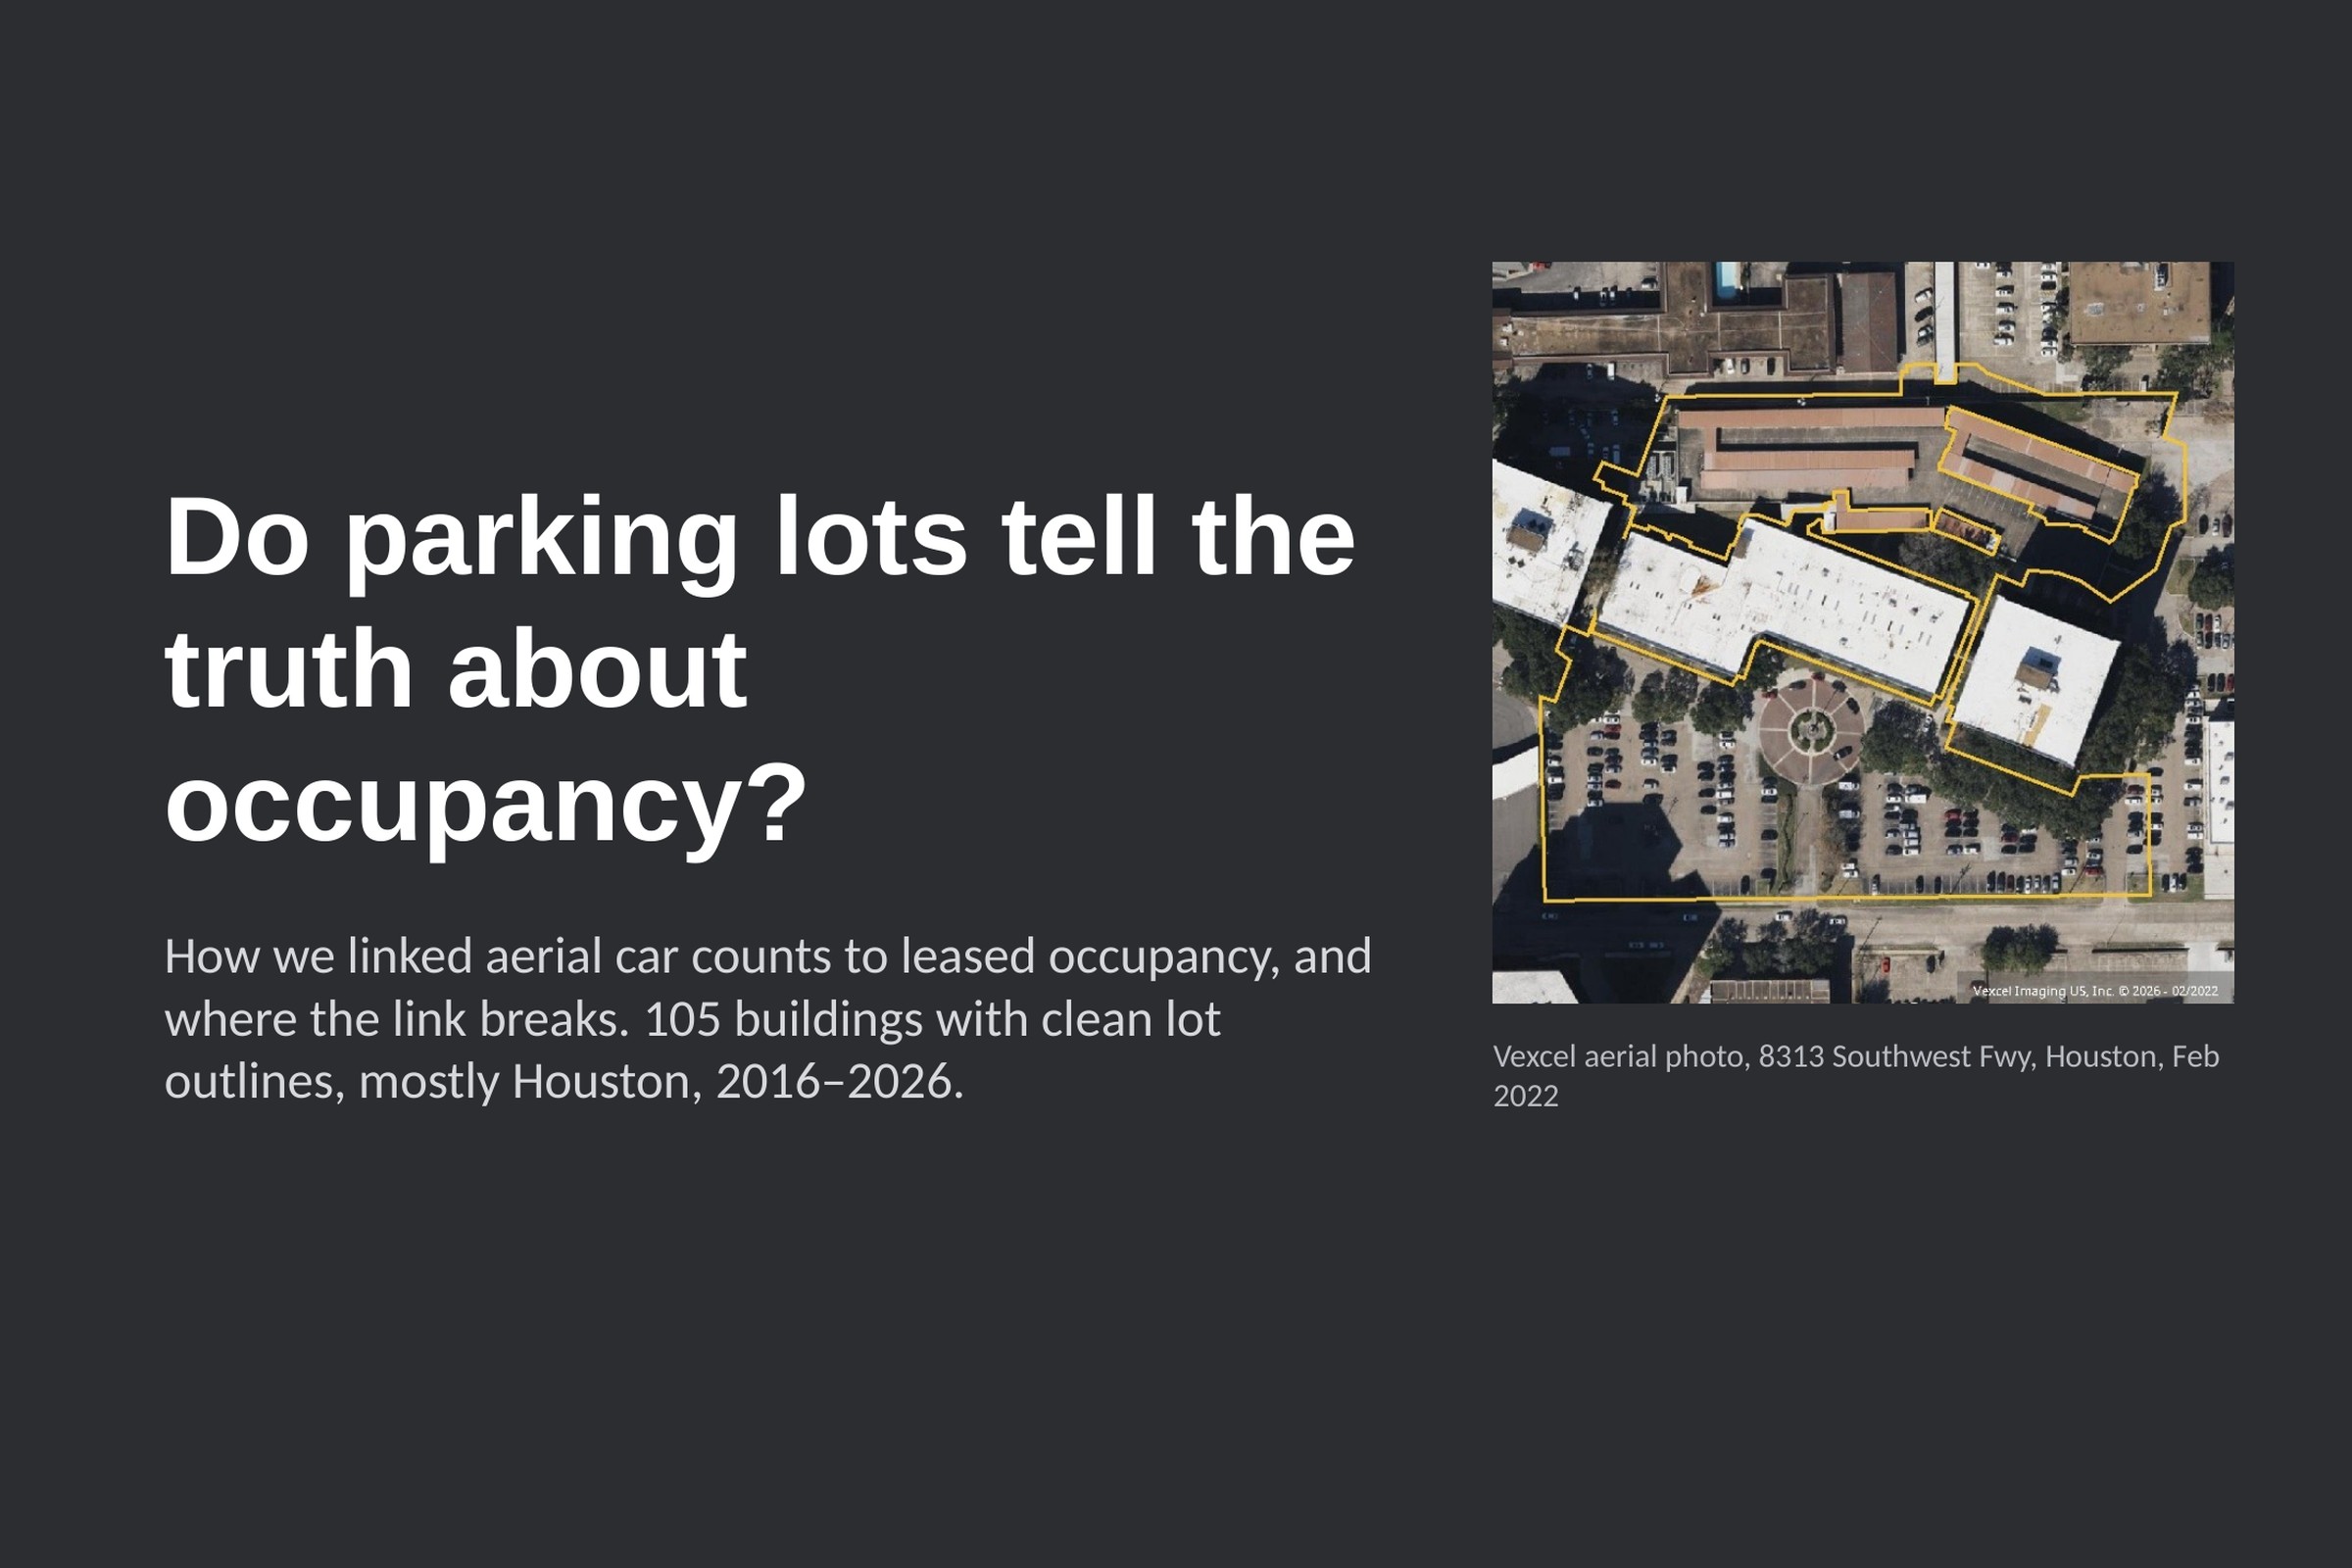
Do parking lots tell the truth about occupancy? We linked aerial car counts to CoStar leases for 105 buildings, 2016 to 2026.
-
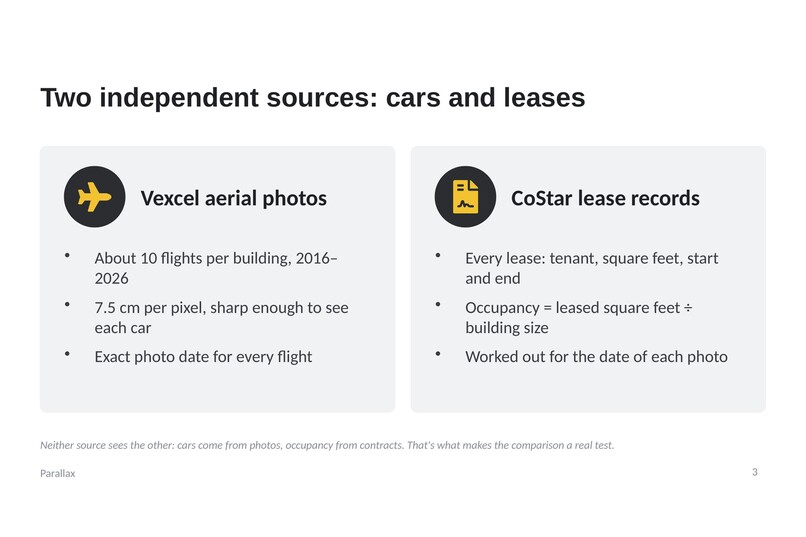
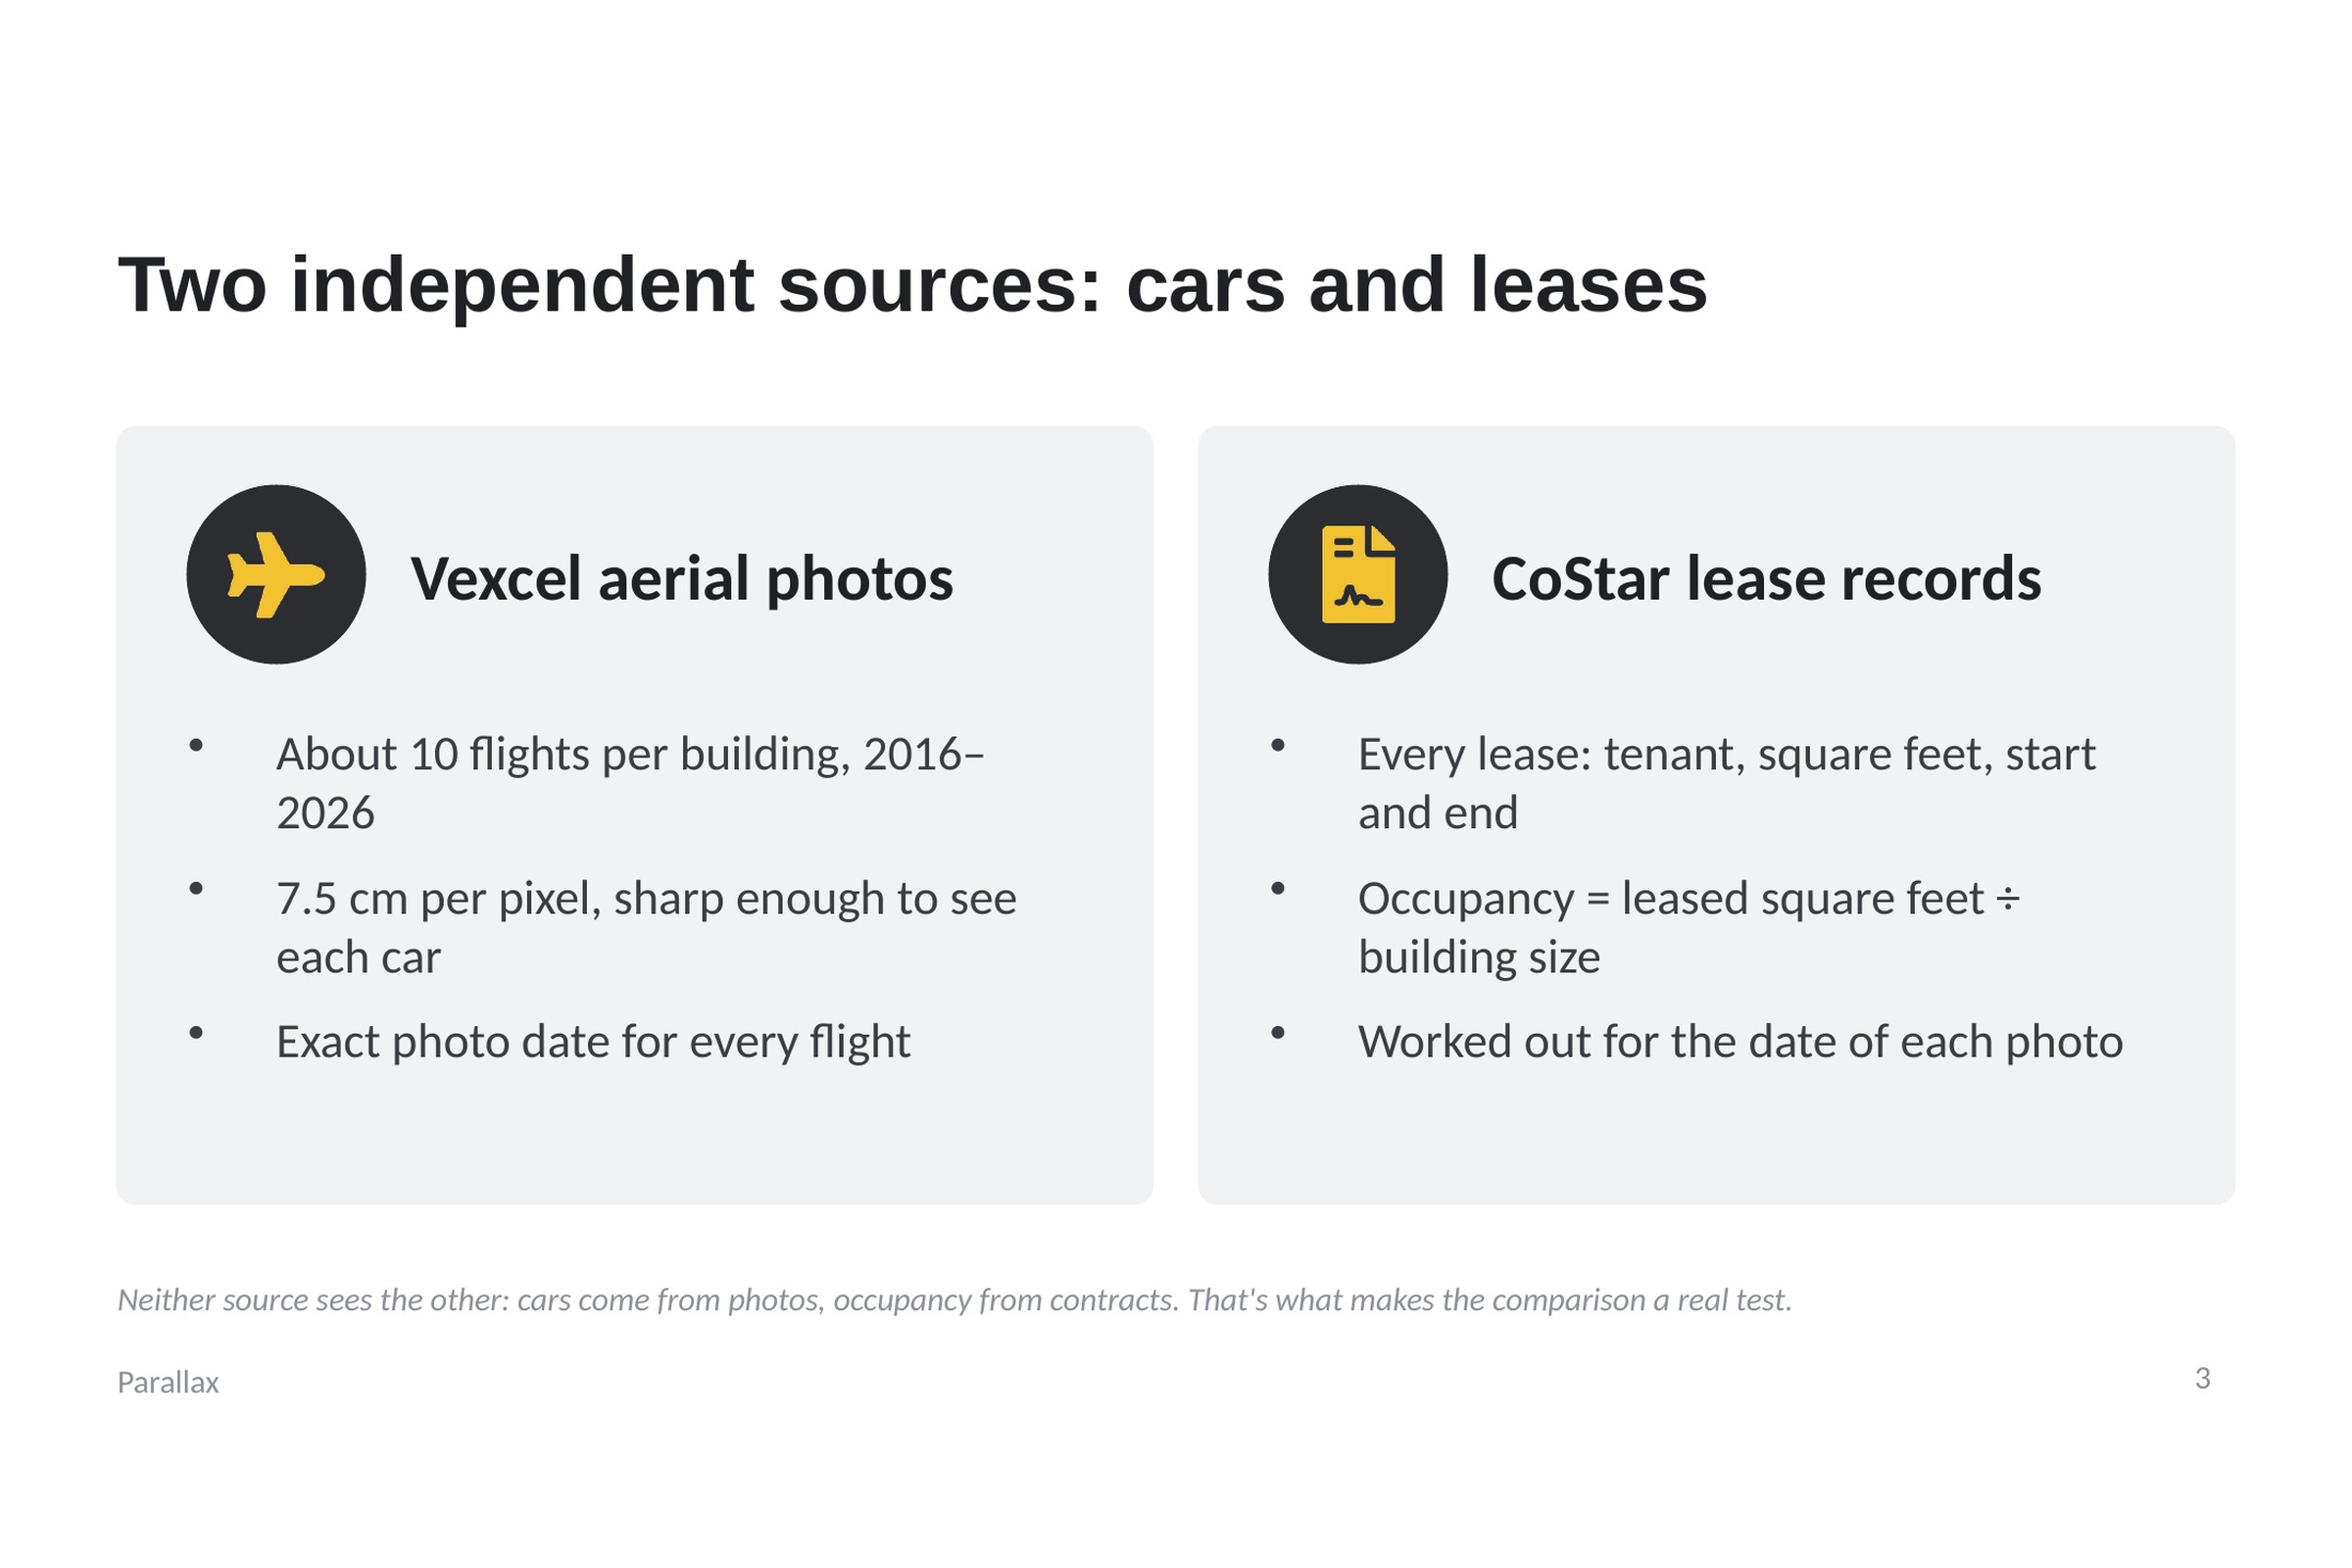
Two independent sources: Vexcel aerial photos show the cars, CoStar lease records show the occupancy. Neither can see the other.
-
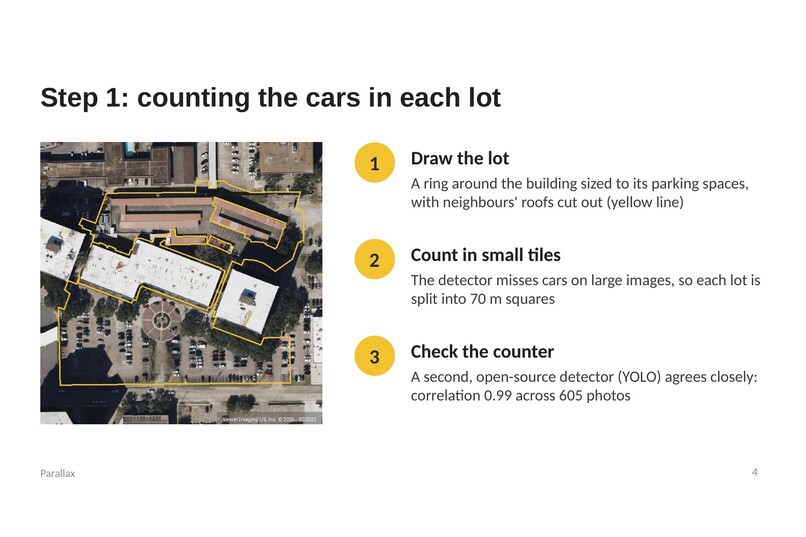
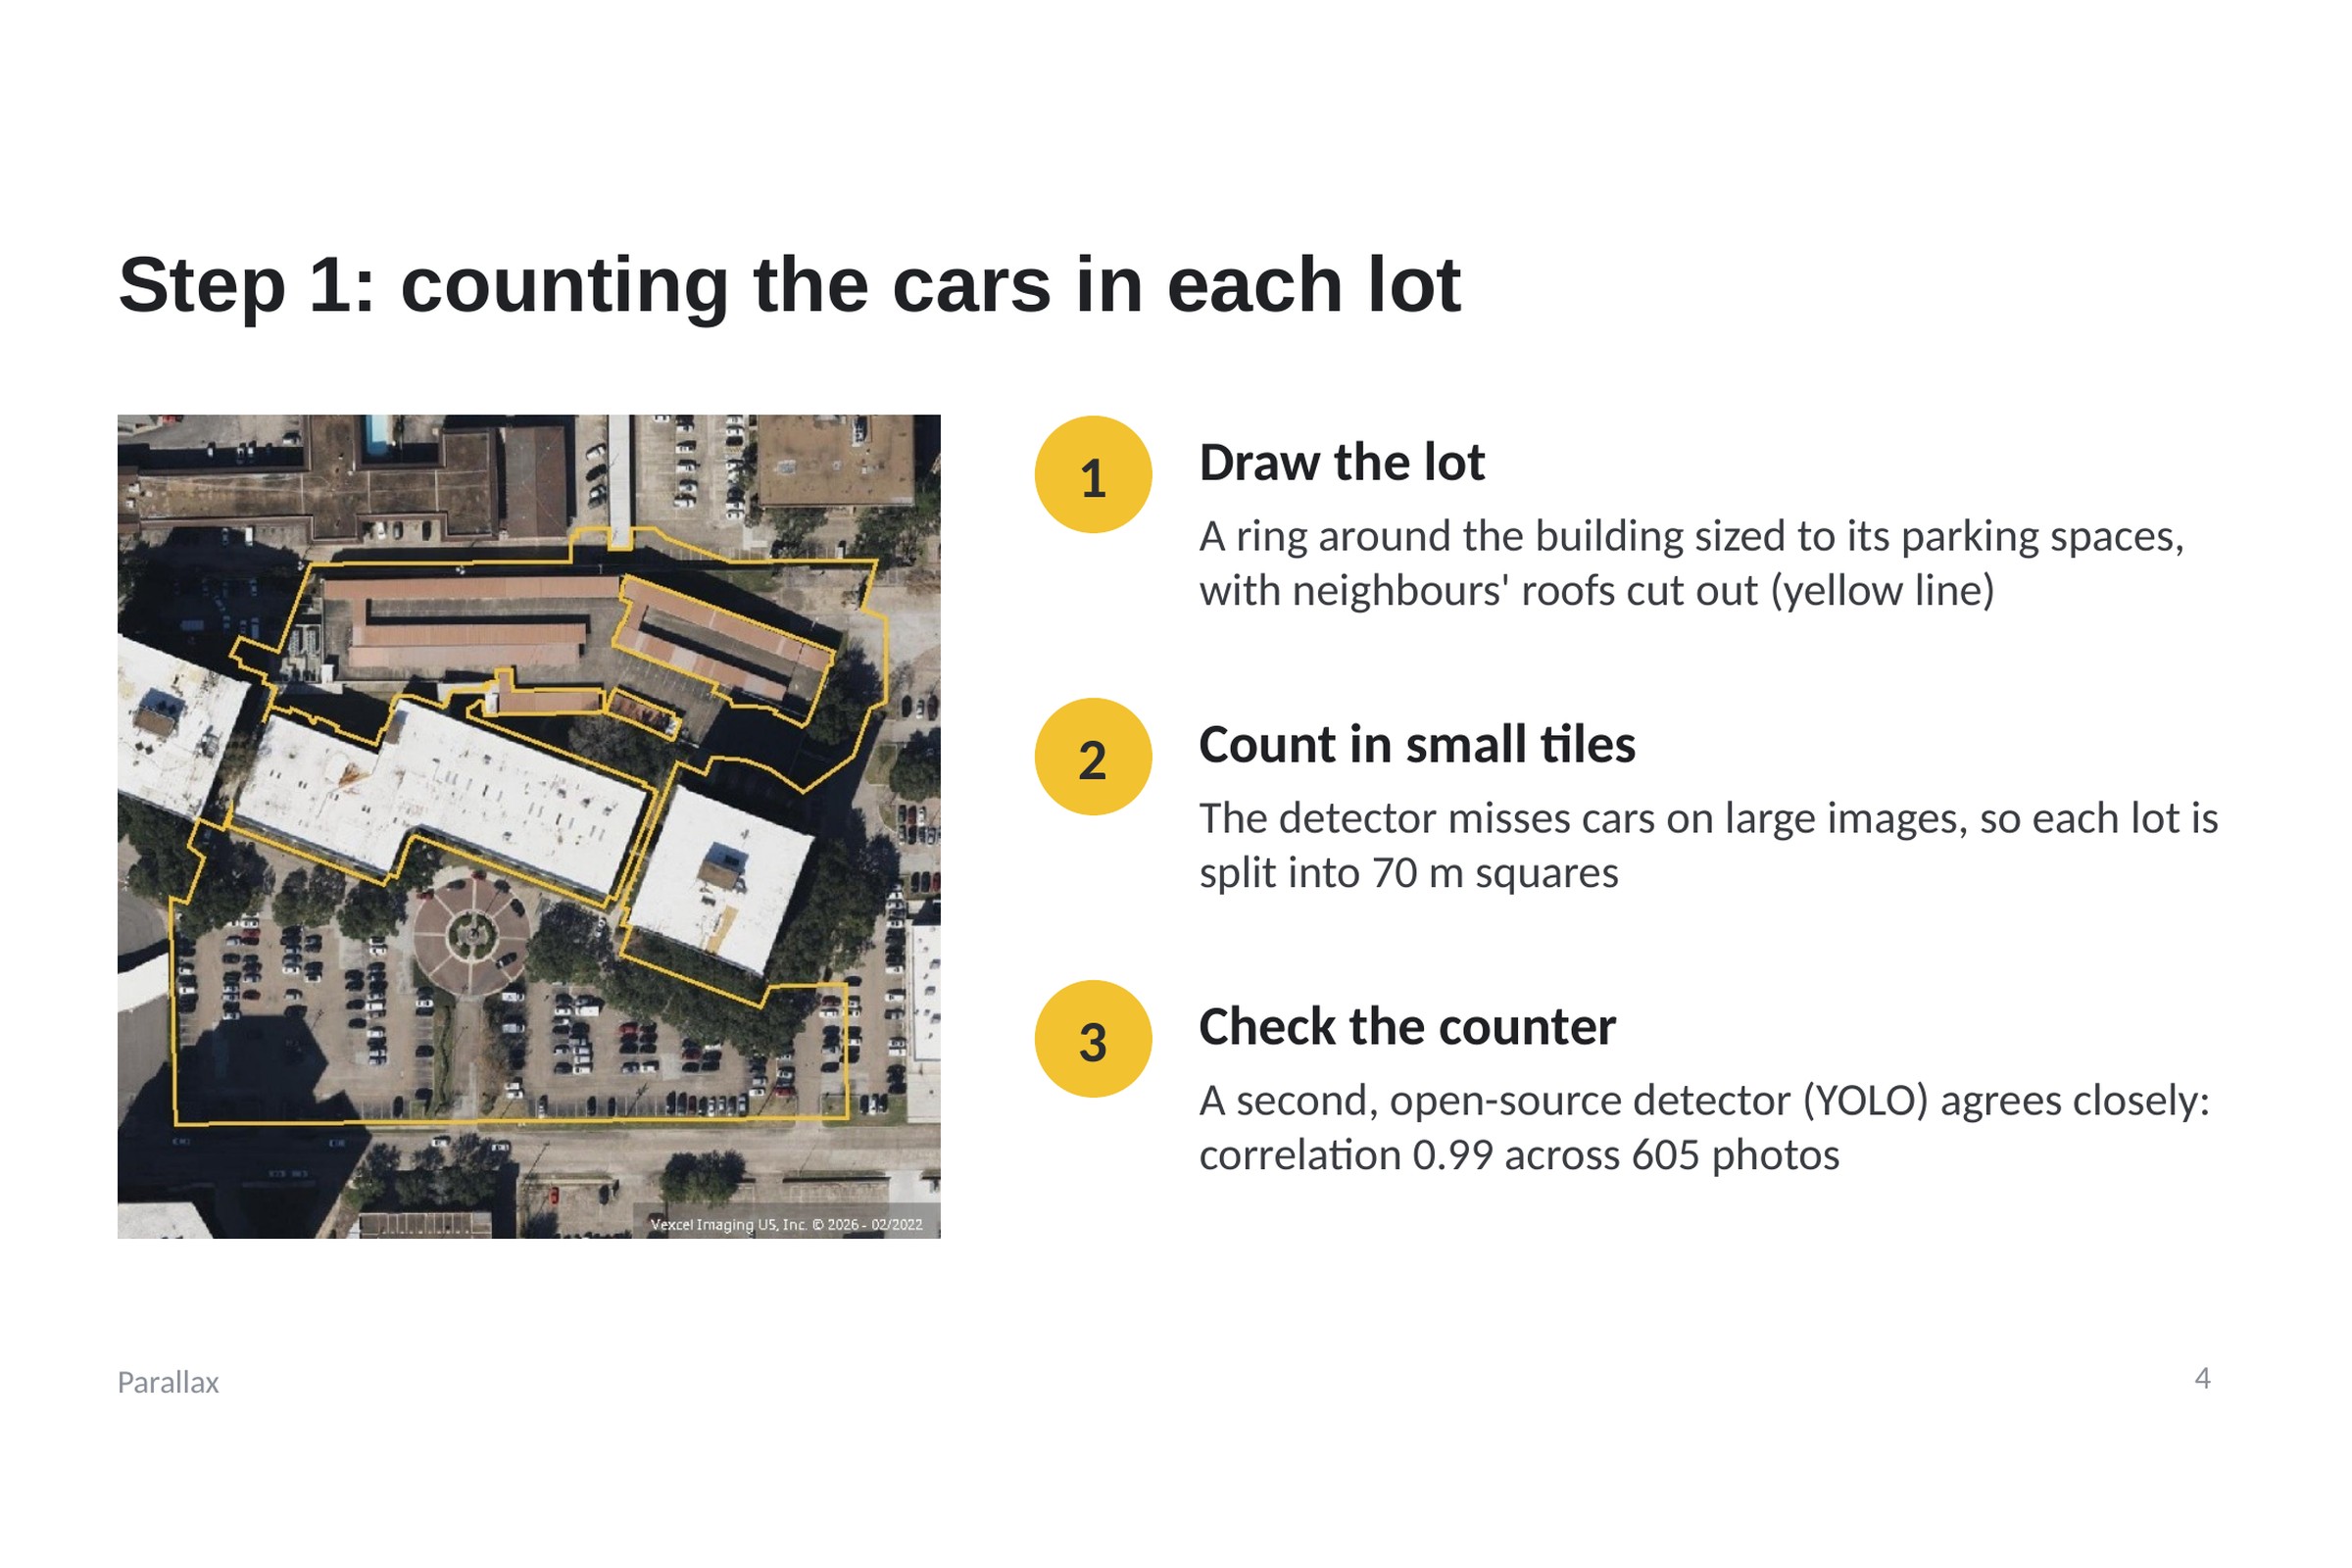
Counting cars: outline the lot, split it into small tiles, count each car. A second detector agrees closely (r = 0.99).
-
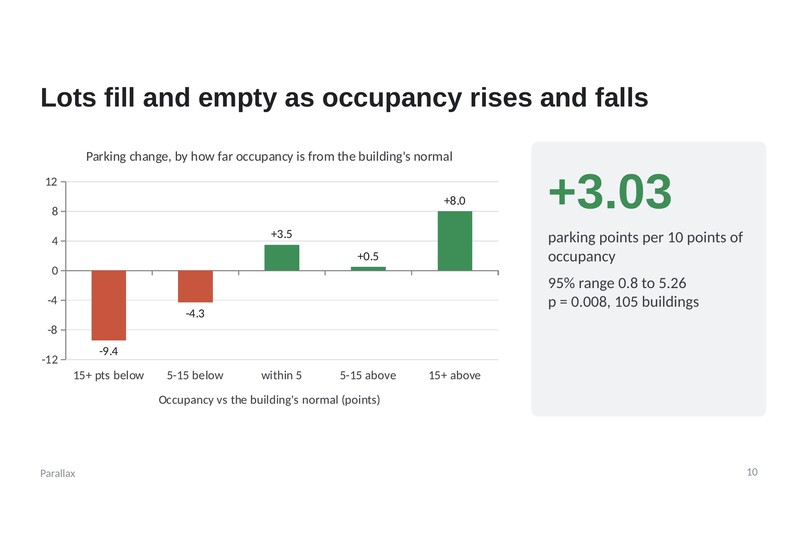
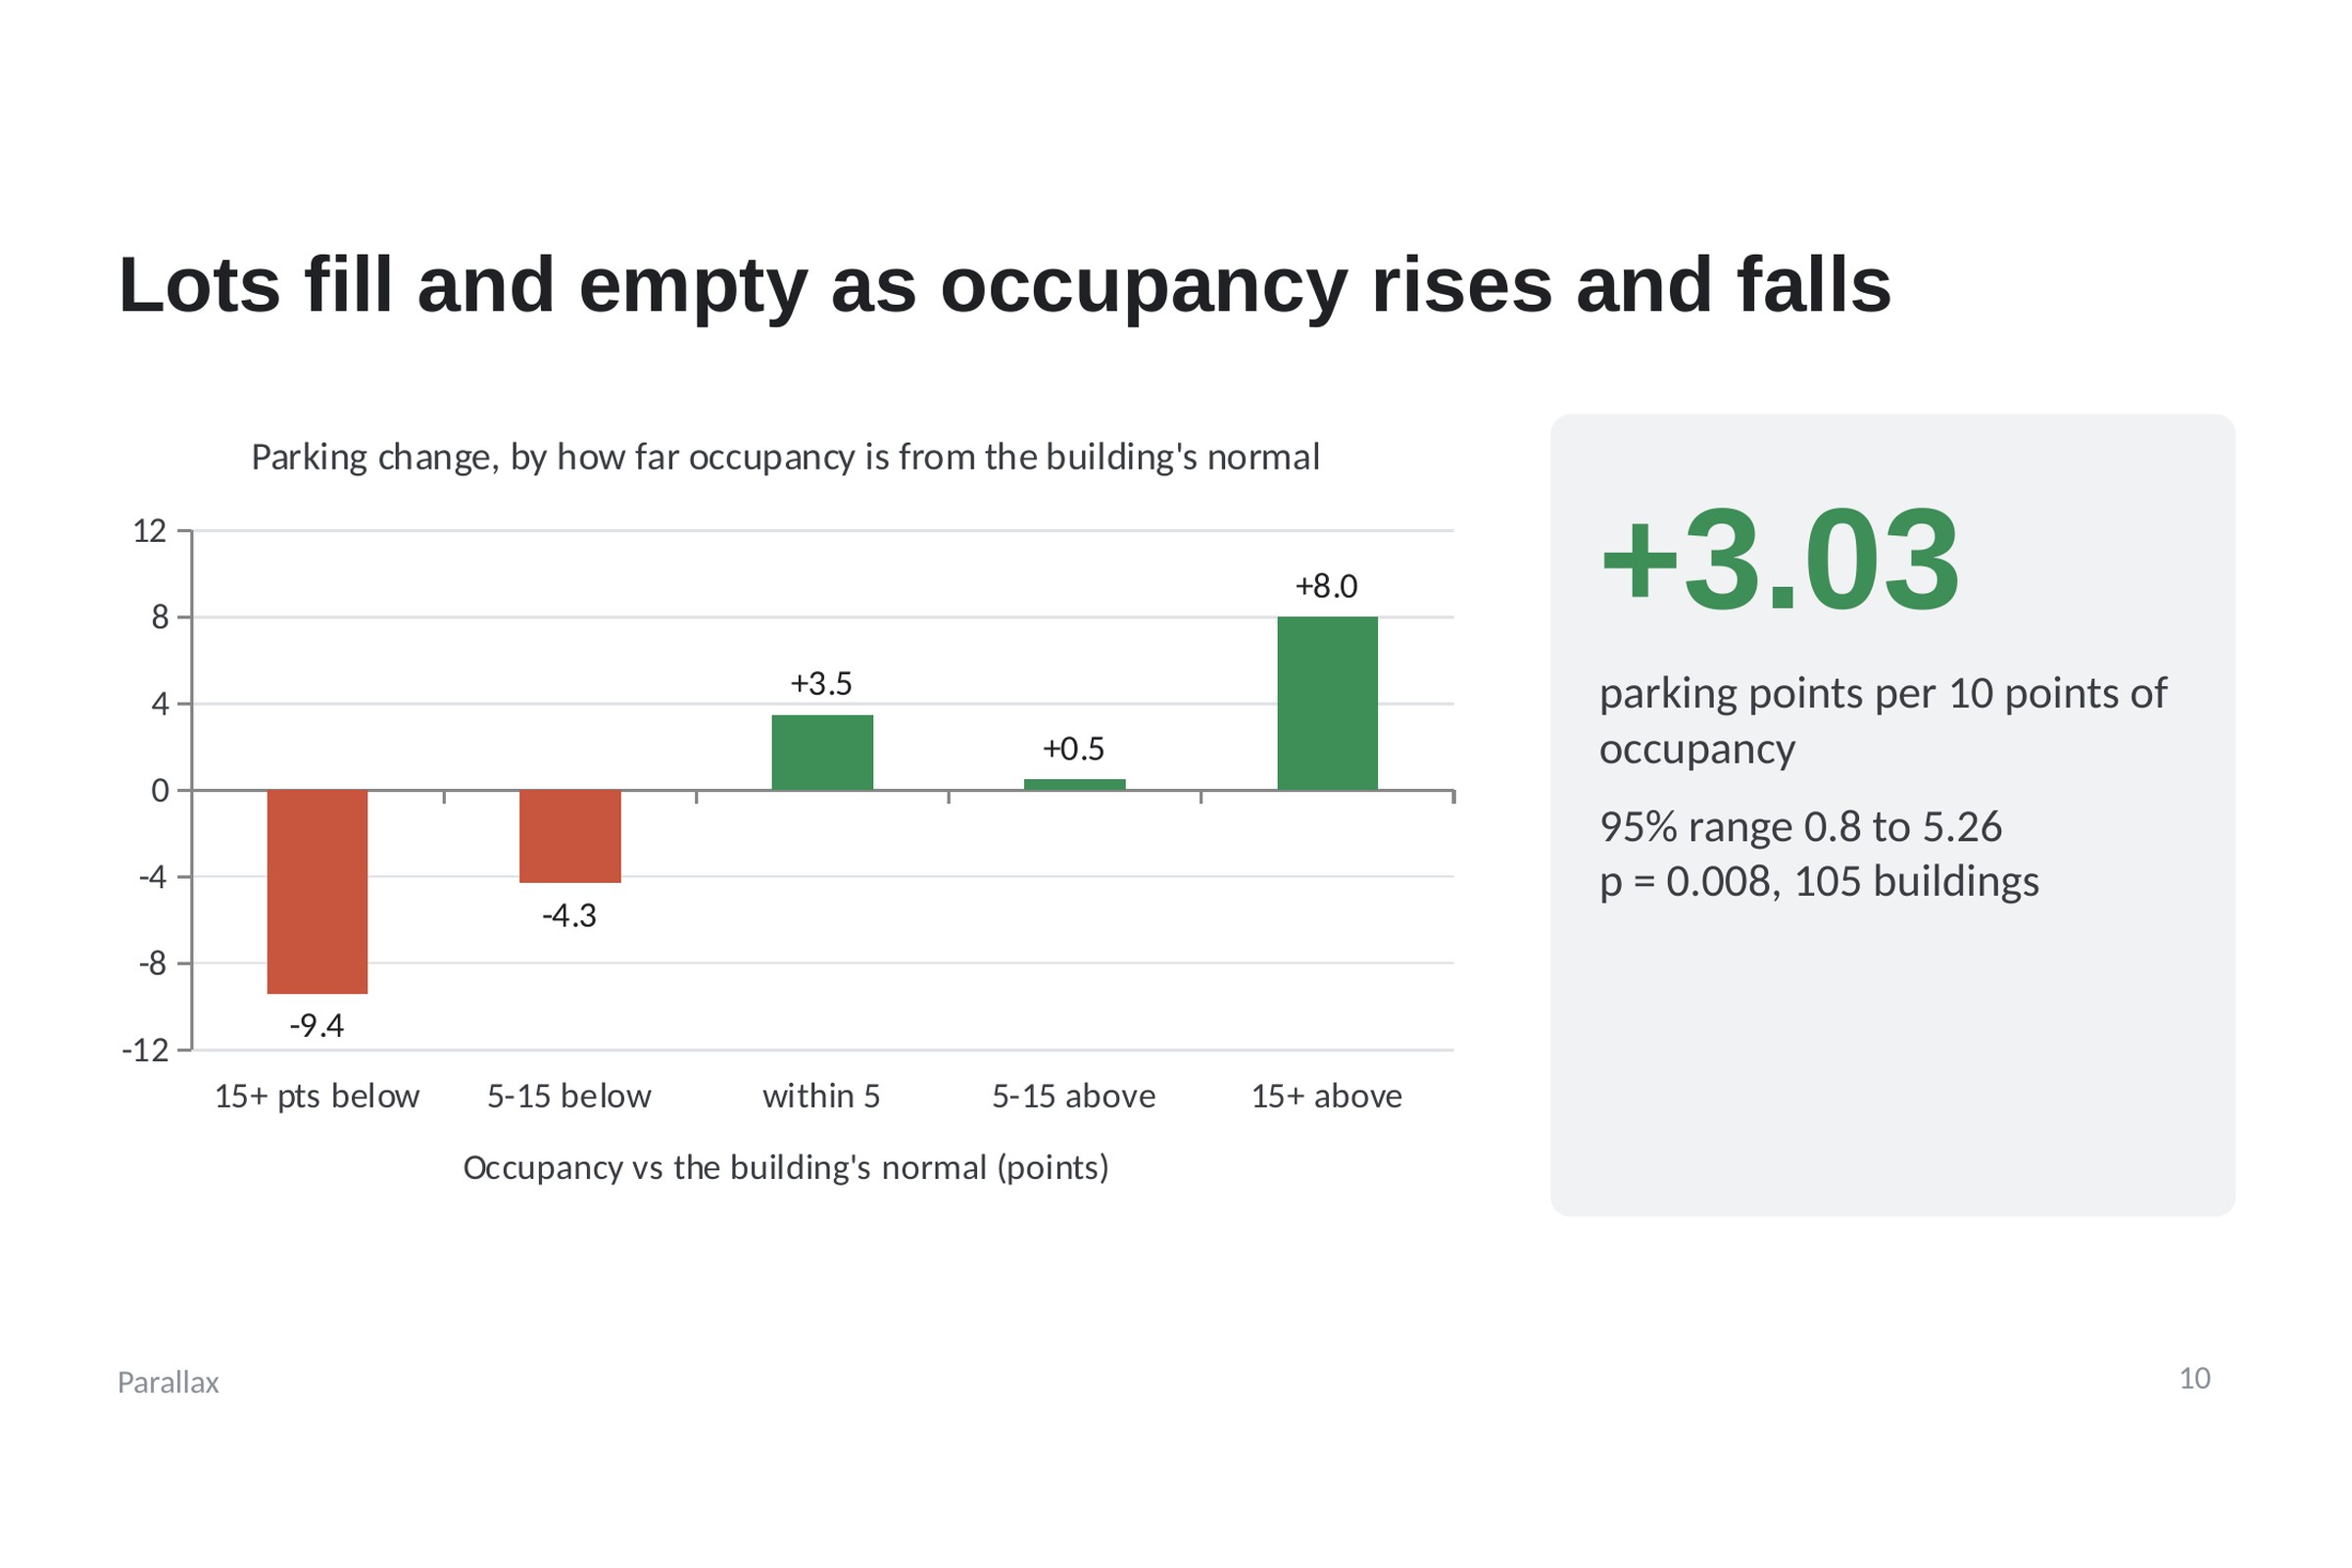
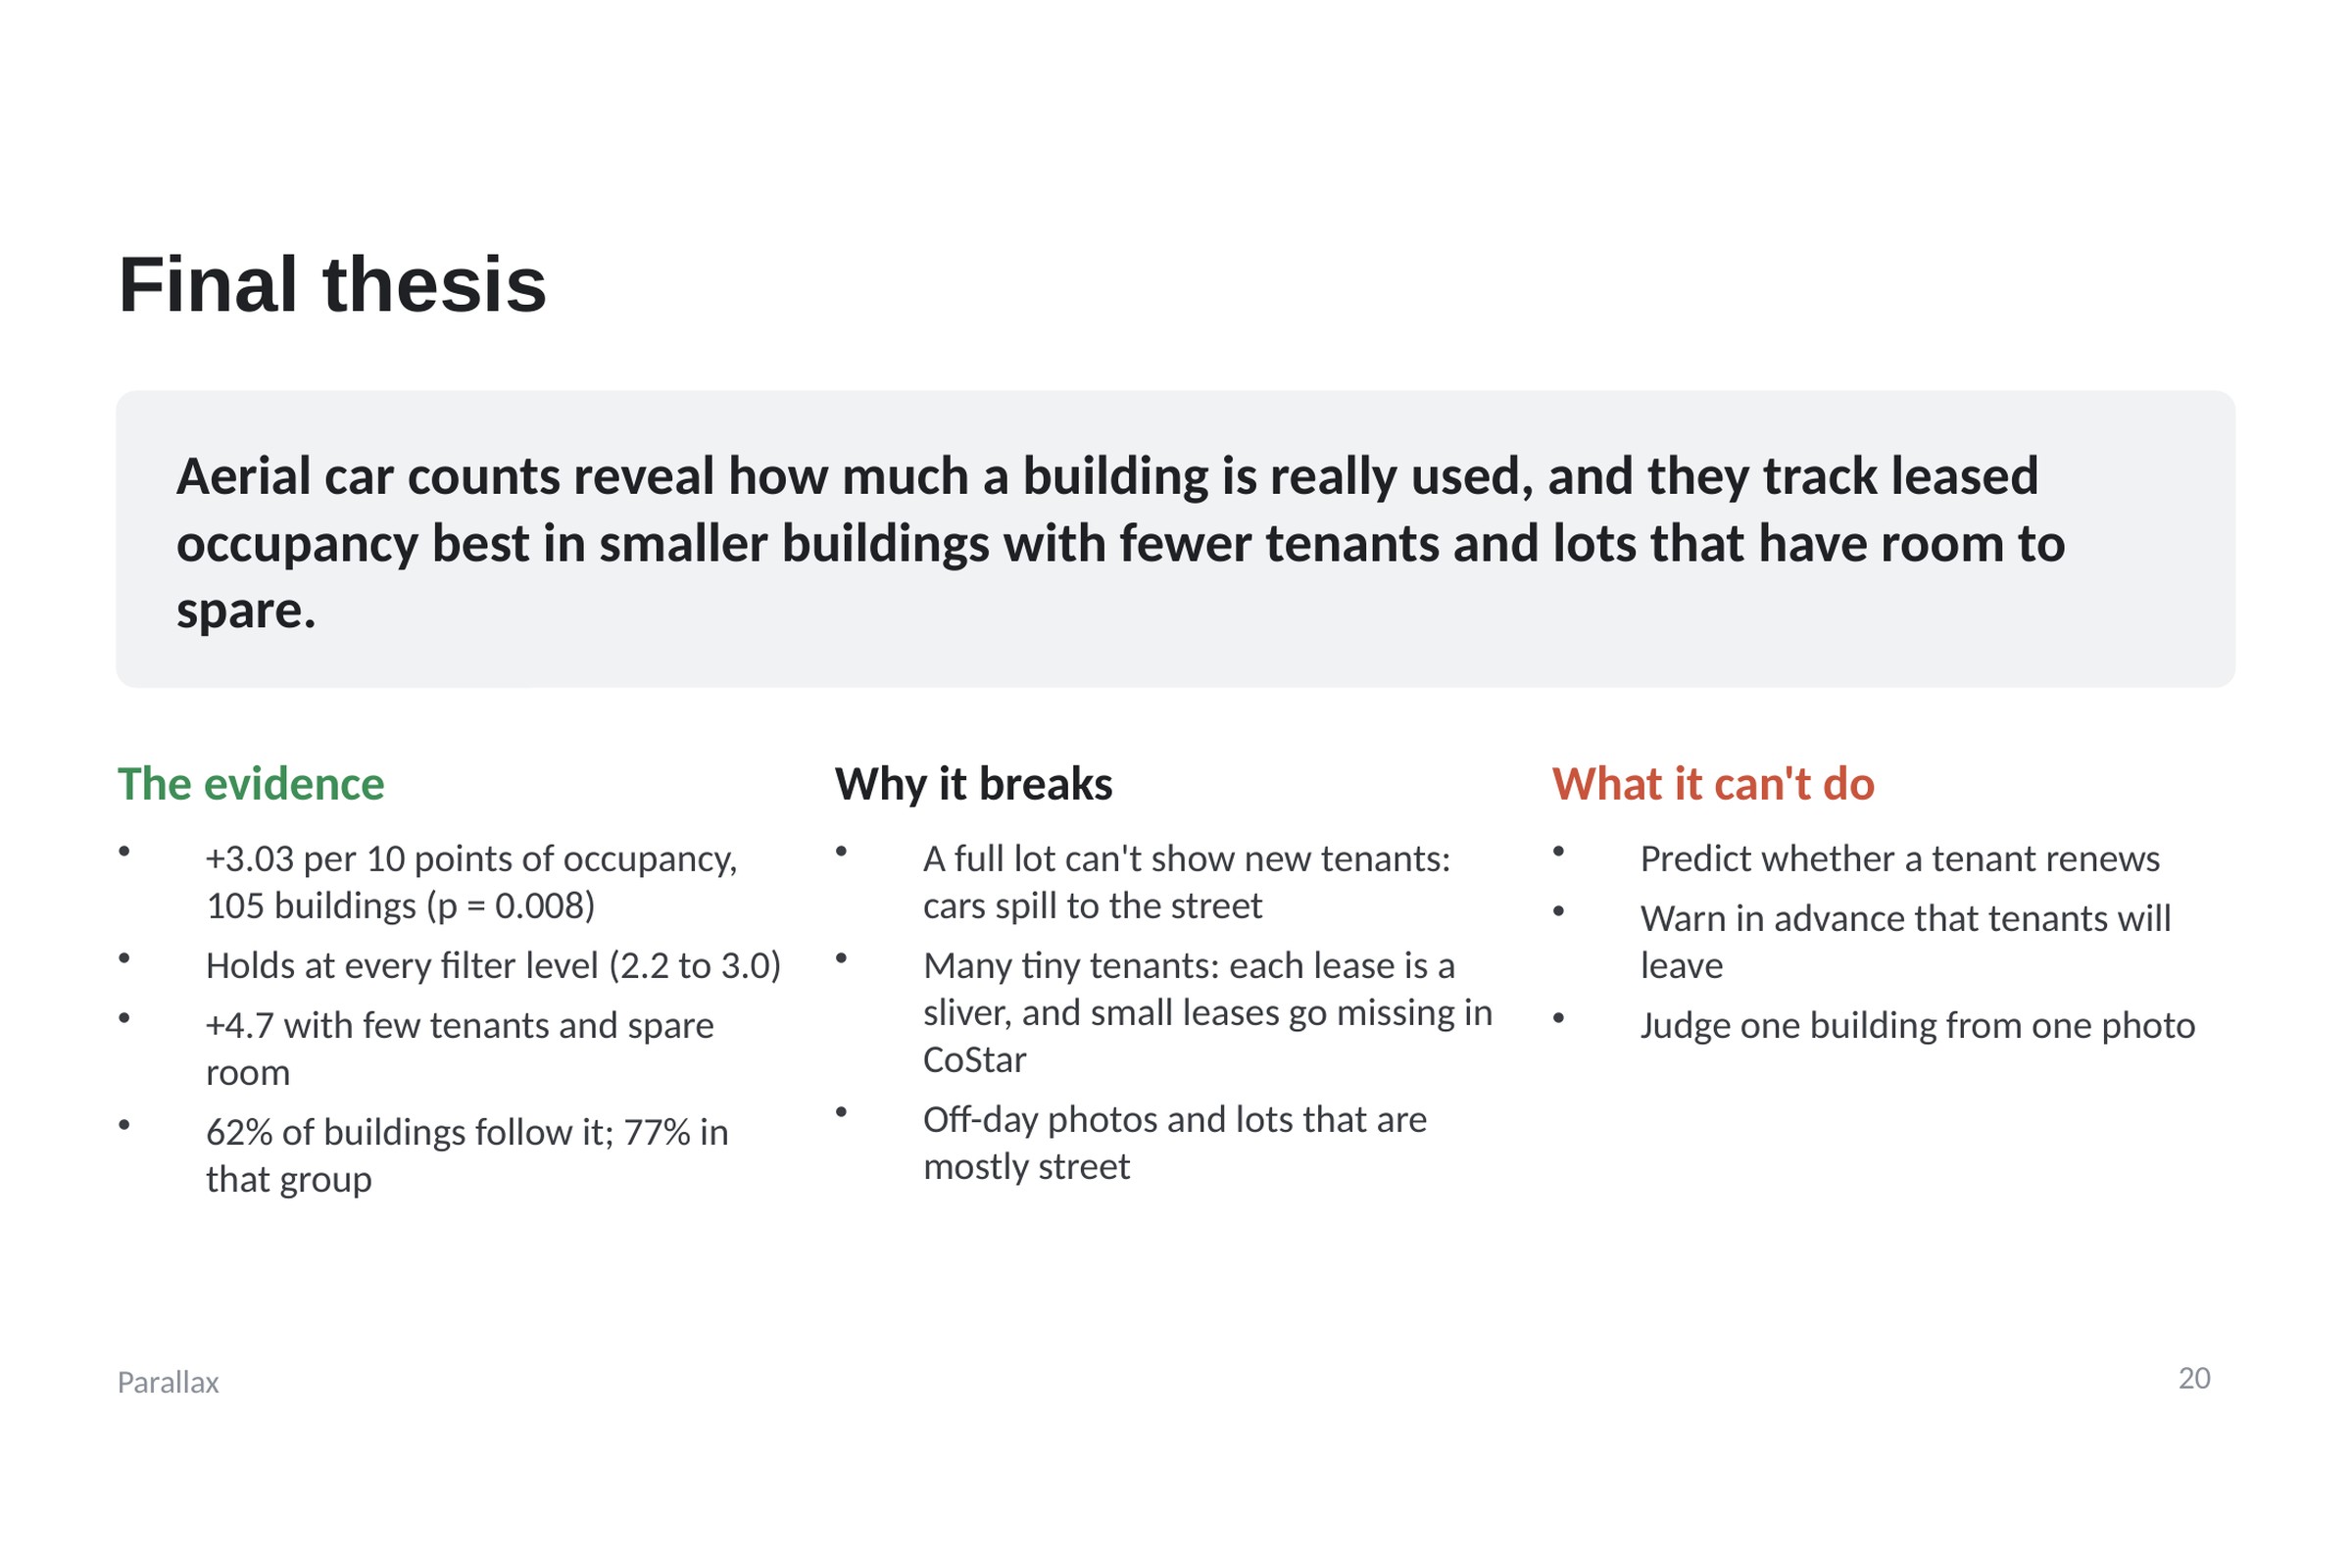
The result: lots fill and empty as occupancy rises and falls, about 3 parking points per 10 points of occupancy (p = 0.008).
-
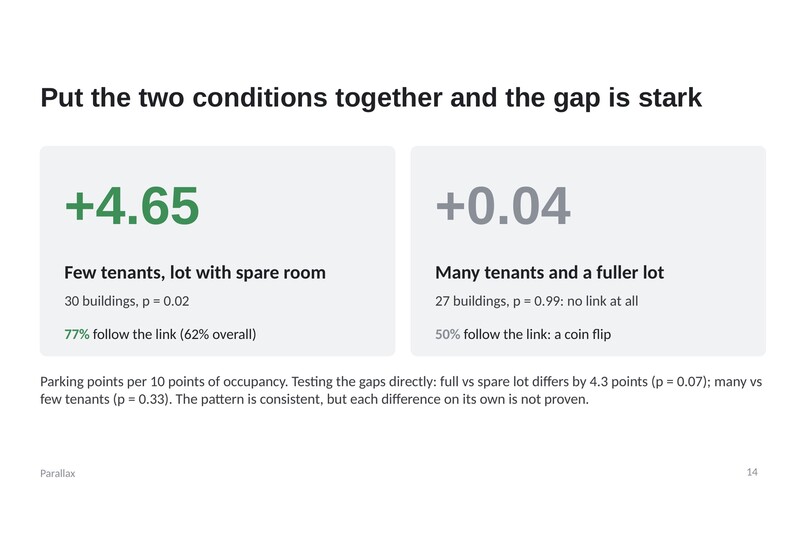
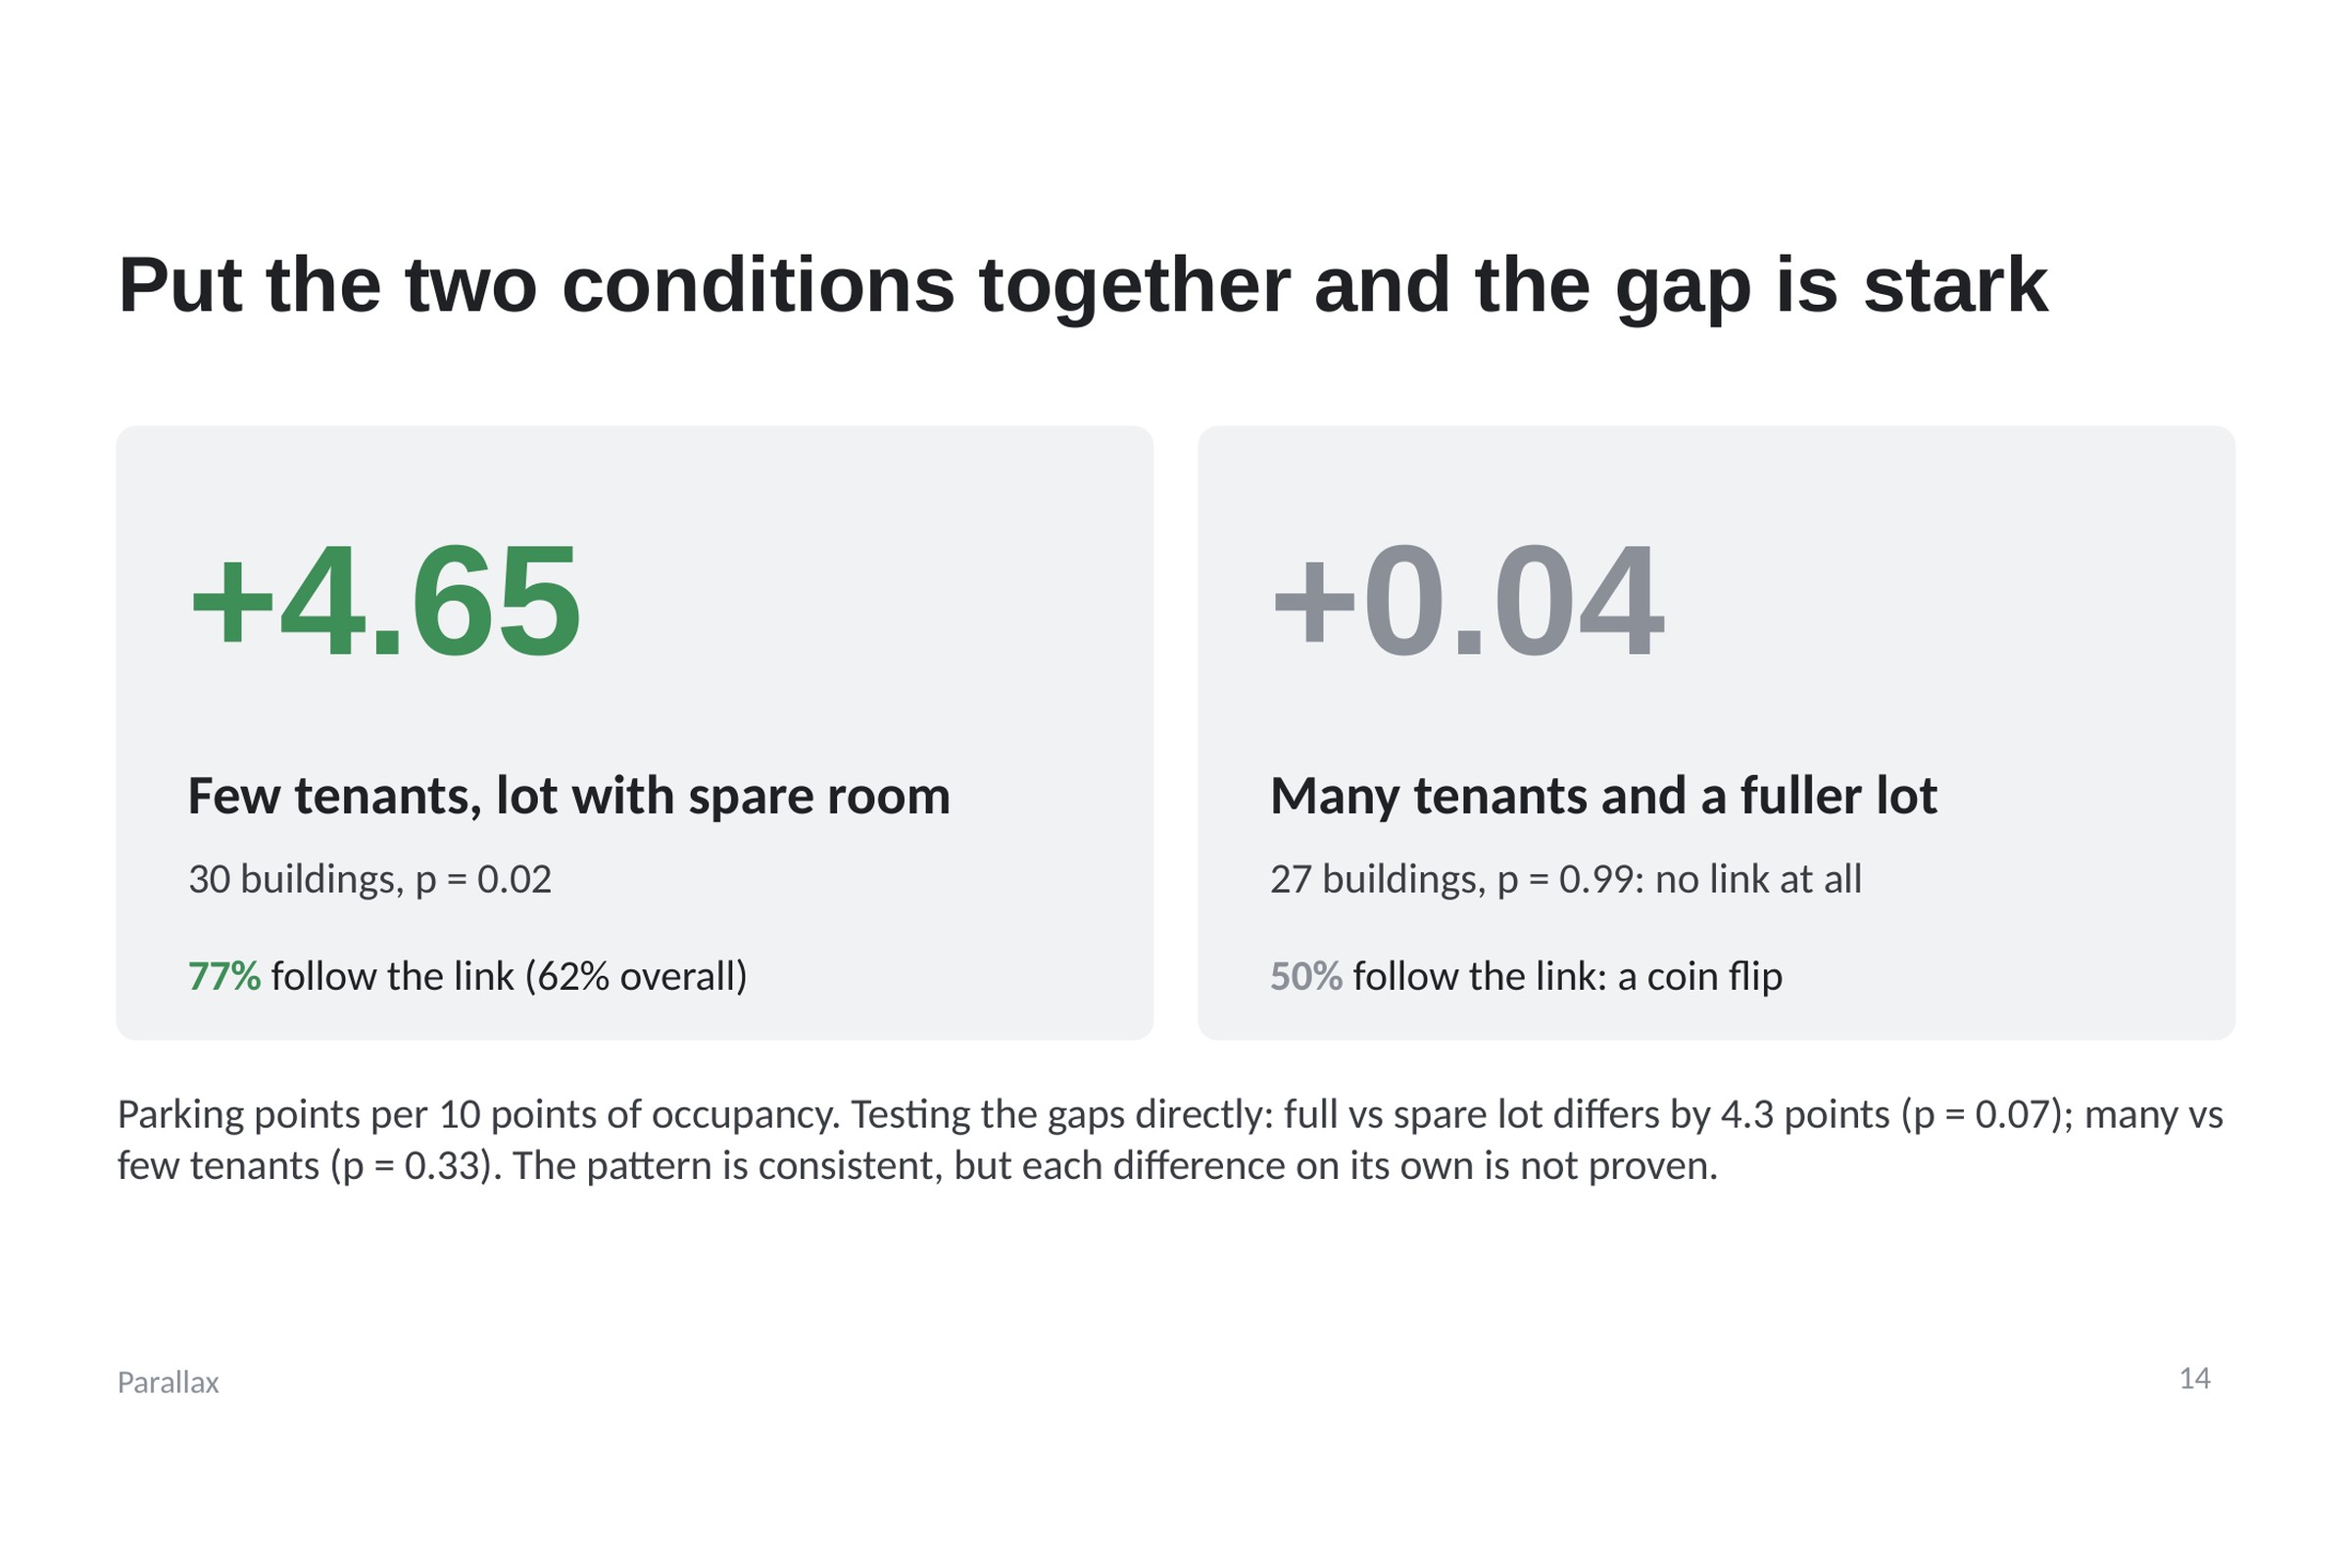
Few tenants and a spare lot: 77% of buildings follow the link. Many tenants and a fuller lot: no link at all.
-
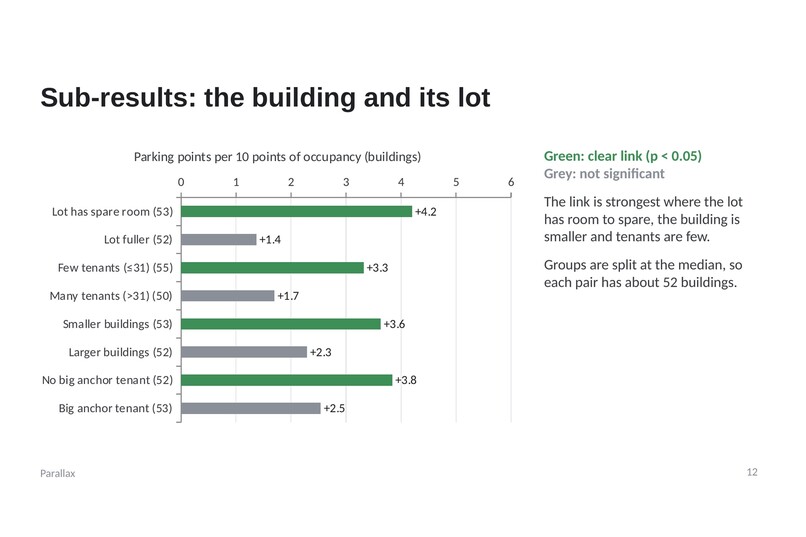
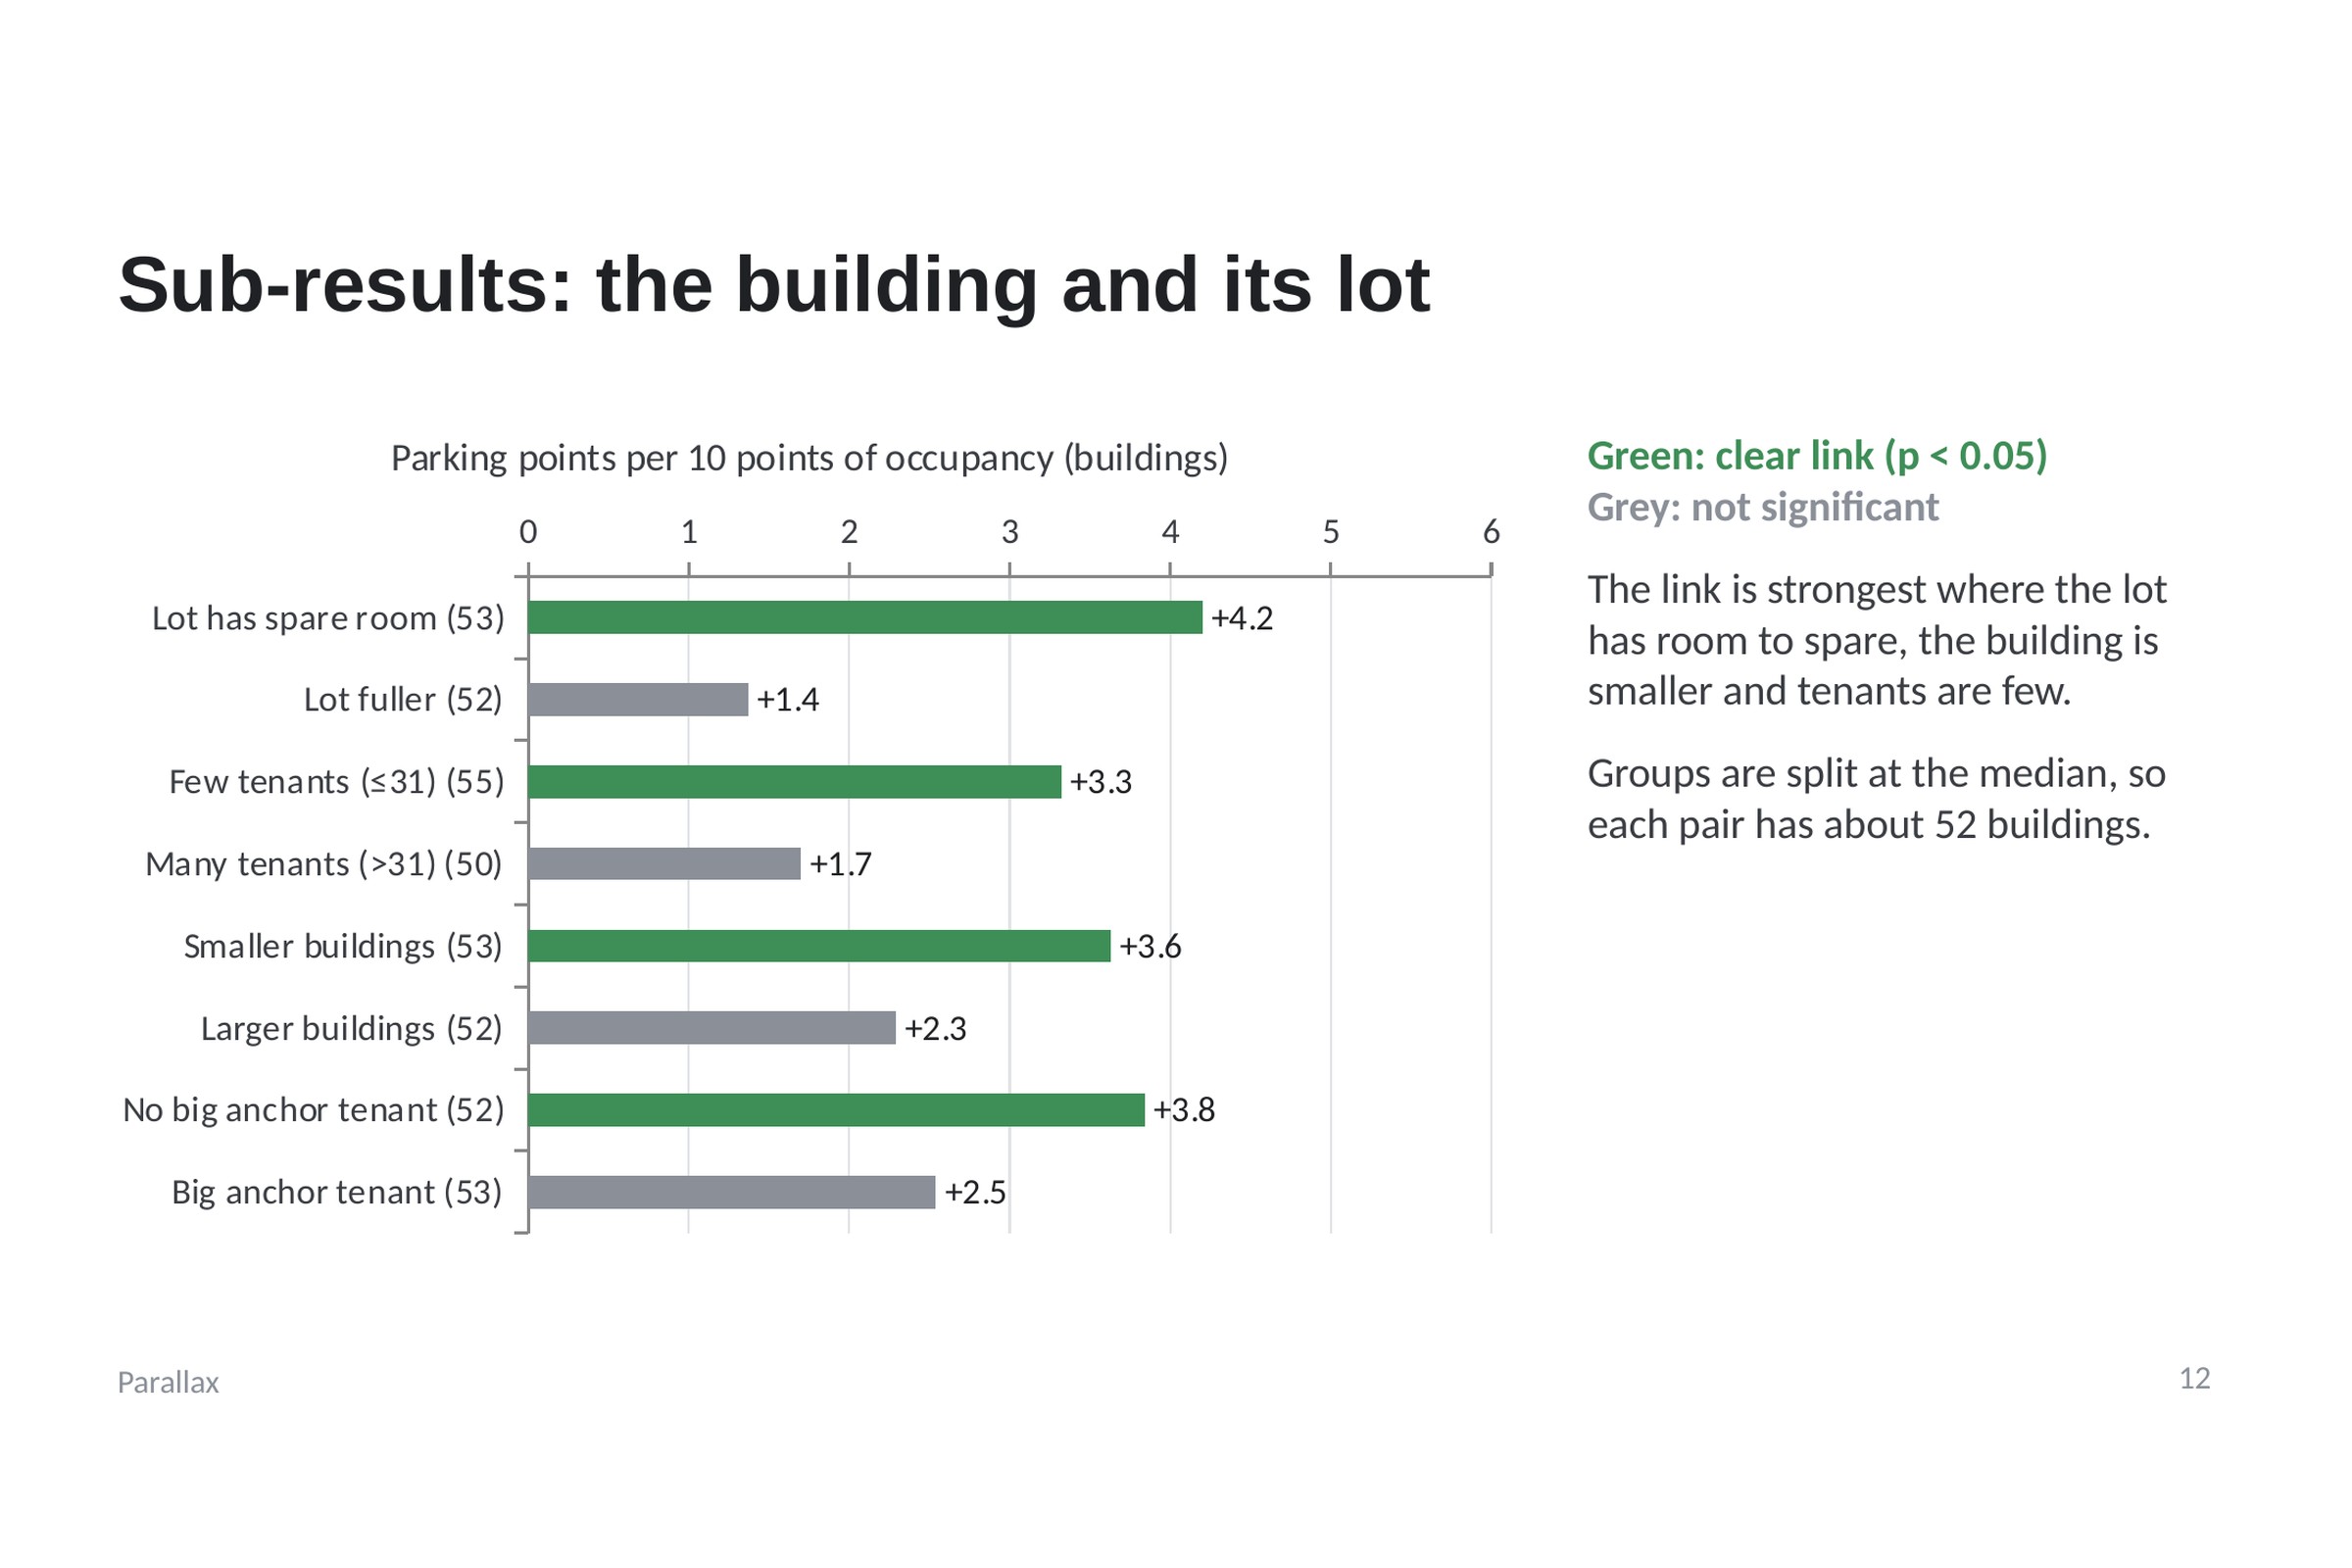
Sub-results: the link is strongest in smaller buildings with fewer tenants, no big anchor, and lots with room to spare.
-
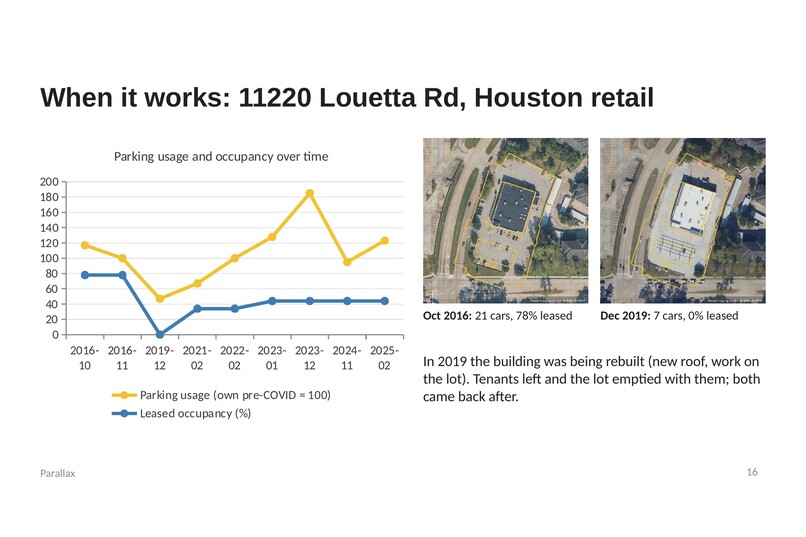
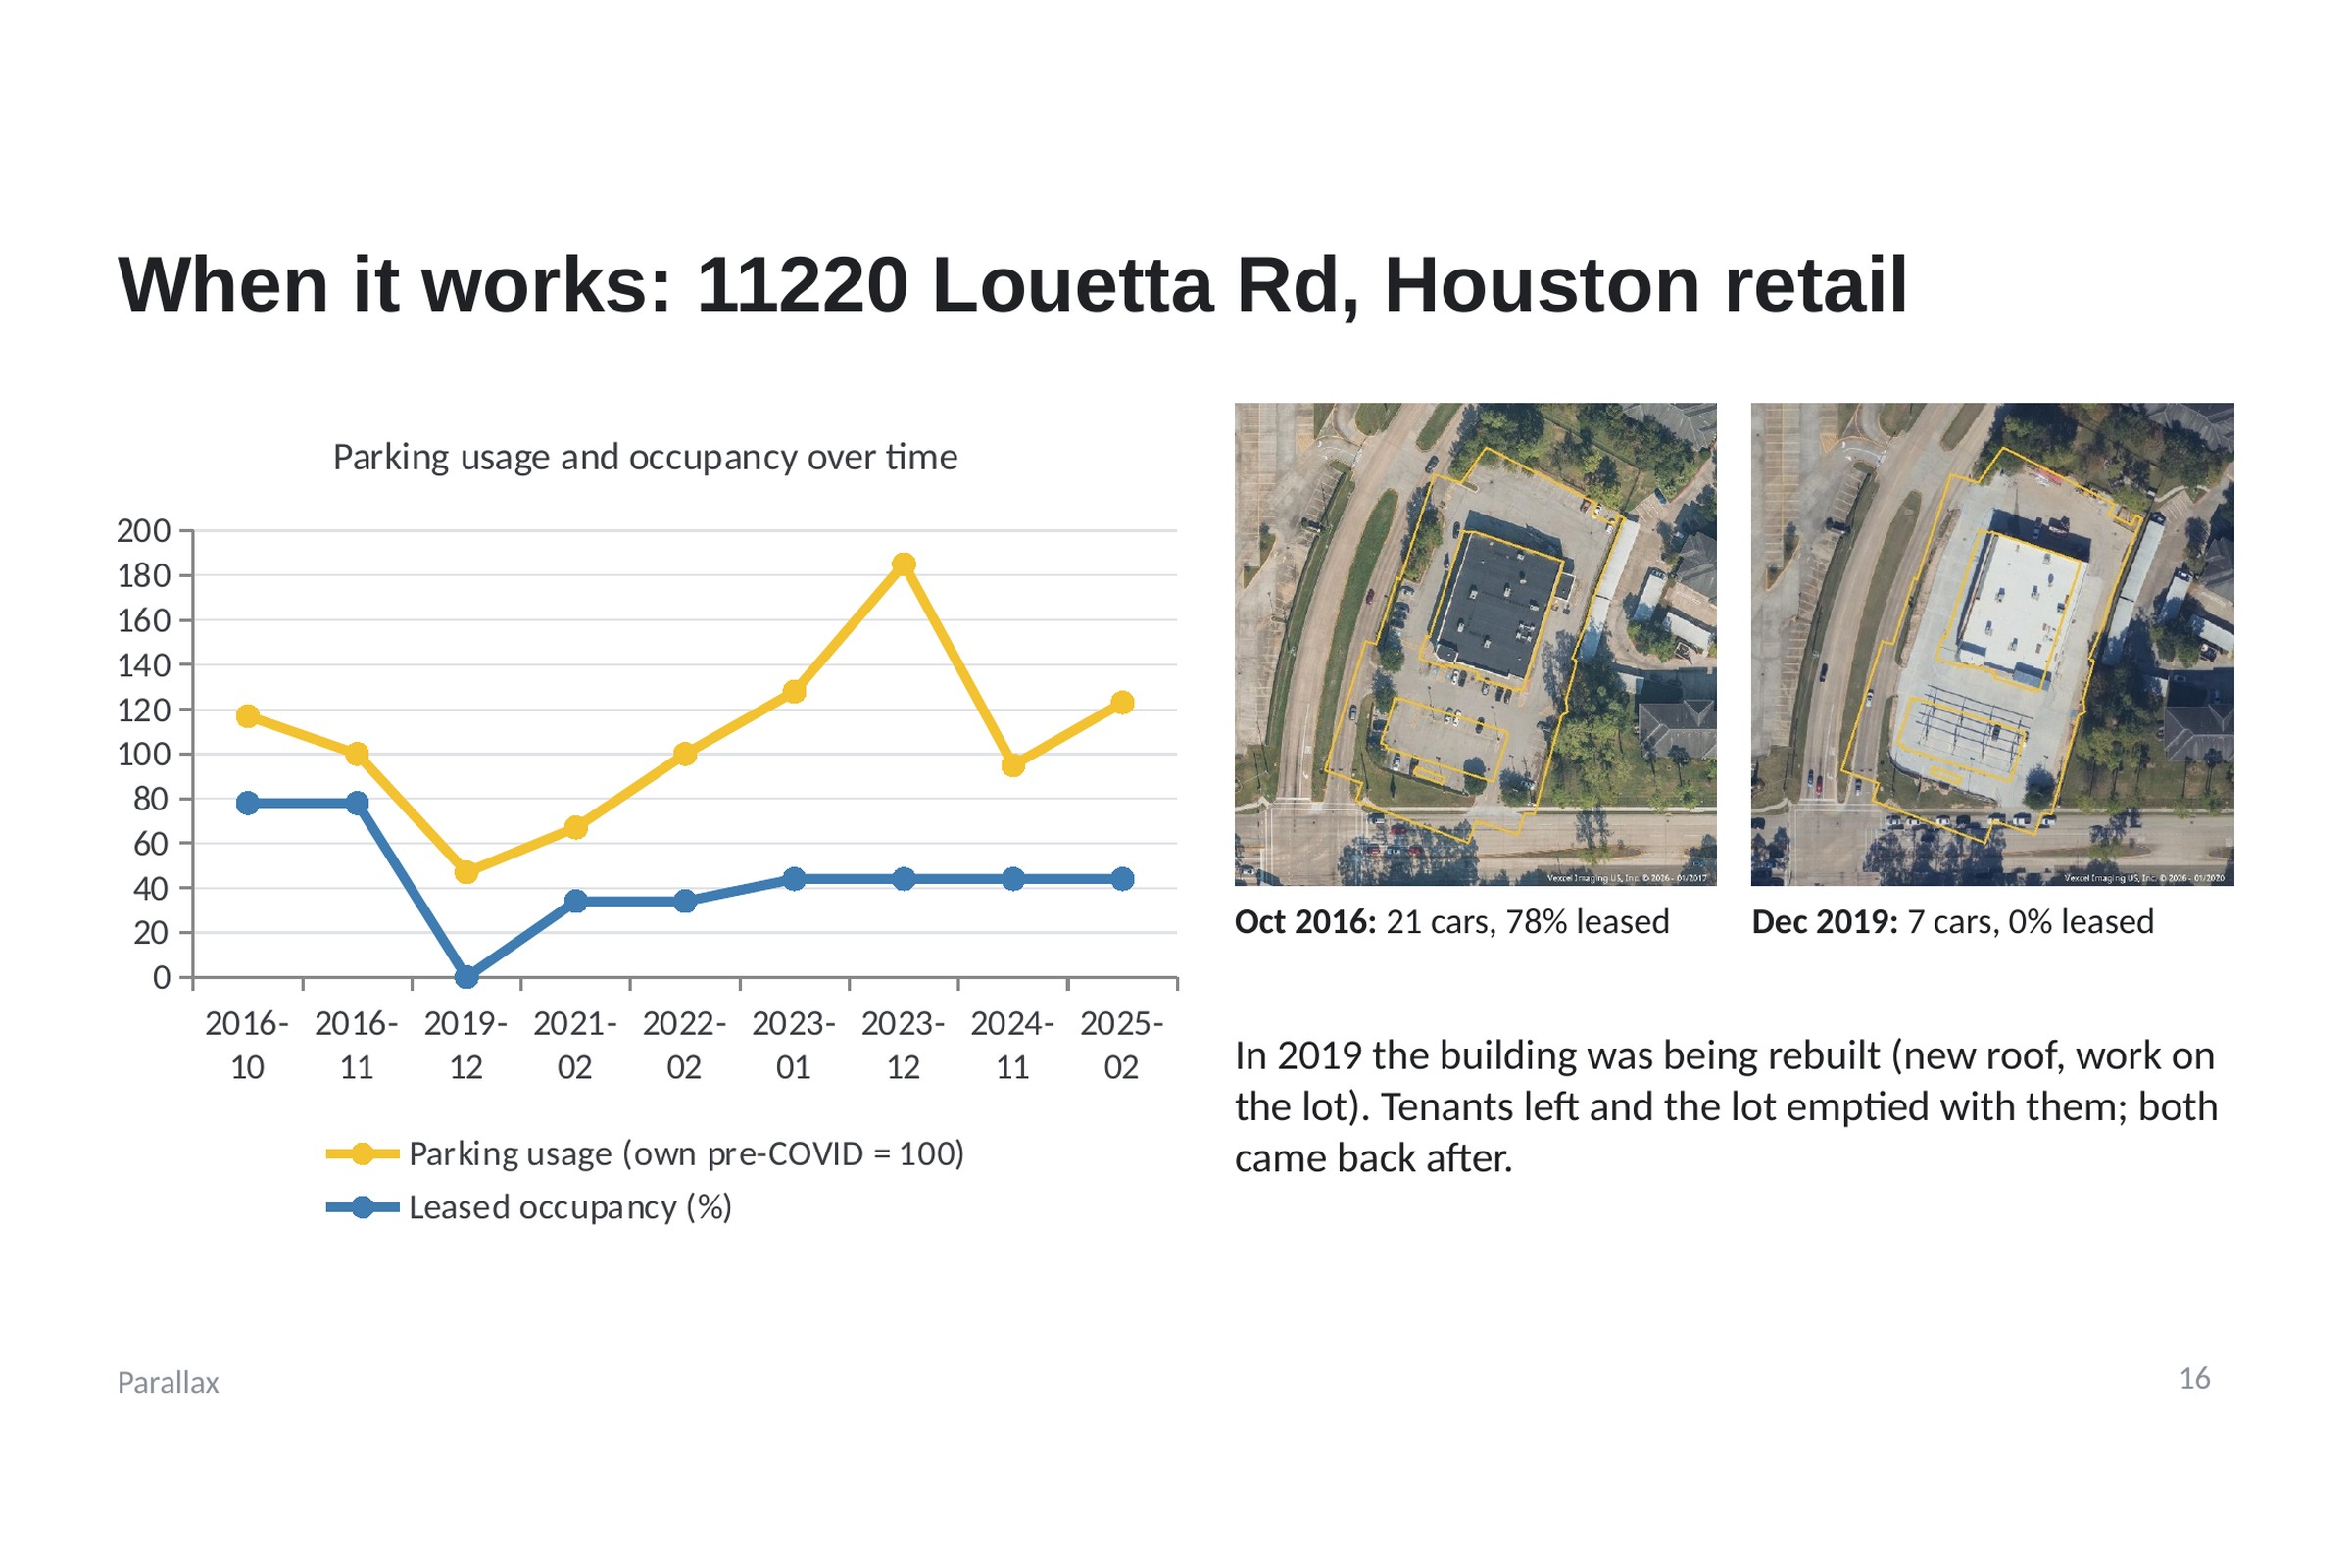
When it works: at 11220 Louetta Rd, tenants left during a rebuild and the lot emptied with them, then both came back.
-
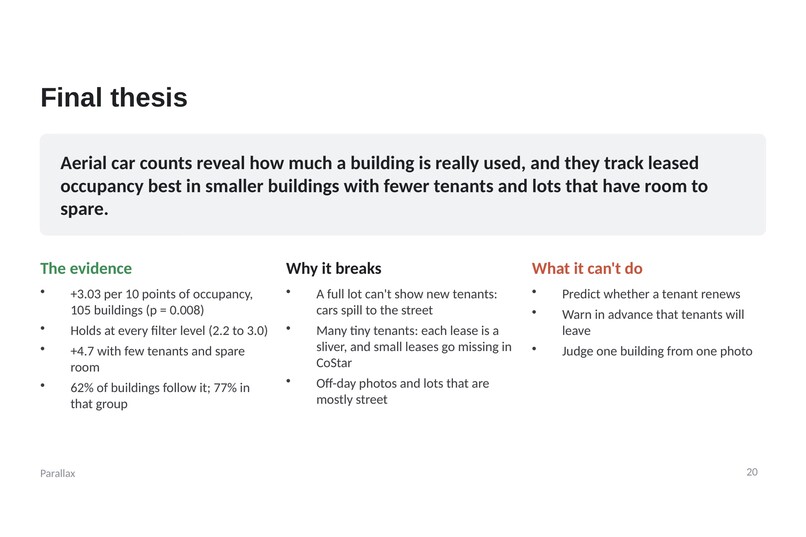
Final thesis: aerial car counts show how much a building is really used. Strong across a portfolio, not a verdict on one building.
Inspiration
Quant funds count cars in Walmart parking lots to predict sales before earnings. We asked whether the same works for commercial buildings: does an emptying lot show tenants leaving before the lease records do?
What it does
Parallax checks CoStar lease records against Vexcel aerial photos of each building's parking lot, 2016 to 2026. It counts the cars, scores each lot against its own normal level, and tests whether parking moves with occupancy.
An AI agent plans and runs the analysis, then shows its evidence with lot photos from then and now. The Building screen ranks every building:
- Risk: leased on paper, but the lot is emptying. A warning for lenders and owners.
- Investment: the lot is busier than the leases suggest. A lead for investors and brokers.
How we built it
- Imagery: Vexcel API for aerial photos, building outlines and parcels in Houston and LA.
- Car counts: a YOLO11 detector, checked against Vexcel's own detector (r = 0.99).
- Cleaning: dropped weekend and holiday photos, and lots whose outline was mostly street.
- Statistics: a fixed-effects regression that compares each building only with itself, plus a placebo test:
$$ U_{it} = \beta \cdot \text{Occ}_{it} + \alpha_i + \gamma_t + \varepsilon_{it} $$
where \( U_{it} \) is building \( i \)'s parking usage on photo date \( t \), \( \text{Occ}_{it} \) its leased occupancy, \( \alpha_i \) the building's own baseline and \( \gamma_t \) the period.
- Agent: a LangChain deepagents planner with helper sub-agents.
- App: FastAPI backend and a Next.js frontend with a map.
Challenges we ran into
- Lot outlines included streets, so passing traffic counted as parked cars.
- Weekend photos made busy buildings look empty.
- Garages can't be seen from the air, so only 9 LA buildings were measurable.
- A silent API bug returned no photos for complex lot shapes.
Accomplishments that we're proud of
- A tested link: every 10 points of occupancy means about 3 points more parking (105 buildings, p = 0.008). A placebo with shuffled data shows no link.
- In buildings with few tenants and space to spare, 77% follow the pattern, against 62% overall.
- An agent that shows real photos as its evidence.
What we learned
- Cleaning the data mattered more than the model.
- Compare each building with itself, not with other buildings.
- A placebo test quickly tells you whether a result is real.
What's next for Parallax
- Alert lenders automatically when a new flight shows a building changing.
- Screen a lender's own list of loan addresses.
- More buildings and photos, especially in LA.
- Count the workstations in each building's Matterport scan to estimate the most cars it could ever need, so the lot's fill is measured against real capacity.
Built With
- anthropic
- claude
- computer-vision
- costar
- deepagents
- duckdb
- fastapi
- langchain
- leaflet.js
- matterport
- next.js
- numpy
- openstreetmap
- pandas
- python
- react
- scikit-learn
- shapely
- statsmodels
- typescript
- ultralytics
- uvicorn
- vexcel
- yolo
