-
-
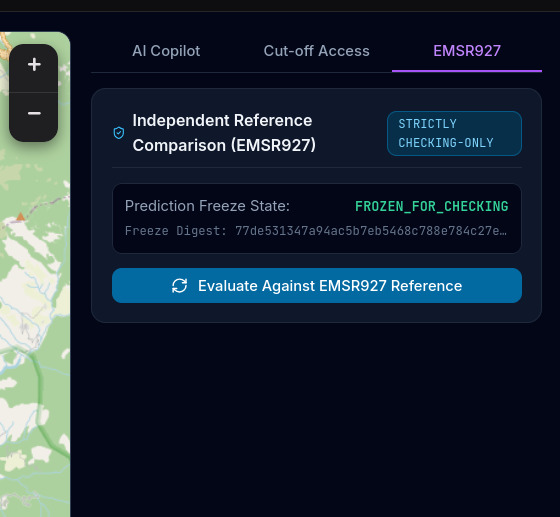
EMSR927
-
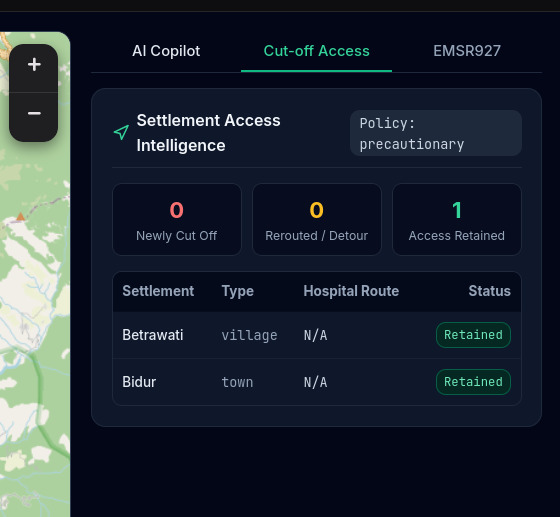
Cut off access
-
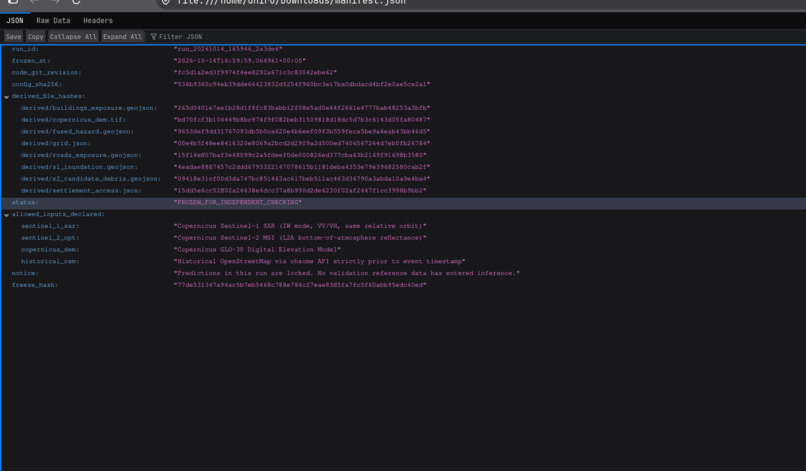
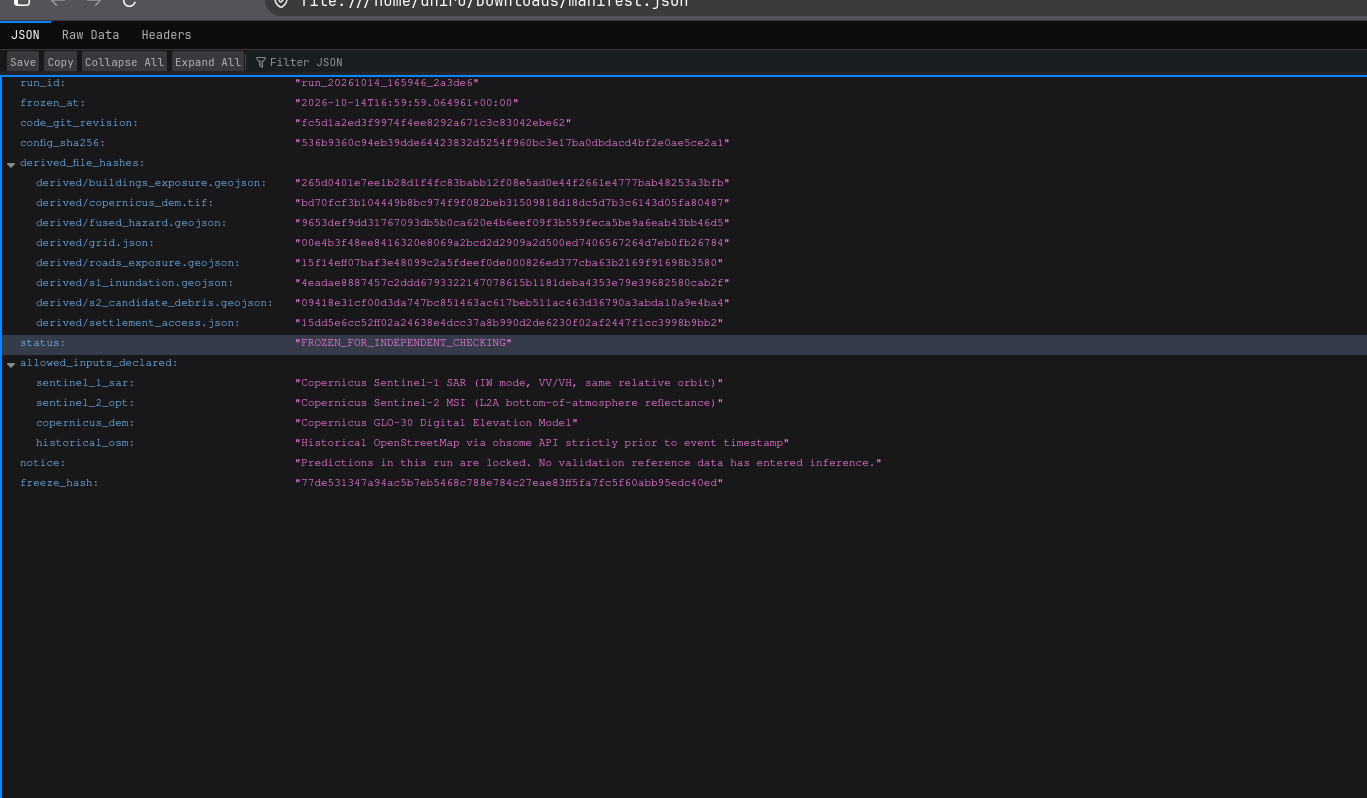
manifest JSON
-
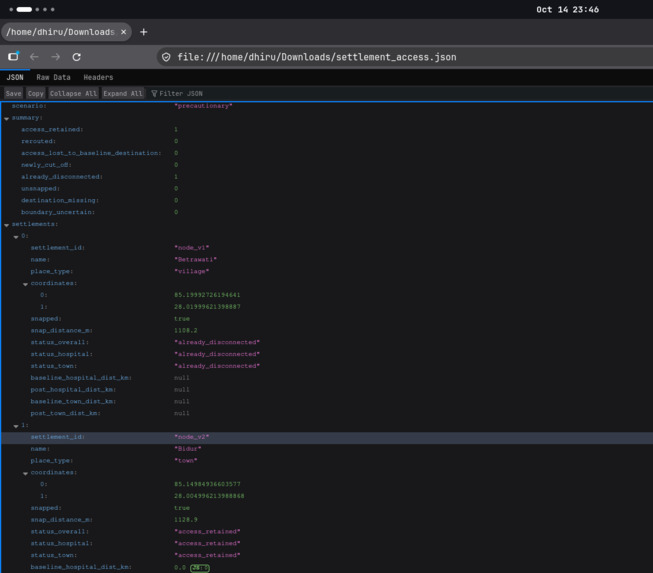
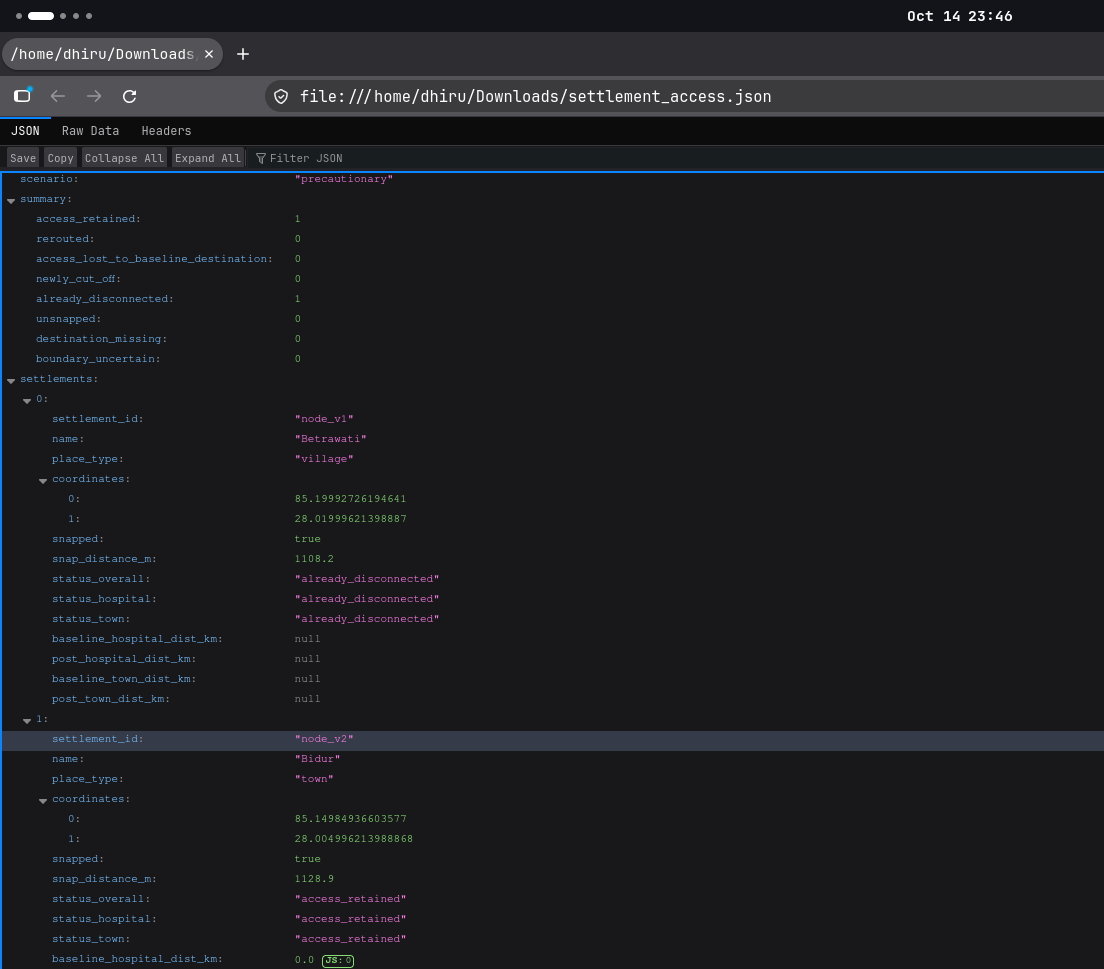
Settlement access JSON
-
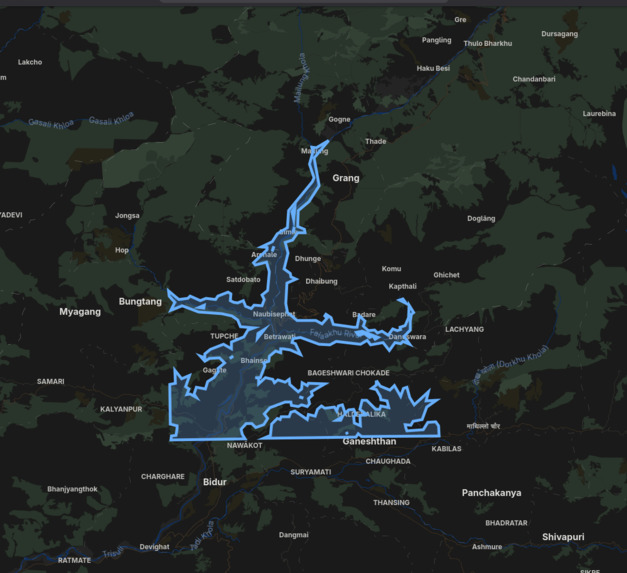
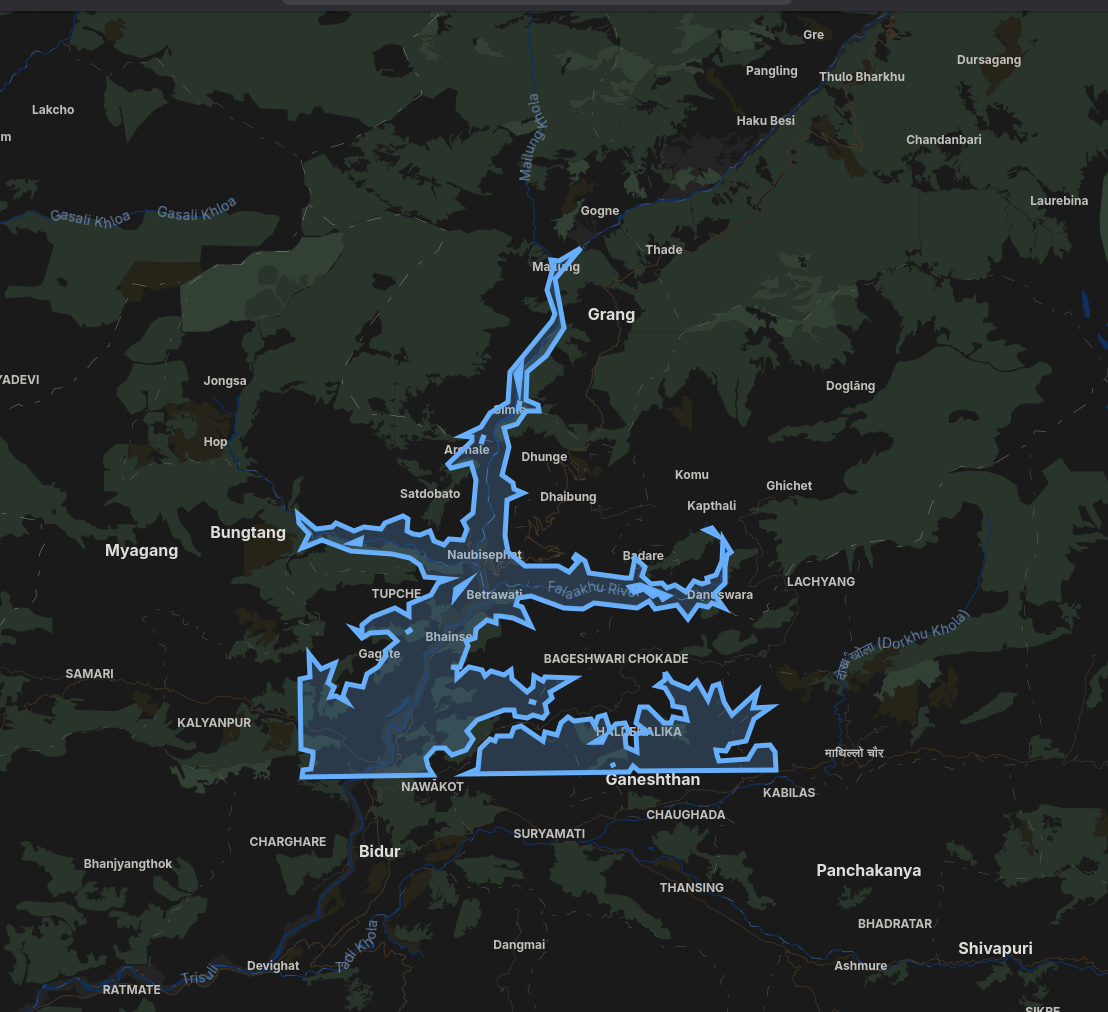
fused-hazard GEOJSON
-
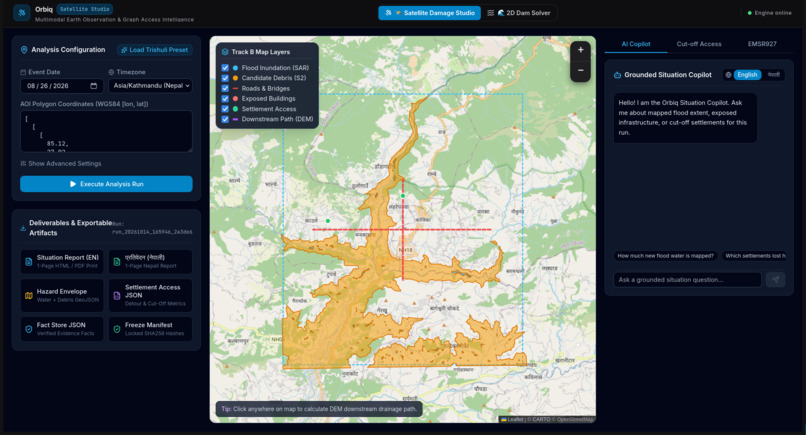
Dashboard
-
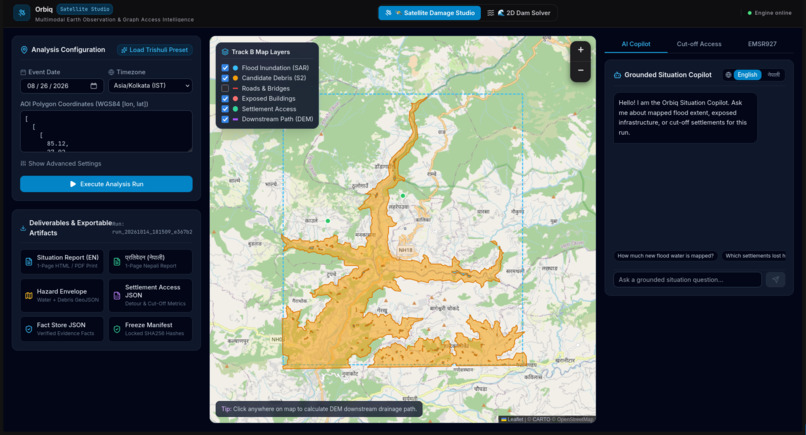
Dashboard
-
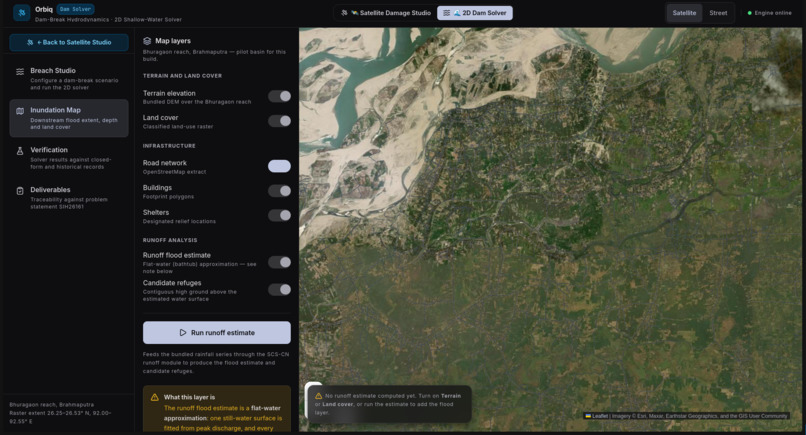
SWE Solver
-
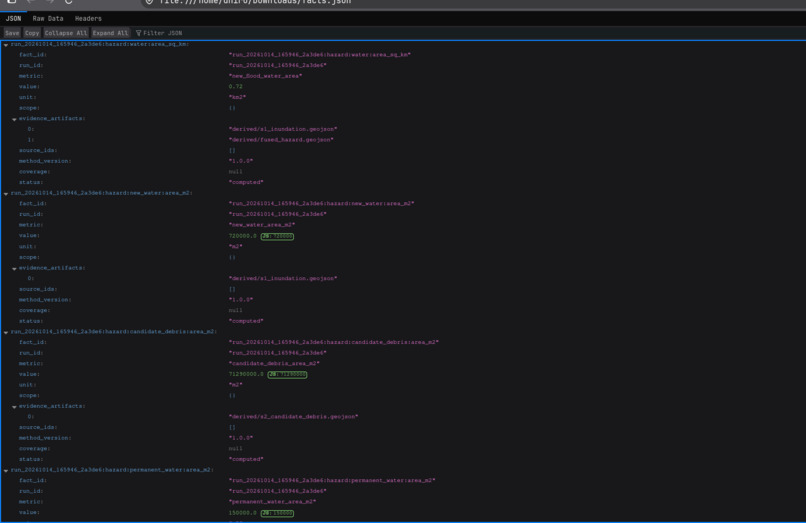
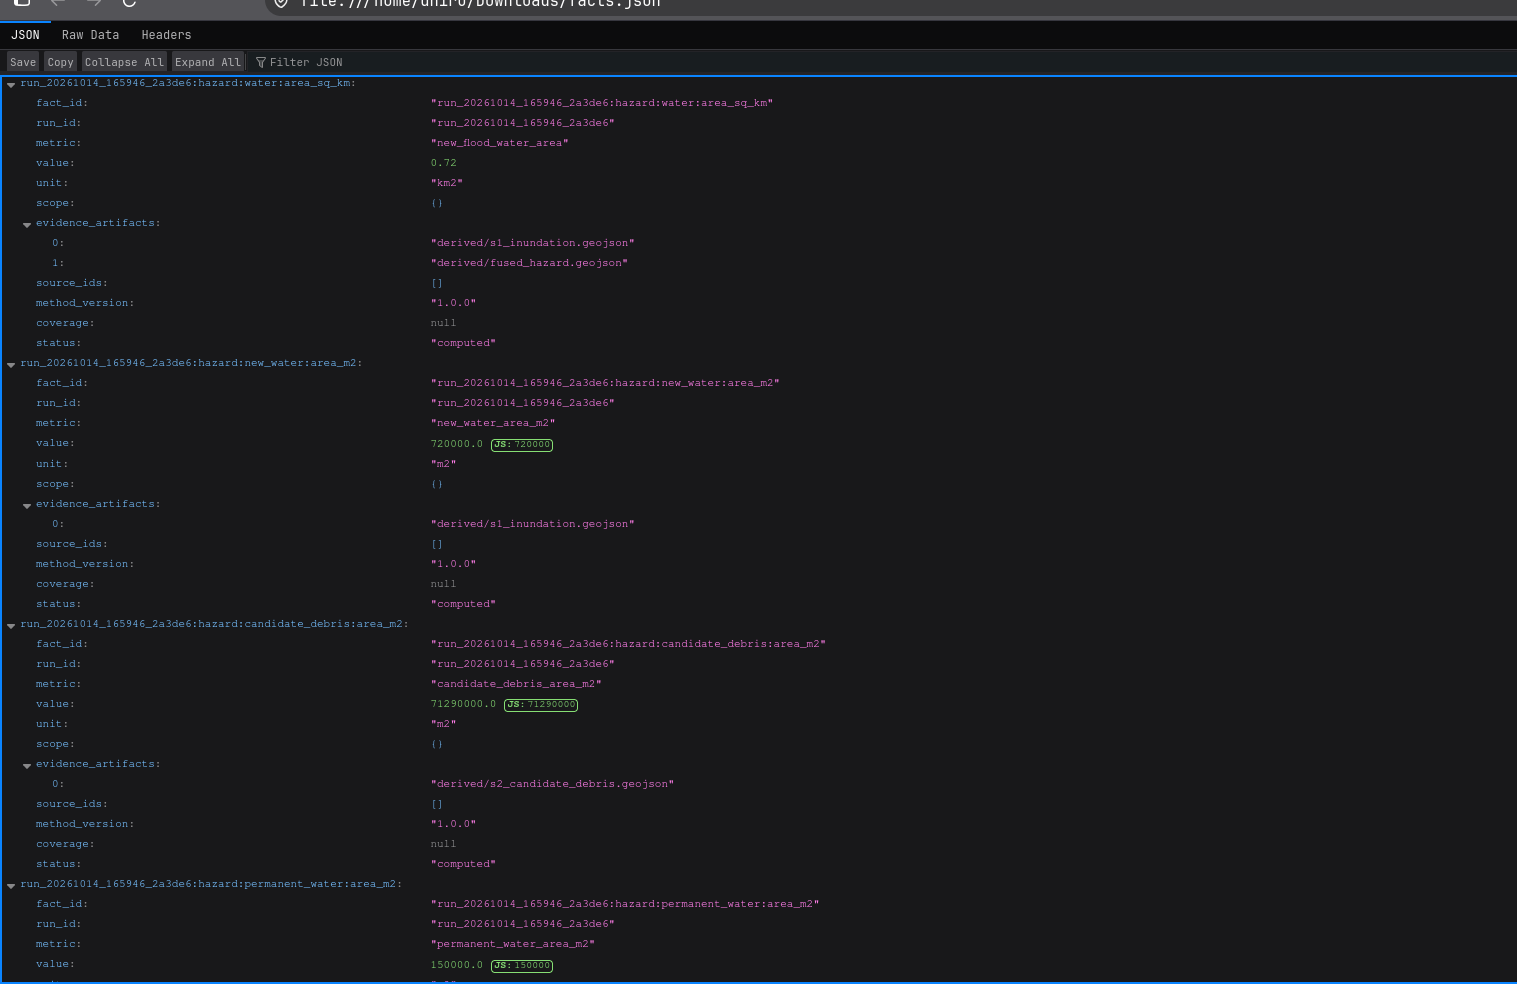
facts JSON
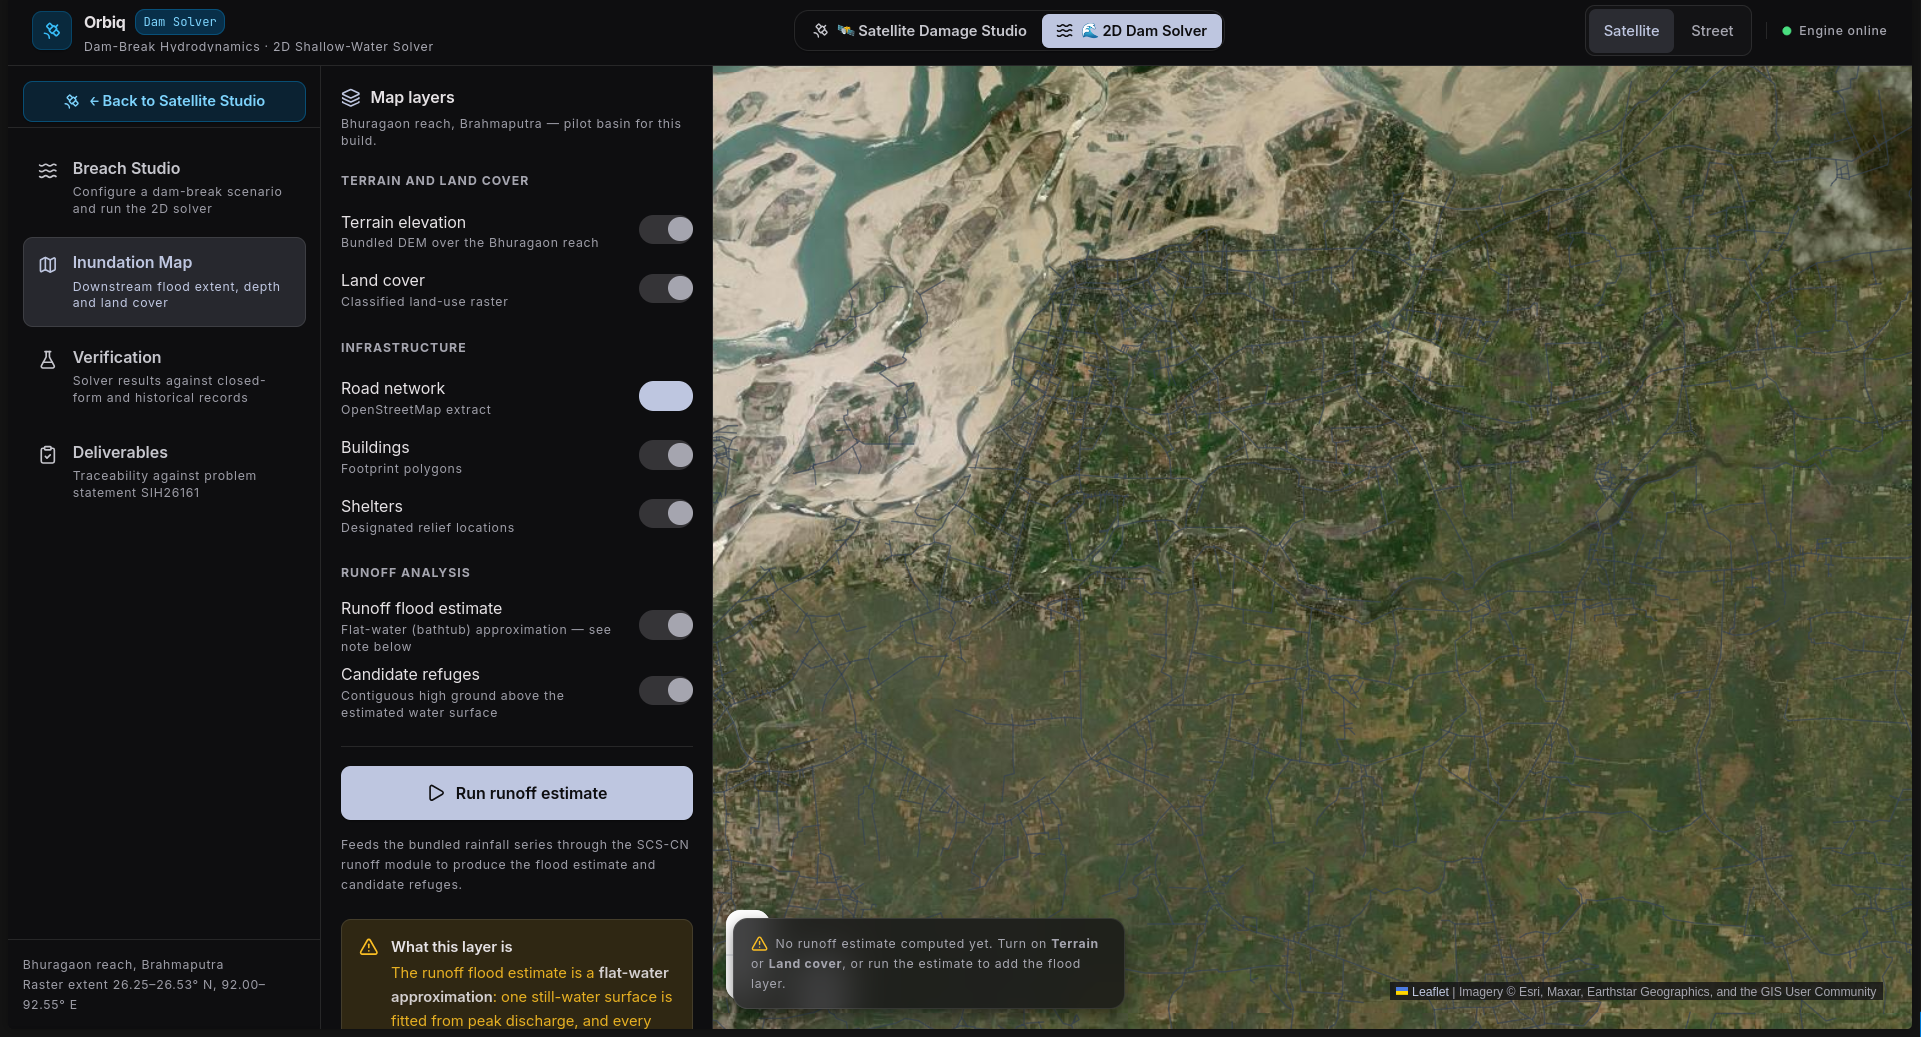
Inspiration
On 26 August 2026 a glacier collapsed in northern Nepal and sent ice, rock, water and mud down the Bhote Koshi–Trishuli corridor. Many families lost people and homes. In a disaster like this the roads, bridges and phone lines go first, and the people trying to help have to work out where the damage is and which villages can no longer be reached.
Satellites cover every valley of the Himalaya, and radar can see through monsoon cloud. We wanted to see how far free satellite data can go in answering three plain questions for rescuers: where did the flood hit, what was in its way, and who is cut off.
We know this is a recent tragedy that is still very real for the people affected. Orbiq is an educational prototype, not an operational tool, and we have tried to build it with that in mind.
What it does
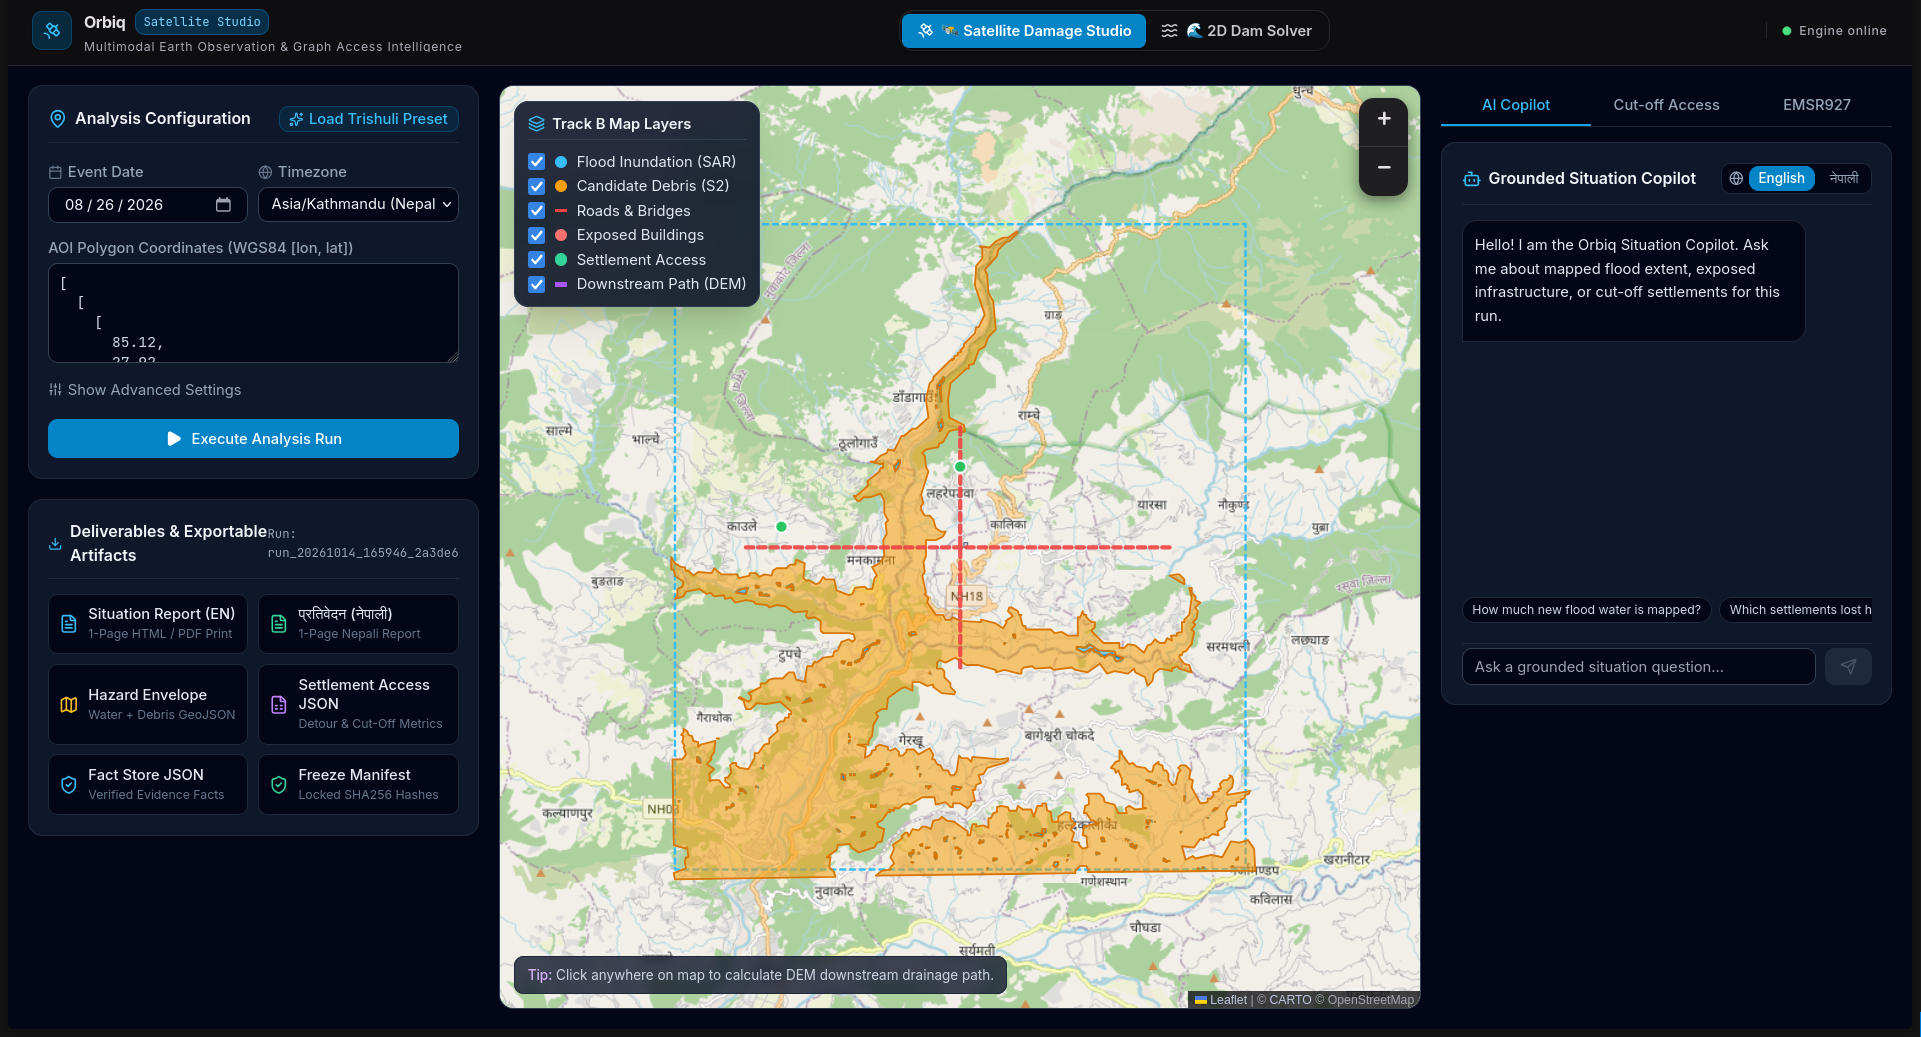
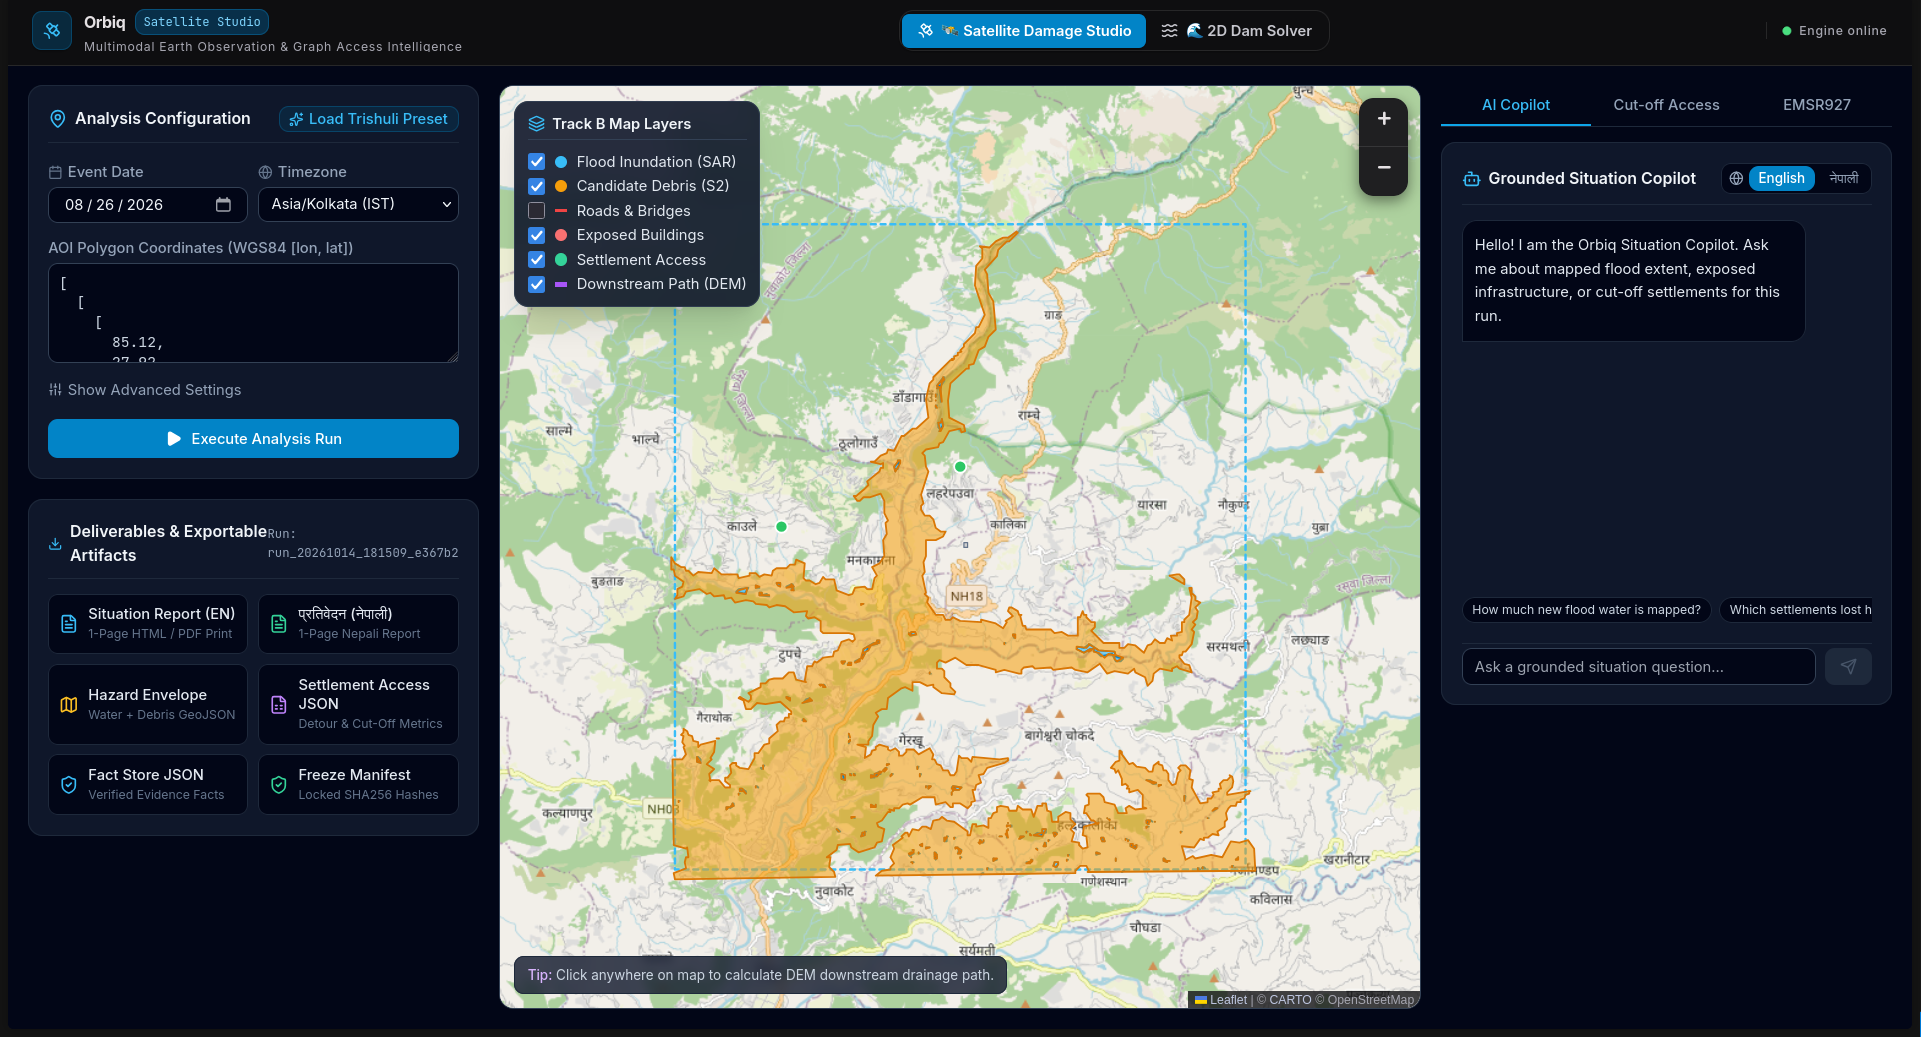
You give Orbiq an area and a flood date. It is meant to:
- compare Sentinel-1 radar images from before and after the event (same orbit track, 12 days apart) and use Sentinel-2 optical images when the sky is clear, to map flooded and debris-covered ground
- overlay buildings, roads and bridges from OpenStreetMap, taken from a snapshot before the event, and estimate which ones the flood may have reached
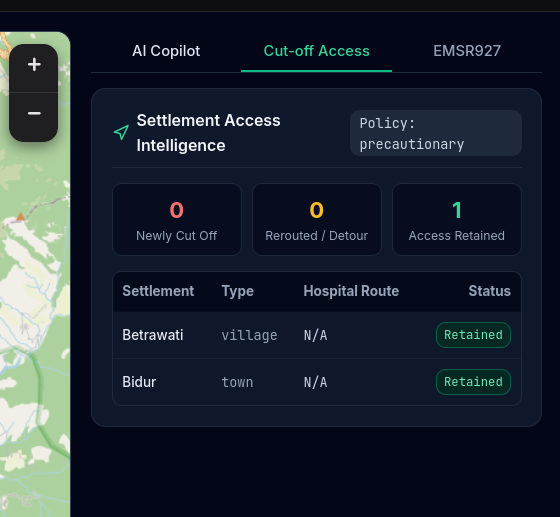
- use the road network to find settlements that may have lost their road connection to the nearest town or hospital
- answer questions and write short situation reports in English and Nepali through a copilot, where every number comes from the system's own maps and not from the language model
One thing we want to be clear about: a flood overlapping a road does not prove the road is destroyed, and it does not prove a village is unreachable. Orbiq shows where there may be a problem. People on the ground have to confirm it.
Nothing is hardcoded to one place. The goal is that any area and date can be run from raw satellite data.
How we built it
Orbiq is built on top of FloodShield, a flood modelling project we already had. That gave us a starting point for Sentinel-1 flood detection, Copernicus DEM terrain, OpenStreetMap roads and buildings with routing, and a dashboard.
On top of that we are adding:
- same-track Sentinel-1 pairing and Sentinel-2 optical support
- a historical OpenStreetMap snapshot through the ohsome API, so edits made after the event never leak into the results
- the flood and road/building overlay
- cut-off settlement analysis on the road graph, before and after
- the English and Nepali copilot, which reads facts from stored results through fixed tools and checks that the numbers it writes match those results
We kept the data rules from the problem statement in mind from the start. Copernicus EMS and other published damage maps are not used as inputs. They are only for checking our results afterwards.
[fill in: what is actually working and run by submission time, and what is still only planned]
Challenges we ran into
- Radar images from different orbit tracks look at the terrain from different angles, so they can't be compared pixel by pixel. Picking the right pair of scenes matters a lot.
- Steep Himalayan valleys cause radar shadow and layover, which can look like water or hide real flooding.
- OpenStreetMap coverage in remote valleys is uneven, so a missing road or village in the data is not the same as it missing on the ground.
- Keeping a language model honest. The copilot is not allowed to make up numbers, so we spent effort on making it call tools and only repeat what they return.
- [fill in: real problems you hit while building]
Accomplishments that we're proud of
- A pipeline design that keeps pre-event and post-event data separate, so the data rules are followed by design.
- A copilot that is grounded in the system's own results and works in Nepali as well as English.
- [fill in: anything you actually got working, with real numbers if you have them]
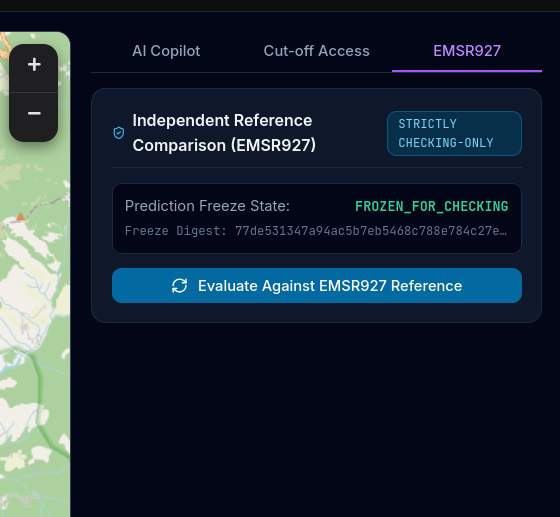
- [fill in: comparison with Copernicus EMS EMSR927, only once you have run it]
What we learned
- Satellite change only shows where the event likely hit. Whether something is actually damaged or cut off needs a second kind of evidence, and the honest answer is often "unknown".
- Good limits matter as much as good maps. Saying clearly what the system cannot do is part of the work.
- [fill in: anything you learned from the build]
Limitations
- Sentinel satellites pass over an area only every few days, so Orbiq cannot warn of a sudden event like a glacier collapse minutes ahead. It is for assessment after the event.
- Cloud can block optical images, and radar has its own blind spots in steep terrain.
- Flood overlap with a road, bridge or building is exposure, not confirmed damage.
- Settlement results depend on how complete the OpenStreetMap data was before the event.
- It is not an evacuation or rescue-routing tool.
What's next
- Finish and test the full workflow on new areas and dates
- Compare our results with the EMSR927 reference maps and report the differences honestly
- Add the optional upstream flood-path trace using elevation data
- Possibly train a flood segmentation model as a second AI component, if we get access to a GPU
- [fill in: your own plans]
Built with
Python, FastAPI, Next.js, React, Leaflet, Sentinel-1, Sentinel-2, Copernicus DEM, OpenStreetMap, ohsome API, Google Earth Engine, [fill in: language model used for the copilot]
Code: https://github.com/dhirendra1729/FloodShield [fill in: Orbiq repo link if different]
Data attributions
Contains modified Copernicus Sentinel data 2026.
Produced using Copernicus WorldDEM-30 © DLR e.V. 2010–2014 and © Airbus Defence and Space GmbH 2014–2018 provided under COPERNICUS by the European Union and ESA; all rights reserved.
© OpenStreetMap contributors.
For comparison with the official maps: European Union, Copernicus Emergency Management Service data (EMSR927).
[Only if used for training, keep these:]
- Bountos et al. (2024), Kuro Siwo: 33 billion m² under the water. A global multi-temporal satellite dataset for rapid flood mapping, NeurIPS Datasets and Benchmarks.
- Bonafilia, Tellman, Anderson and Issenberg (2020), Sen1Floods11: a georeferenced dataset to train and test deep learning flood algorithms for Sentinel-1, CVPR Workshops, pp. 210-211.
Built With
- api
- copernicus
- dem
- fastapi
- geopandas
- leaflet.js
- networkx
- next.js
- numpy
- ohsome
- openstreetmap
- osmnx
- postgis
- postgresql
- python
- rasterio
- react
- sentinel-1
- sentinel-2
- typescript

Log in or sign up for Devpost to join the conversation.