-
-
opswarroom - Agentic Incident Investigation
-
opswarroom Dashboard
-
Investigation
-
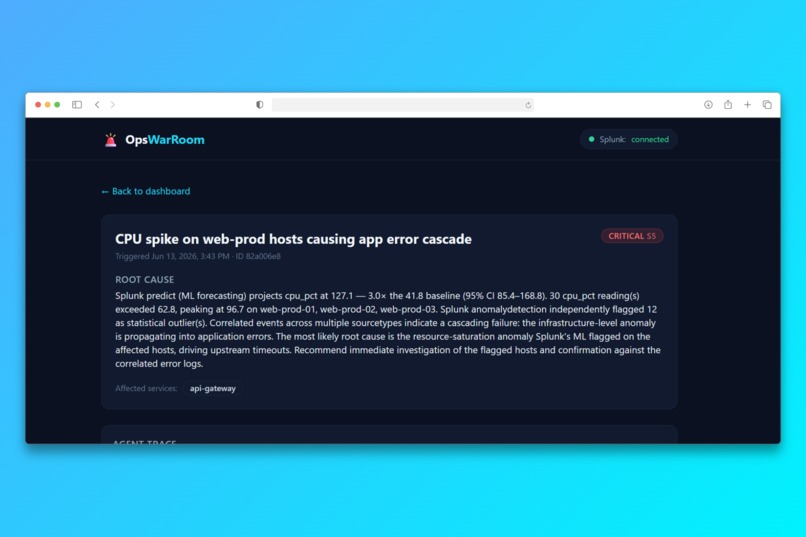
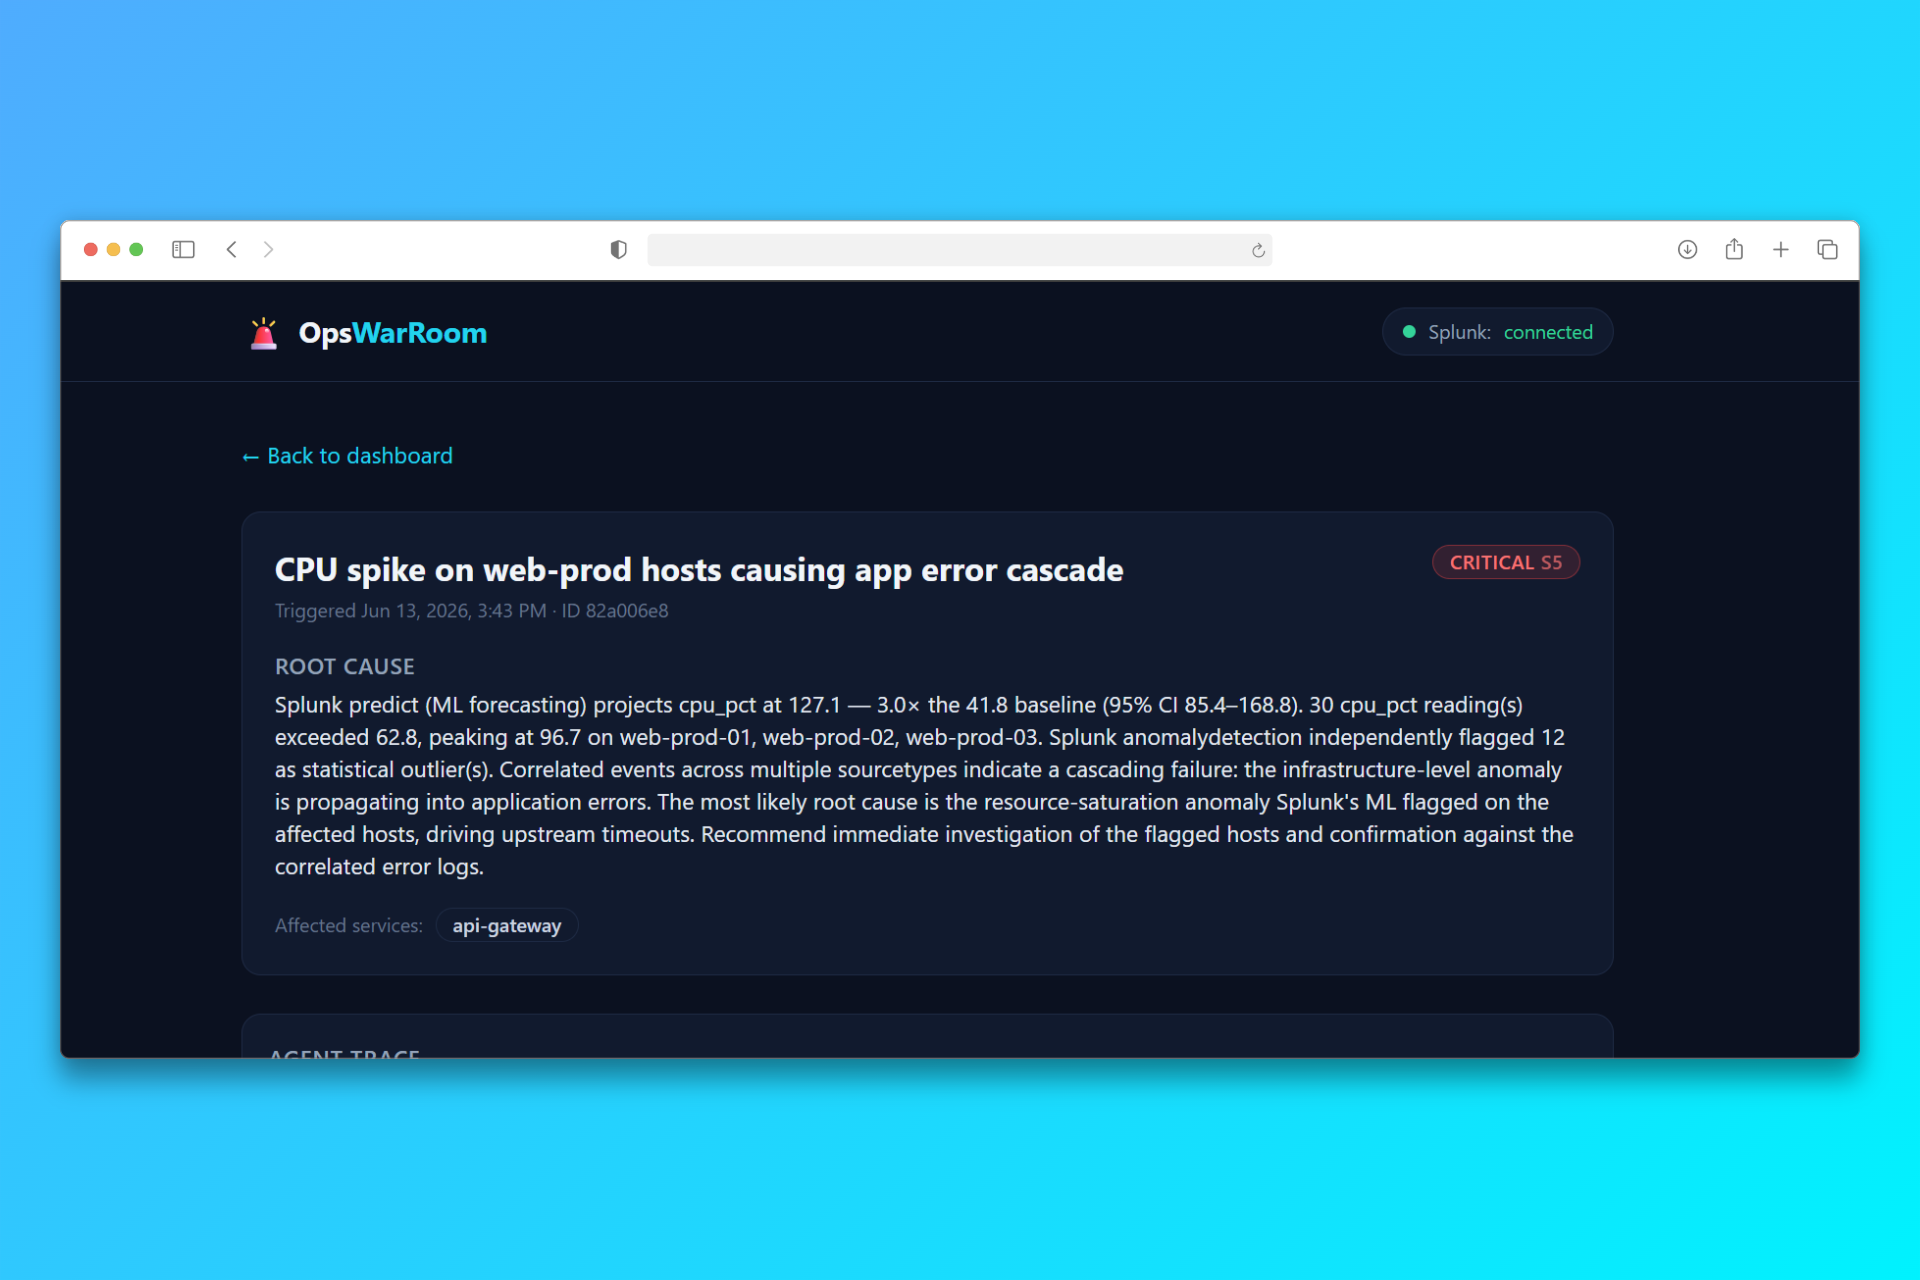
Result Root Case
-
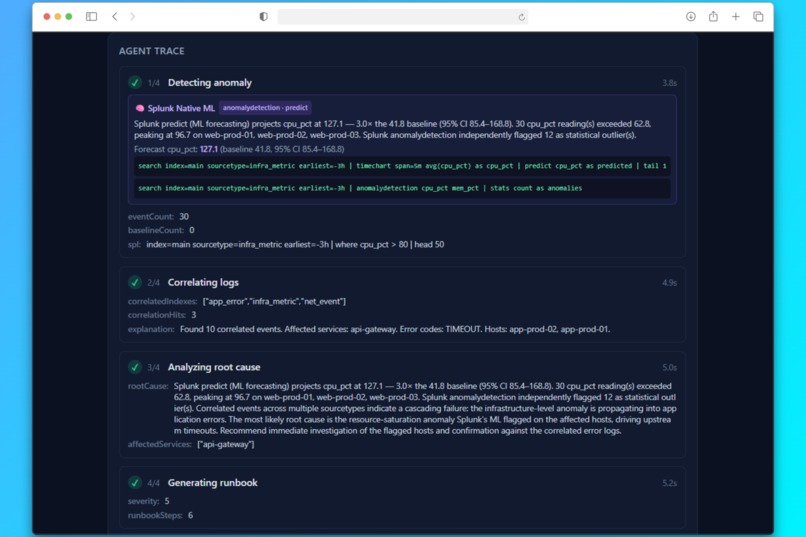
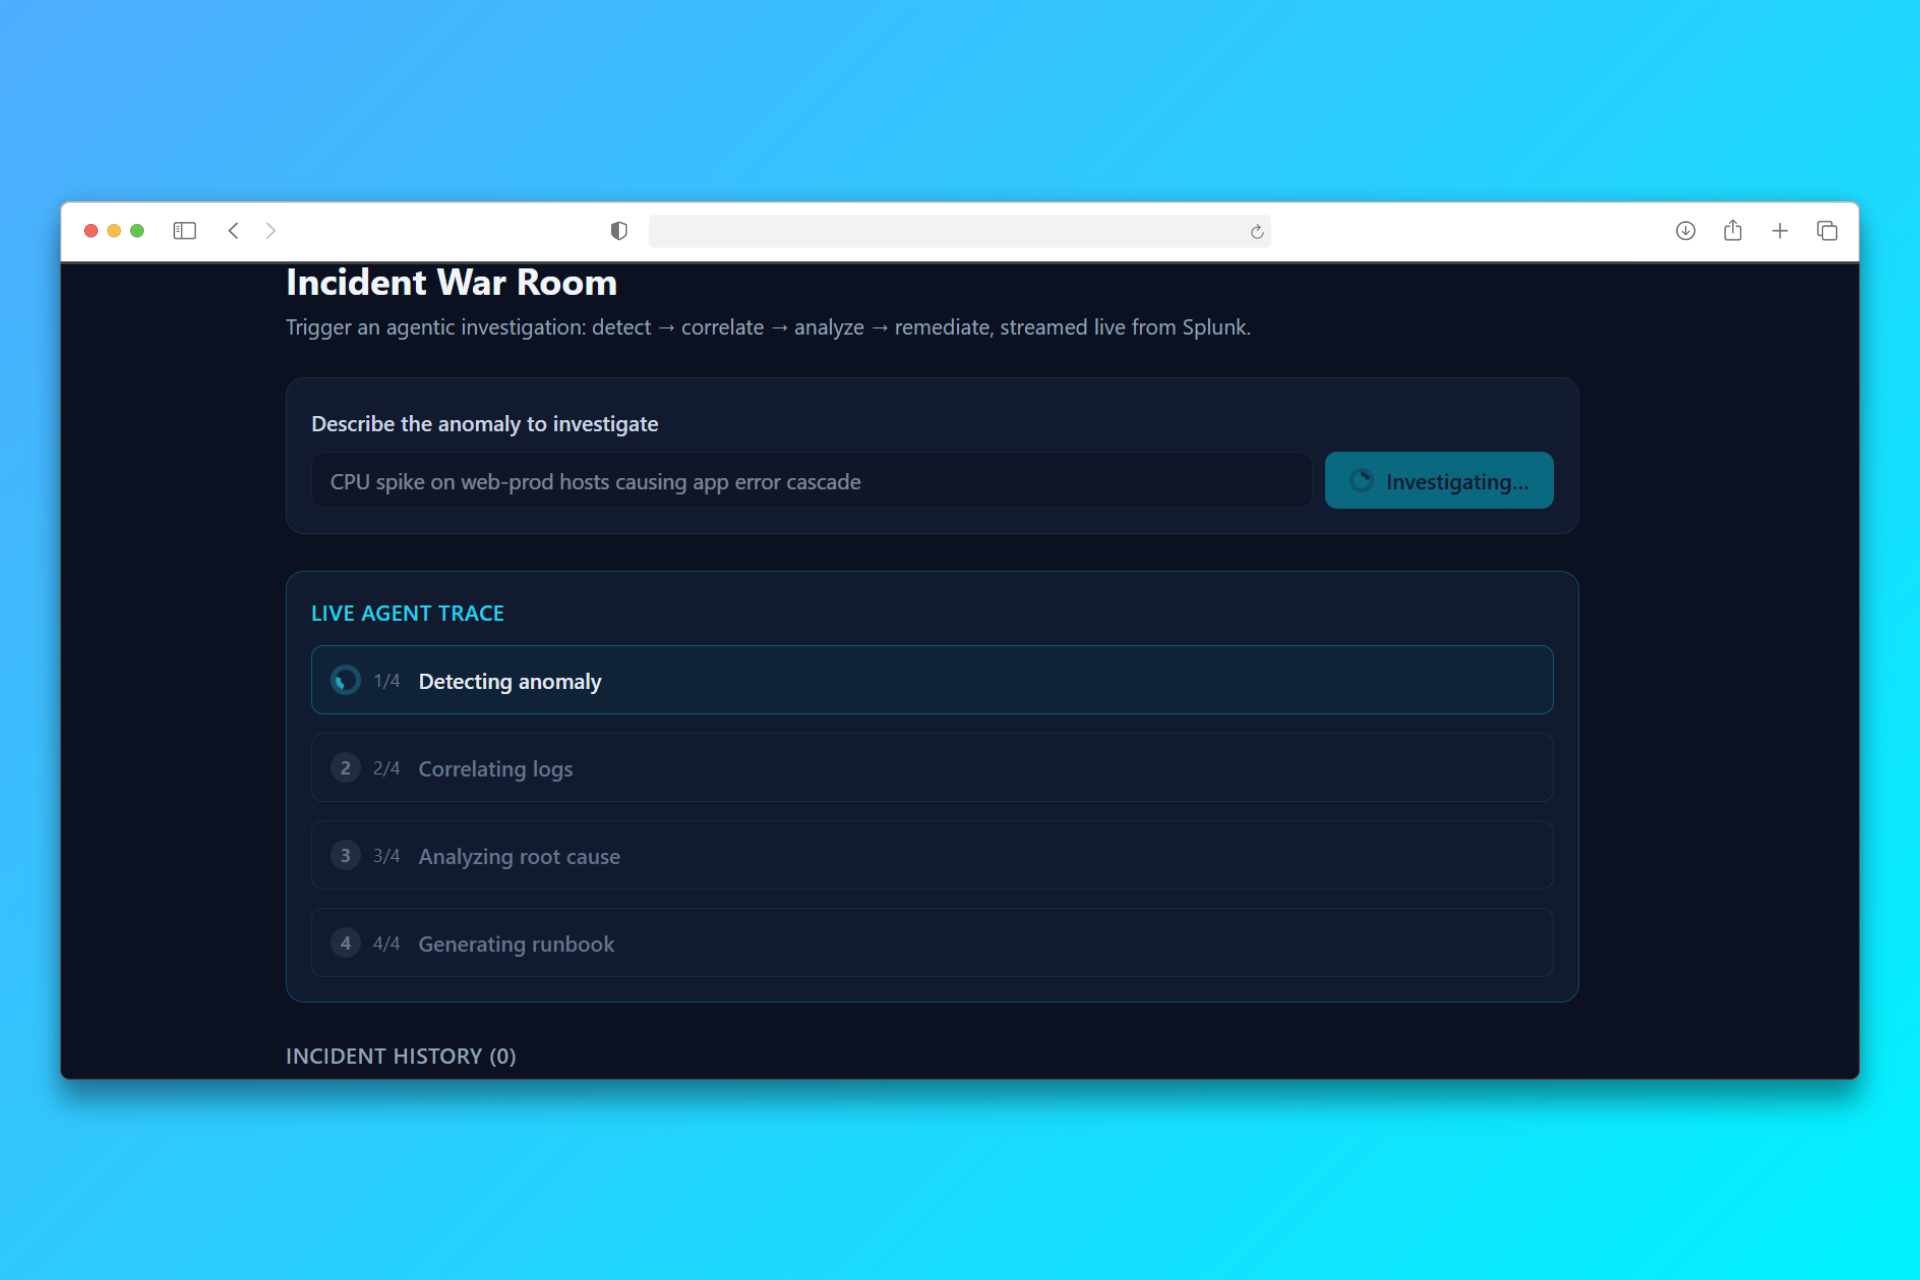
Agent Trace
-
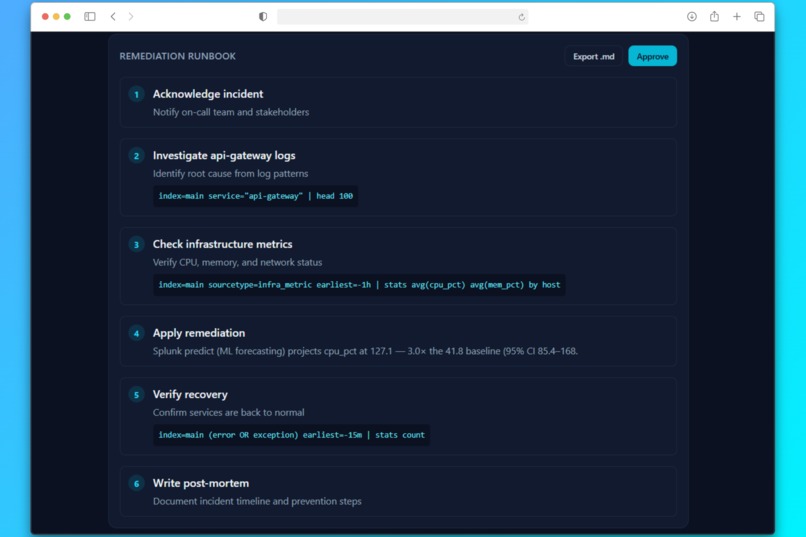
Remeditation Runbook
-
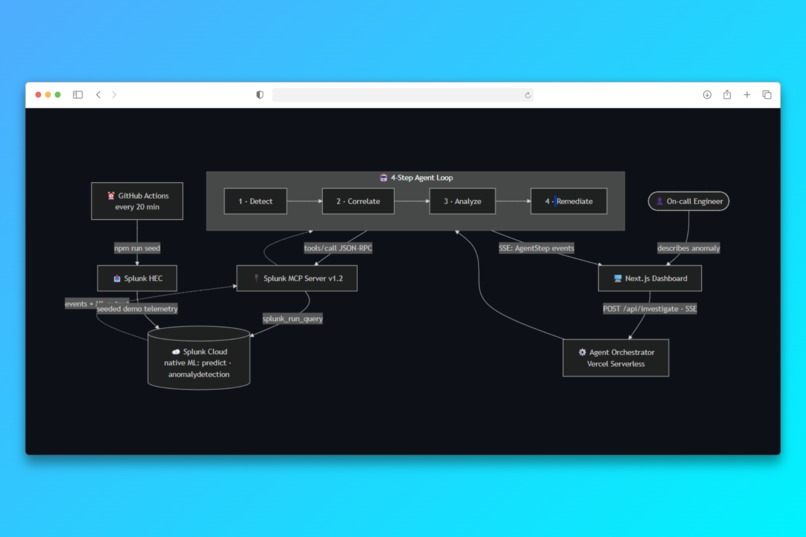
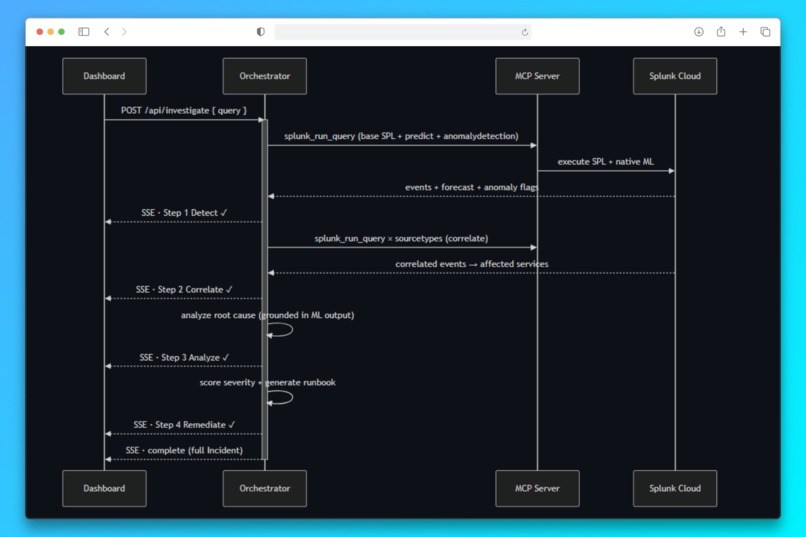
Architecture
-
4 Step Agetn Loop
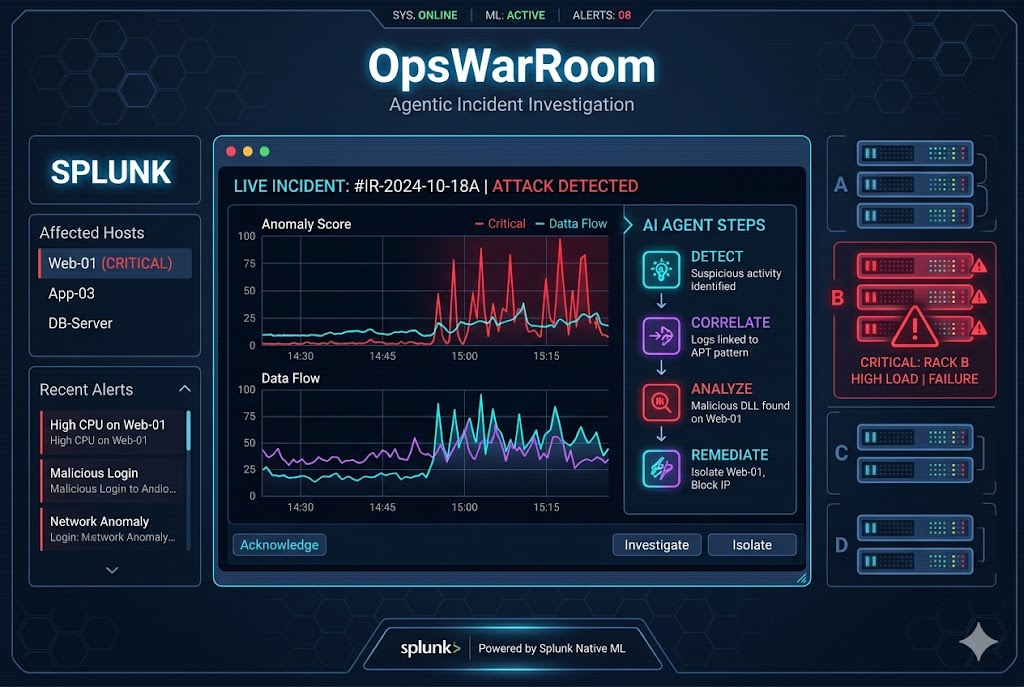
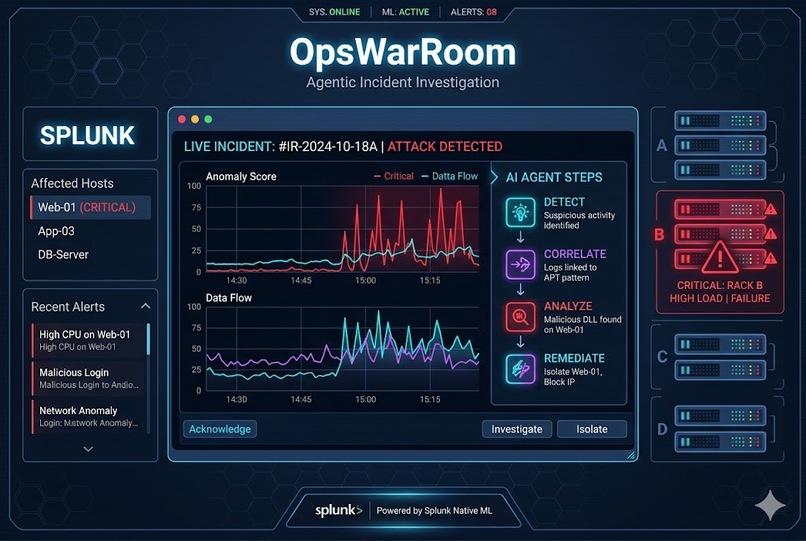
🛰️ OpsWarRoom
Agentic Incident Investigation, powered by Splunk AI
OpsWarRoom turns a one-line alert into a full incident investigation — detect → correlate → analyze → remediate — driven by Splunk's native ML and streamed live to a dashboard.
![]()
Built for the Splunk Agentic Ops Hackathon 2026 · Track: **Observability**
Inspiration
When a production incident fires at 3 AM, an on-call engineer does the same manual dance every time: write SPL to find the anomaly, pivot across metrics/logs/network to map the blast radius, reason about root cause under pressure, then improvise a fix. It's slow and depends on tribal knowledge. We wanted an agent that does this end-to-end using Splunk's own AI/ML, not a bolt-on LLM.
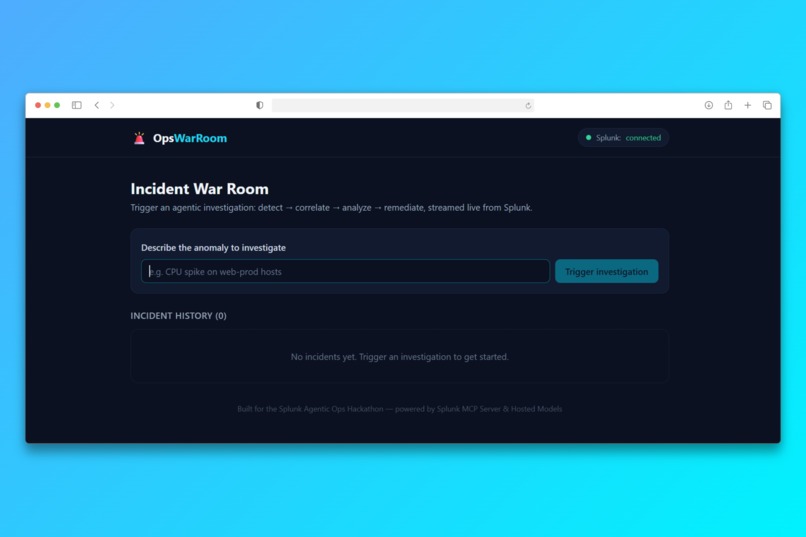
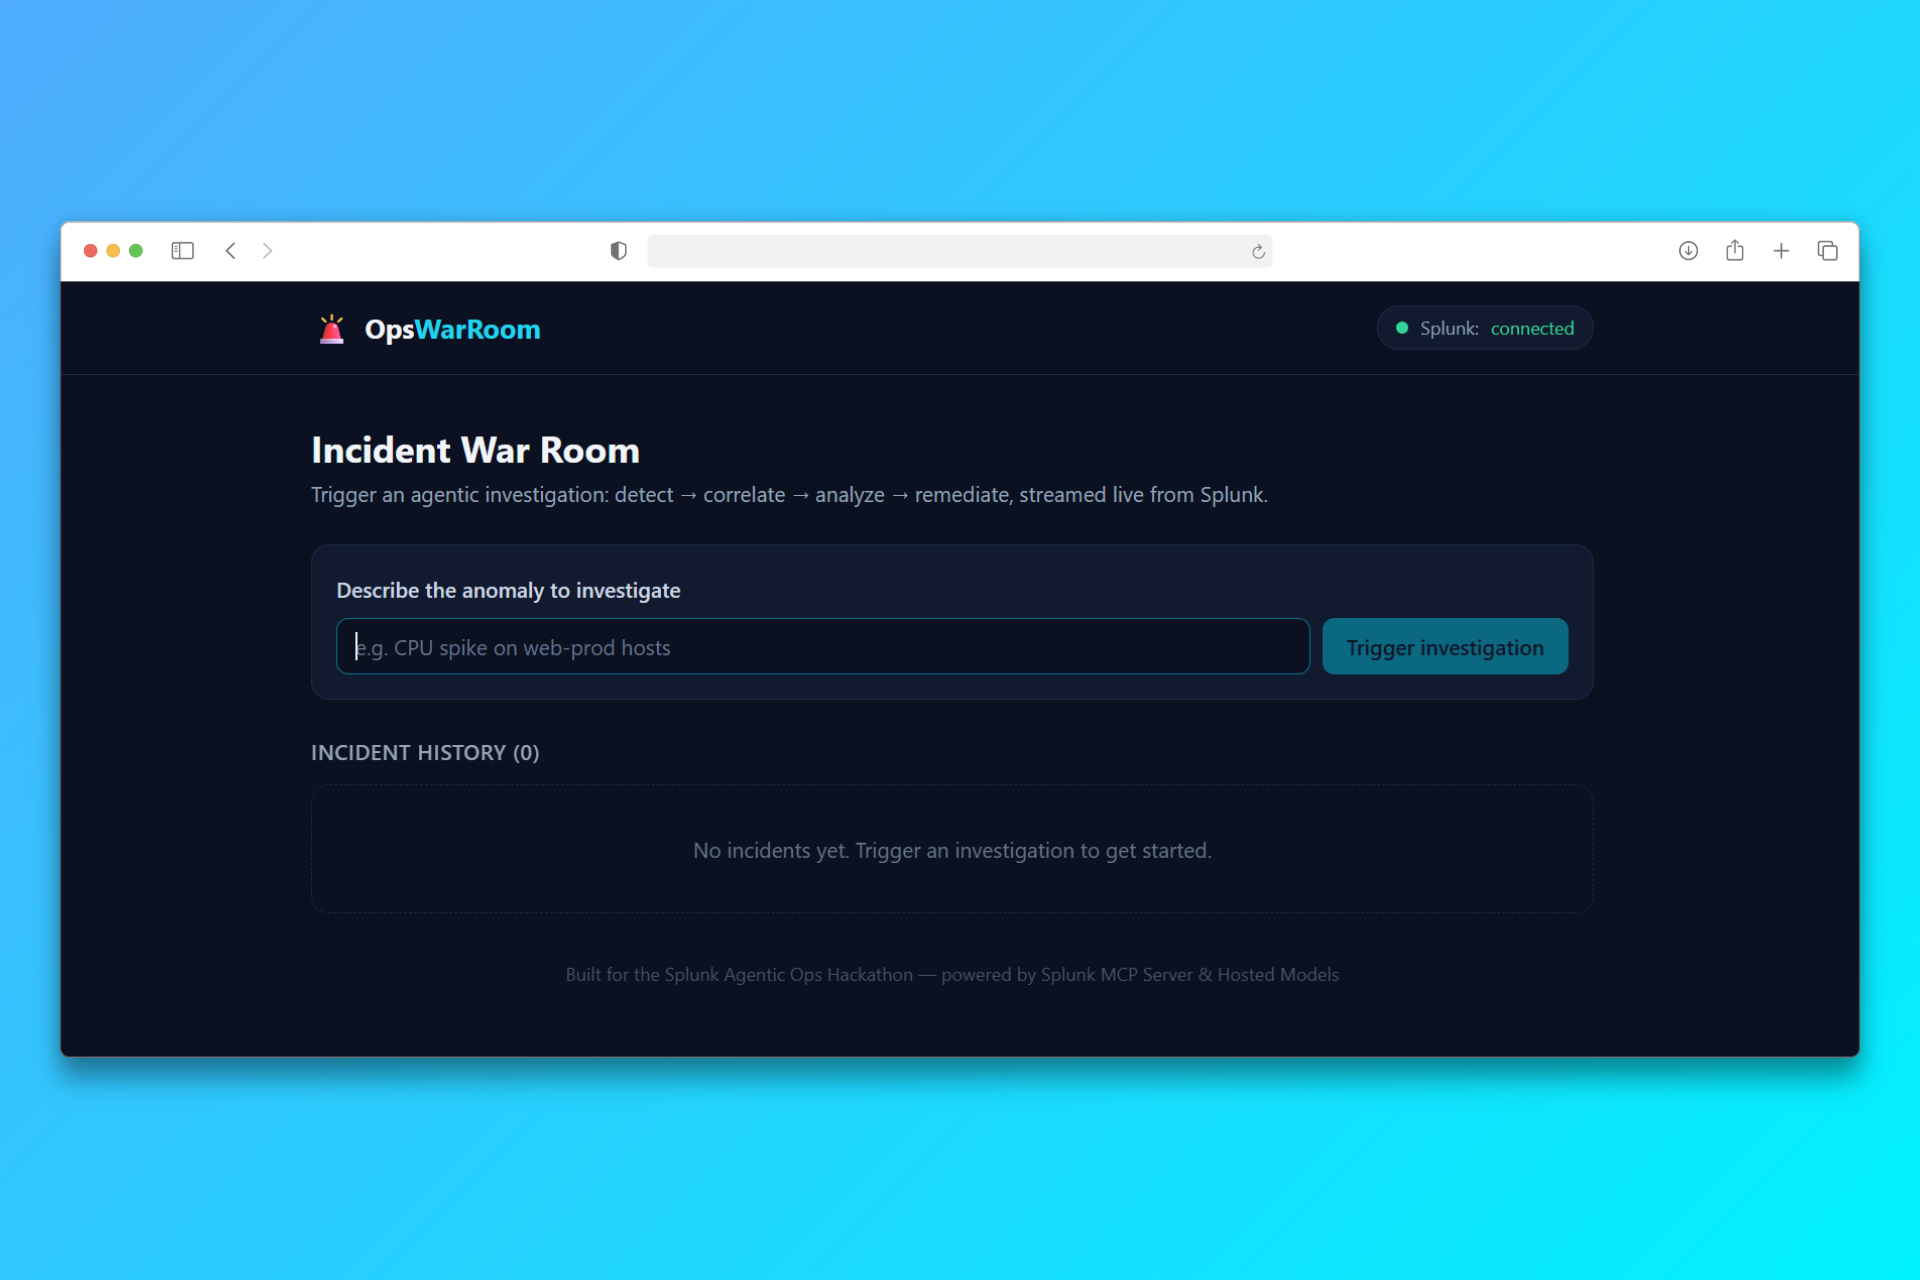
What it does
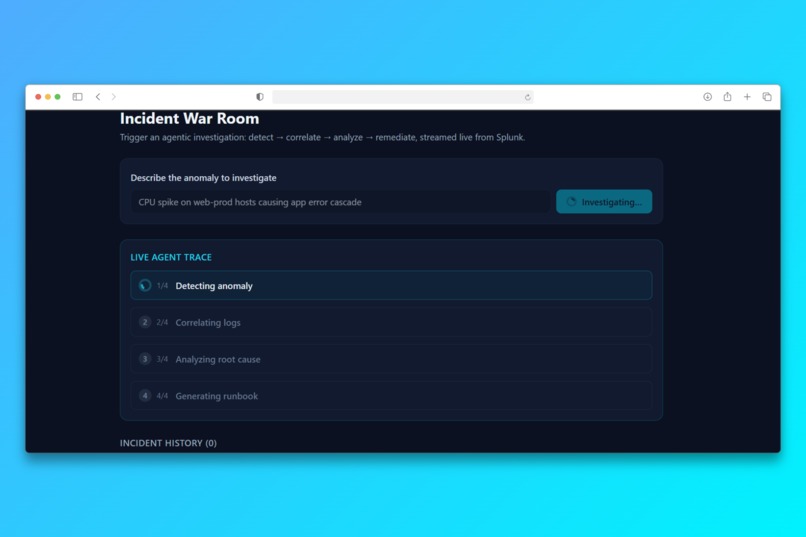
OpsWarRoom turns a one-line alert into a complete incident investigation through a 4-step agent loop, streamed live to a dashboard:
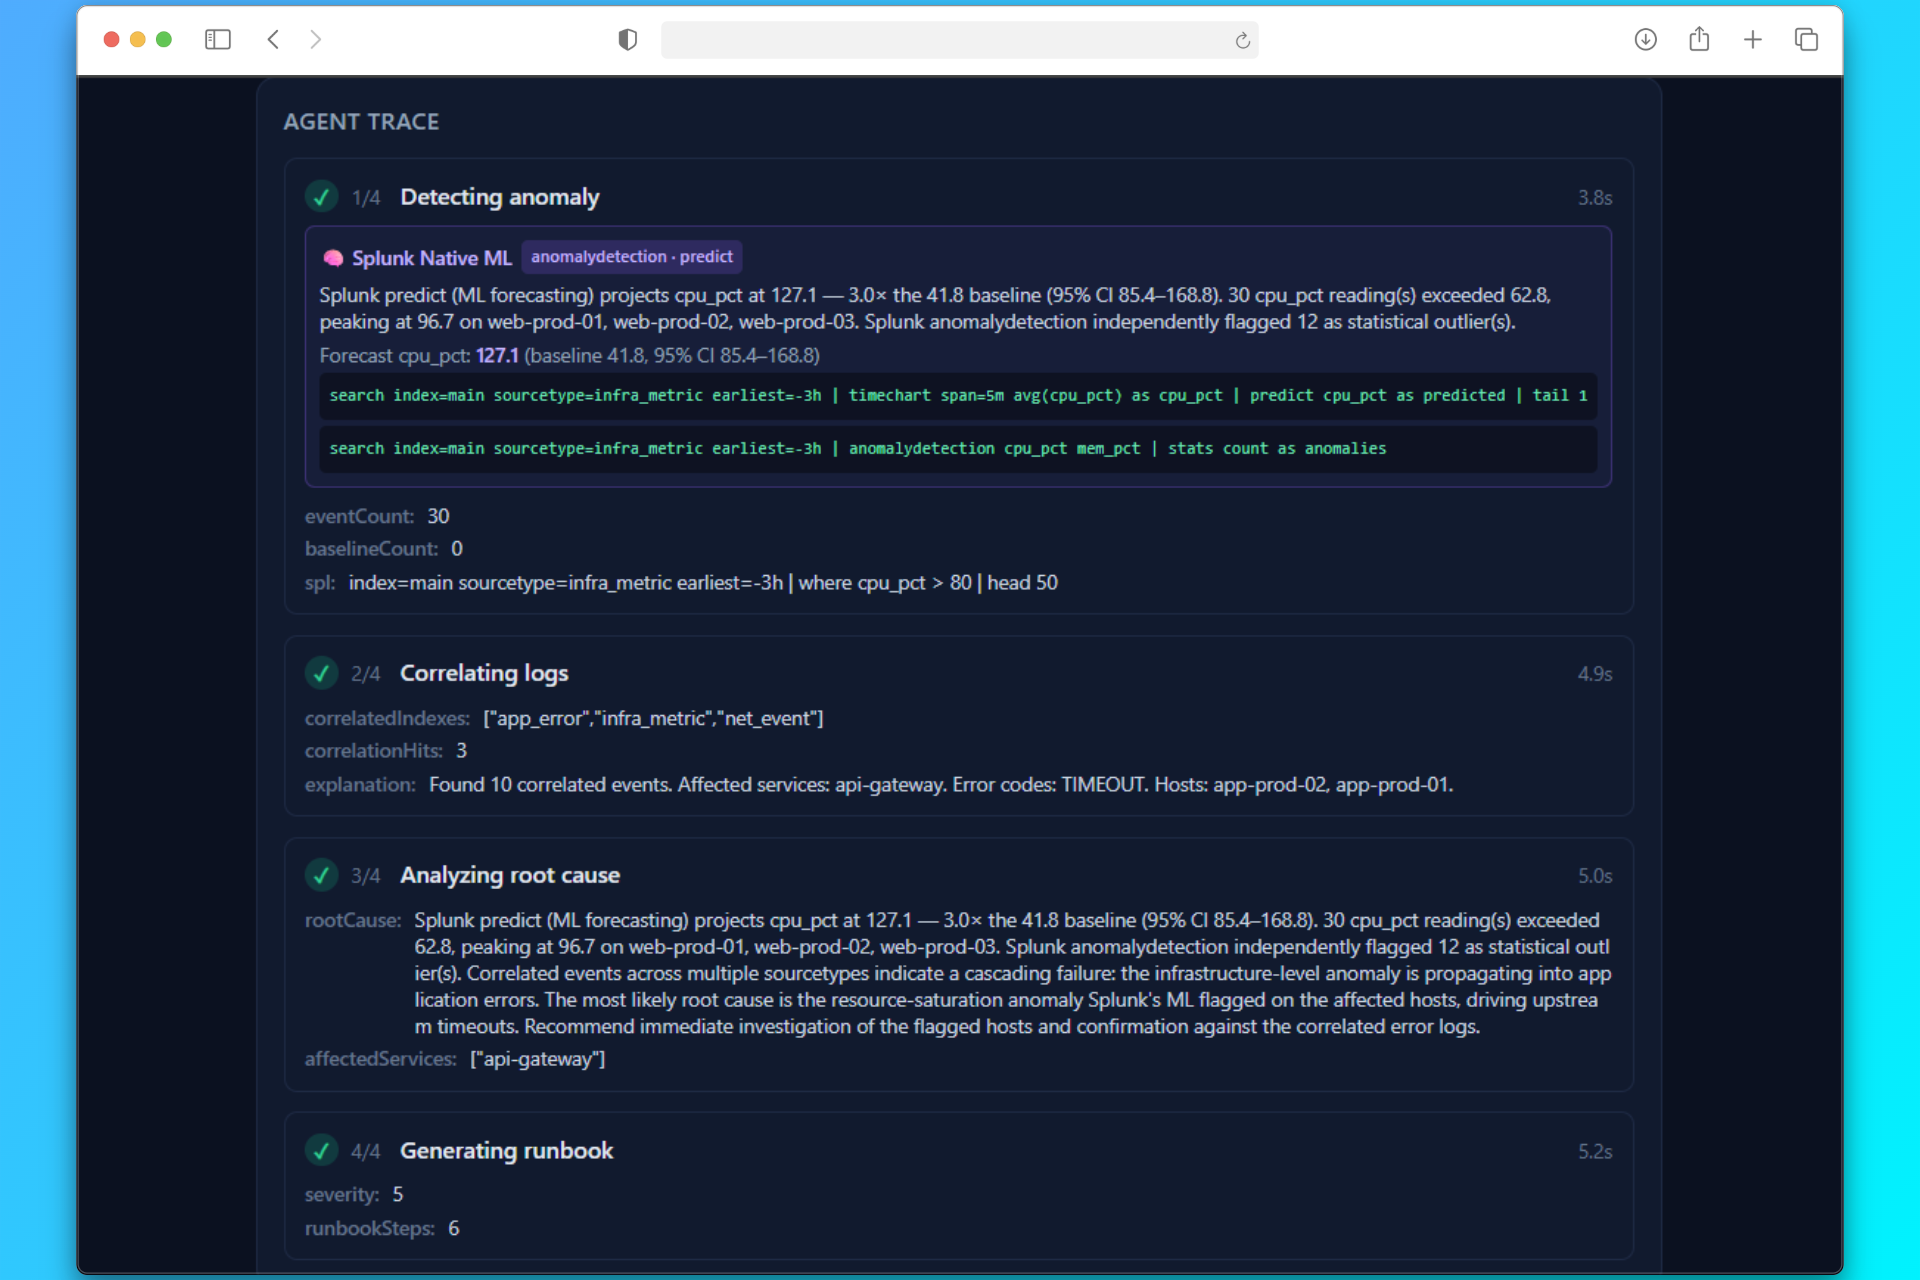
- Detect — runs Splunk's native ML (
predict+anomalydetection) to forecast metric trends and flag elevated readings above a dynamic baseline. - Correlate — joins metrics, application errors, and network events across a 3-hour window to map the blast radius.
- Analyze — produces a root cause narrative grounded in the ML output (forecast, peak value, affected hosts).
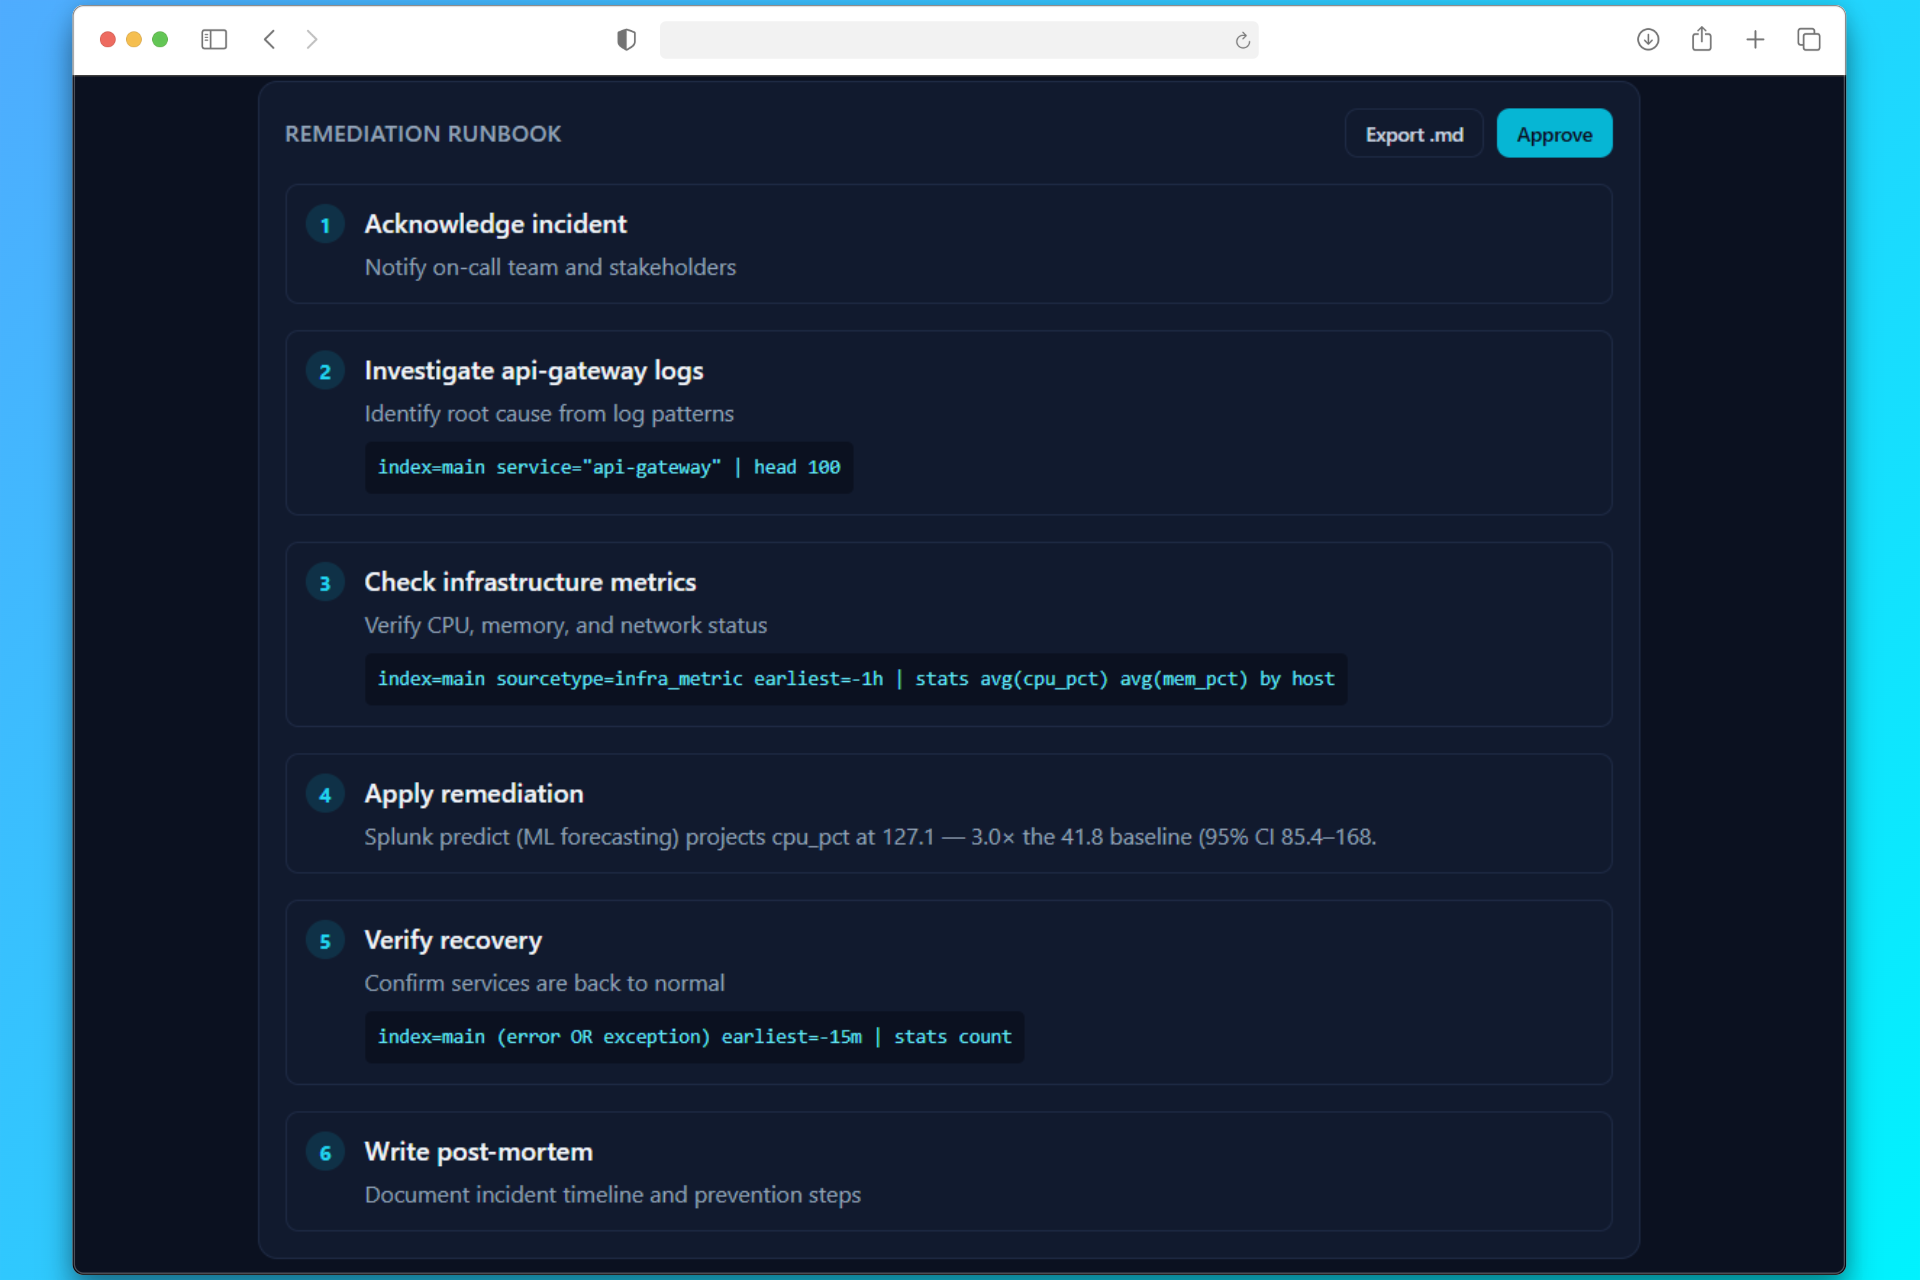
- Remediate — scores severity (S1–S5) and generates an actionable runbook with ready-to-run SPL, gated by human approval.
Every agent step streams in real time via Server-Sent Events. The live "Splunk Native ML" panel shows the exact SPL commands (predict, anomalydetection) that ran inside Splunk Cloud.
How we built it
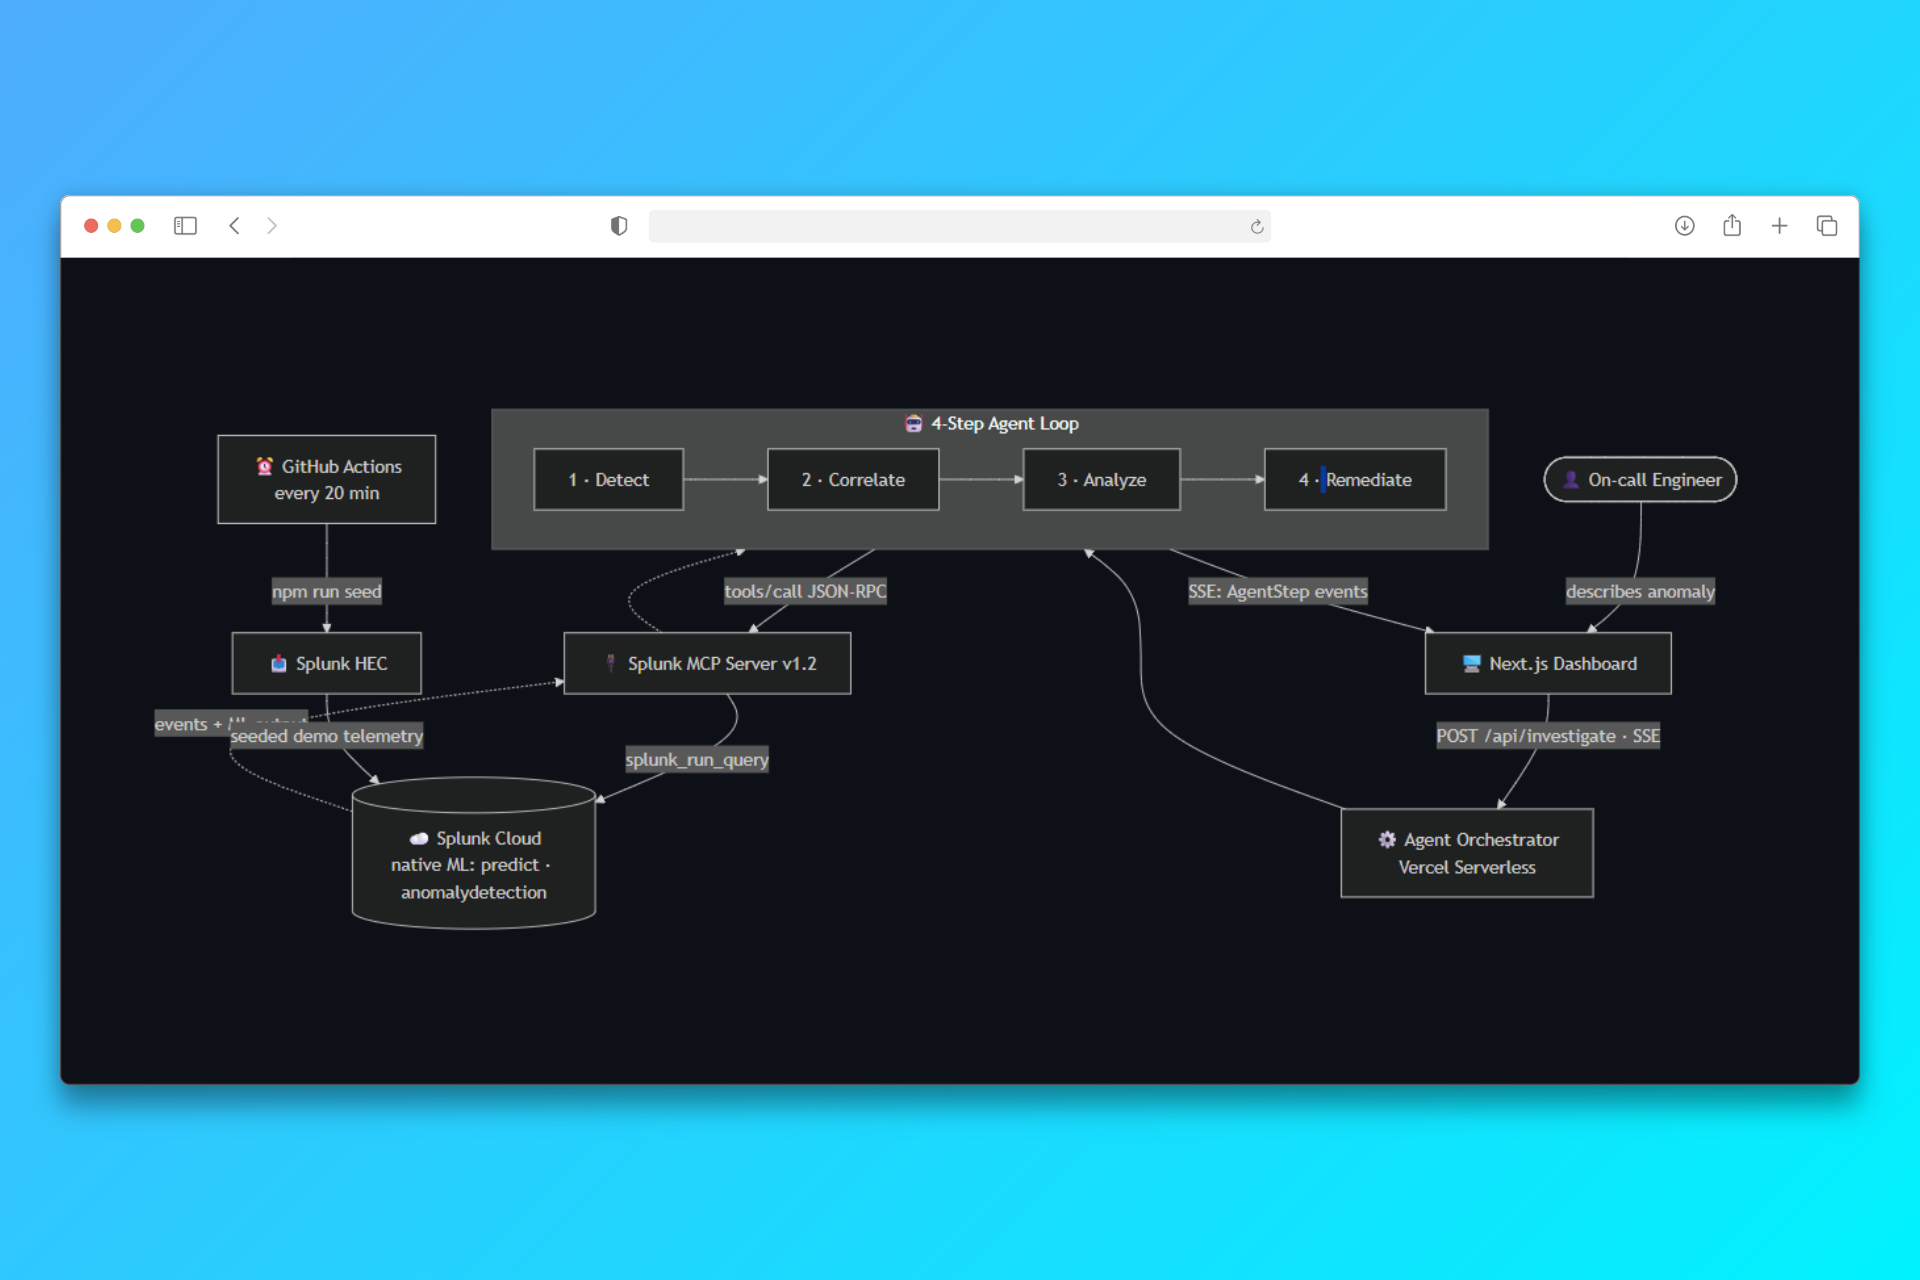
- Frontend: Next.js 15 + React 19 dashboard deployed on Vercel
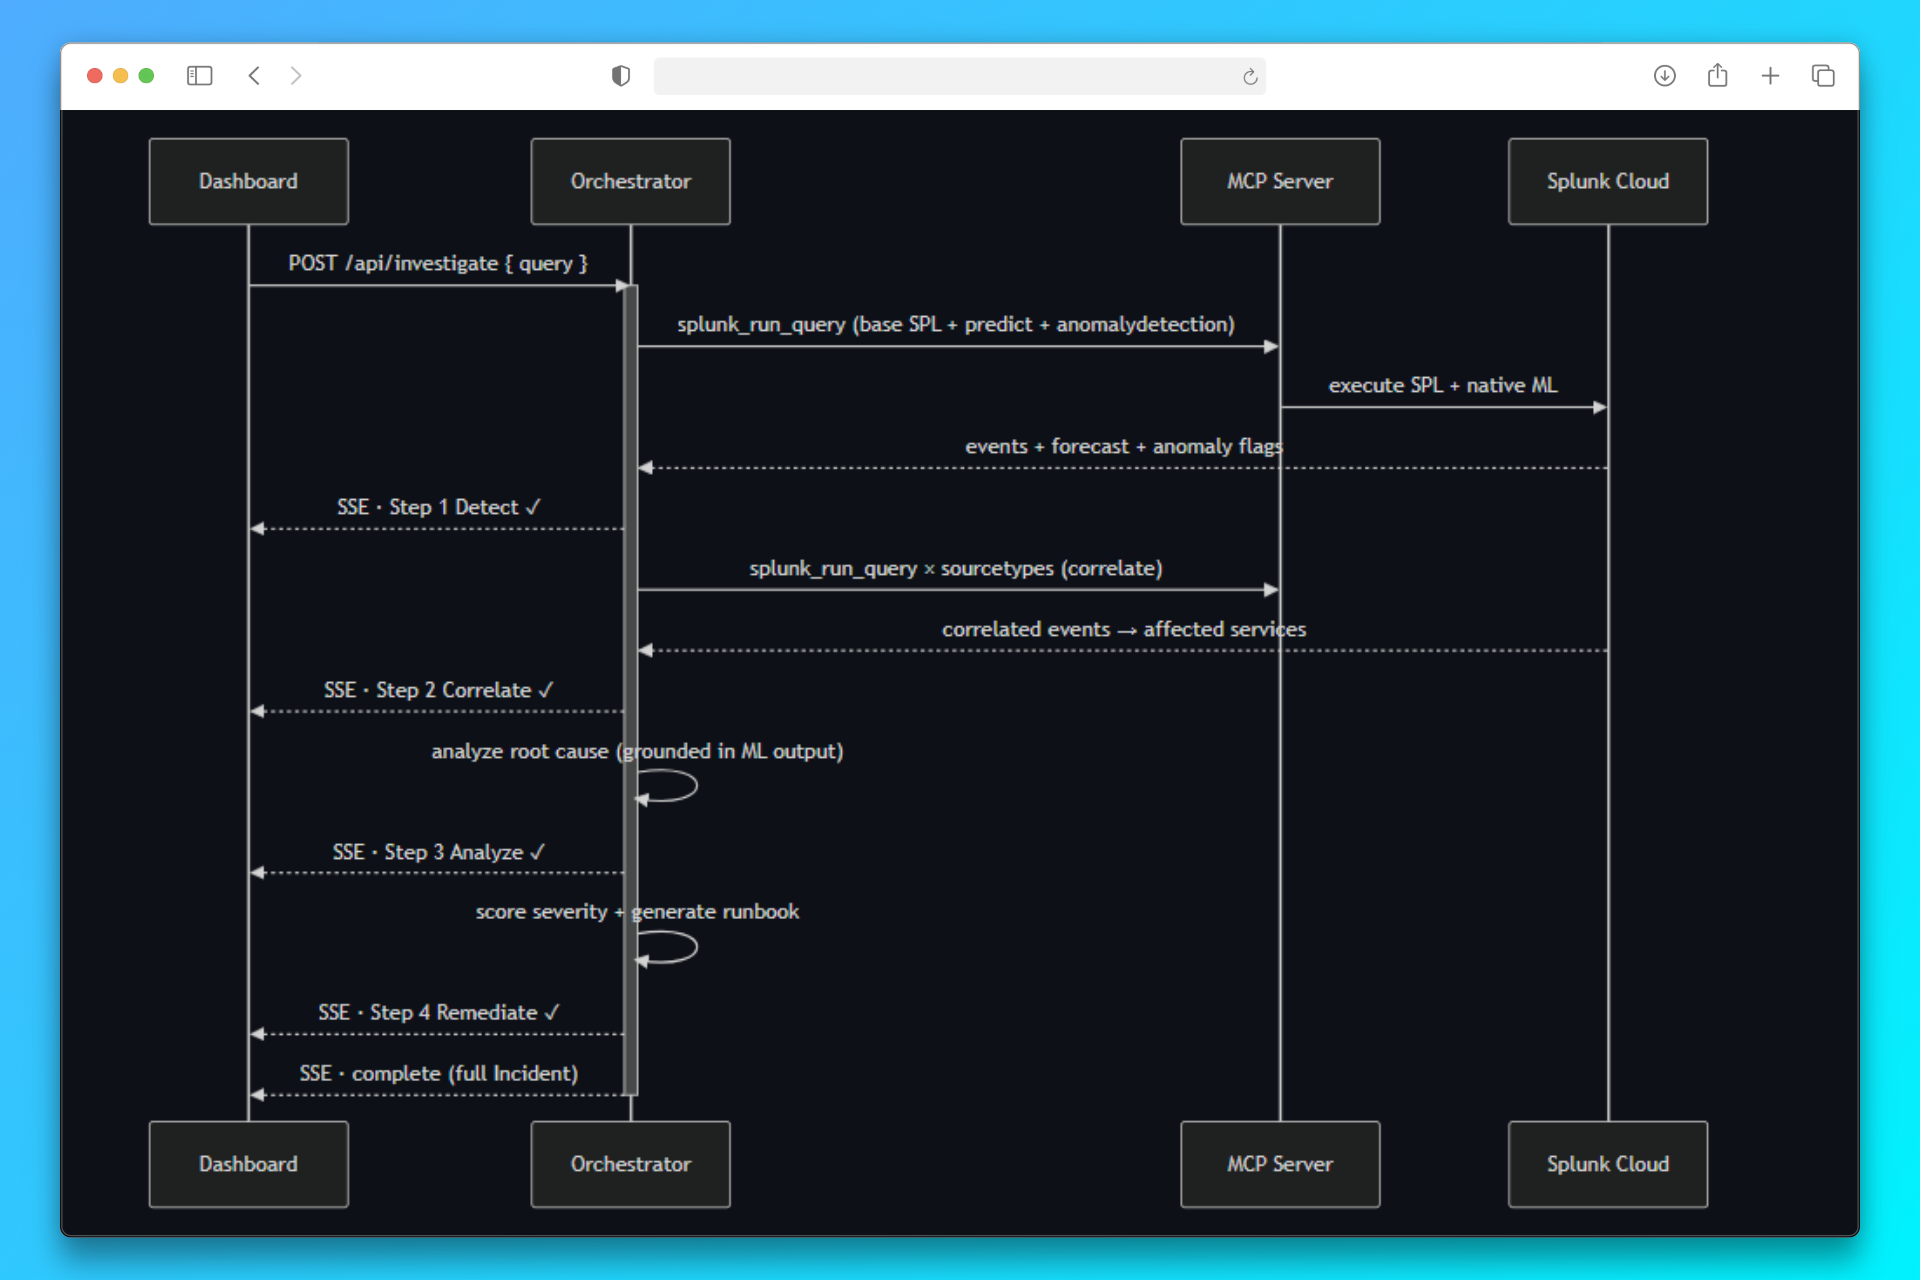
- Agent loop: API route streams
AgentStepevents over SSE; each step calls the Splunk MCP Server via direct HTTP JSON-RPC (tools/call) - Splunk AI at runtime:
splunk_run_queryexecutespredict(time-series forecasting with 95% CI) andanomalydetection(rare-event outlier model) inside Splunk Cloud - Demo data: Synthetic telemetry (infra metrics, app errors, network events) injected via HEC, kept fresh by a scheduled GitHub Actions job every 20 minutes
- Persistence: Incidents stored in browser localStorage so detail pages survive Vercel serverless cold starts
Challenges we ran into
The Splunk AI Assistant (saia_* tools) and hosted GPT models aren't provisioned on the trial tier, they return "Service not initialized" or redirect to a login page. Rather than fake it or use a generic LLM, we pivoted the runtime AI to Splunk's native SPL ML commands (predict, anomalydetection), which genuinely run at query time through the MCP Server. We also solved: serverless statelessness (browser-side incident store), demo-data freshness (scheduled re-seeding via GitHub Actions), and a subtle predict edge case where the last row of a timechart can lack a prediction value, fixed by filtering to rows where predicted > 0 and picking the latest valid one.
Accomplishments that we're proud of
Real Splunk ML executing at runtime through the MCP Server, verifiable live in the "🧠 Splunk Native ML" panel, with a fully streamed agentic loop, dynamic severity scoring, and human-in-the-loop runbook approval, all deployed and publicly accessible.
What we learned
How to drive the Splunk MCP Server directly over HTTP JSON-RPC, how Splunk's predict and anomalydetection behave on streaming time-series data, and how to design honest graceful degradation when a managed AI backend isn't available on a trial tier.
What's next for OpsWarRoom - Agentic Incident Investigation
- Query-driven detection: route analysis by signal type (infrastructure vs. application vs. network) based on the user's query
- Persistent storage: replace localStorage with Vercel KV or Postgres for shared team incident history
- Splunk SOAR integration: actually execute approved runbook steps, not just display them
- Multi-index correlation: join across multiple Splunk indexes for richer blast-radius mapping
Built With
- next.js
- node.js
- react
- server-sent-events
- splunk
- splunk-mcp-server
- tailwindcss
- typescript
- vercel

Log in or sign up for Devpost to join the conversation.