-
-
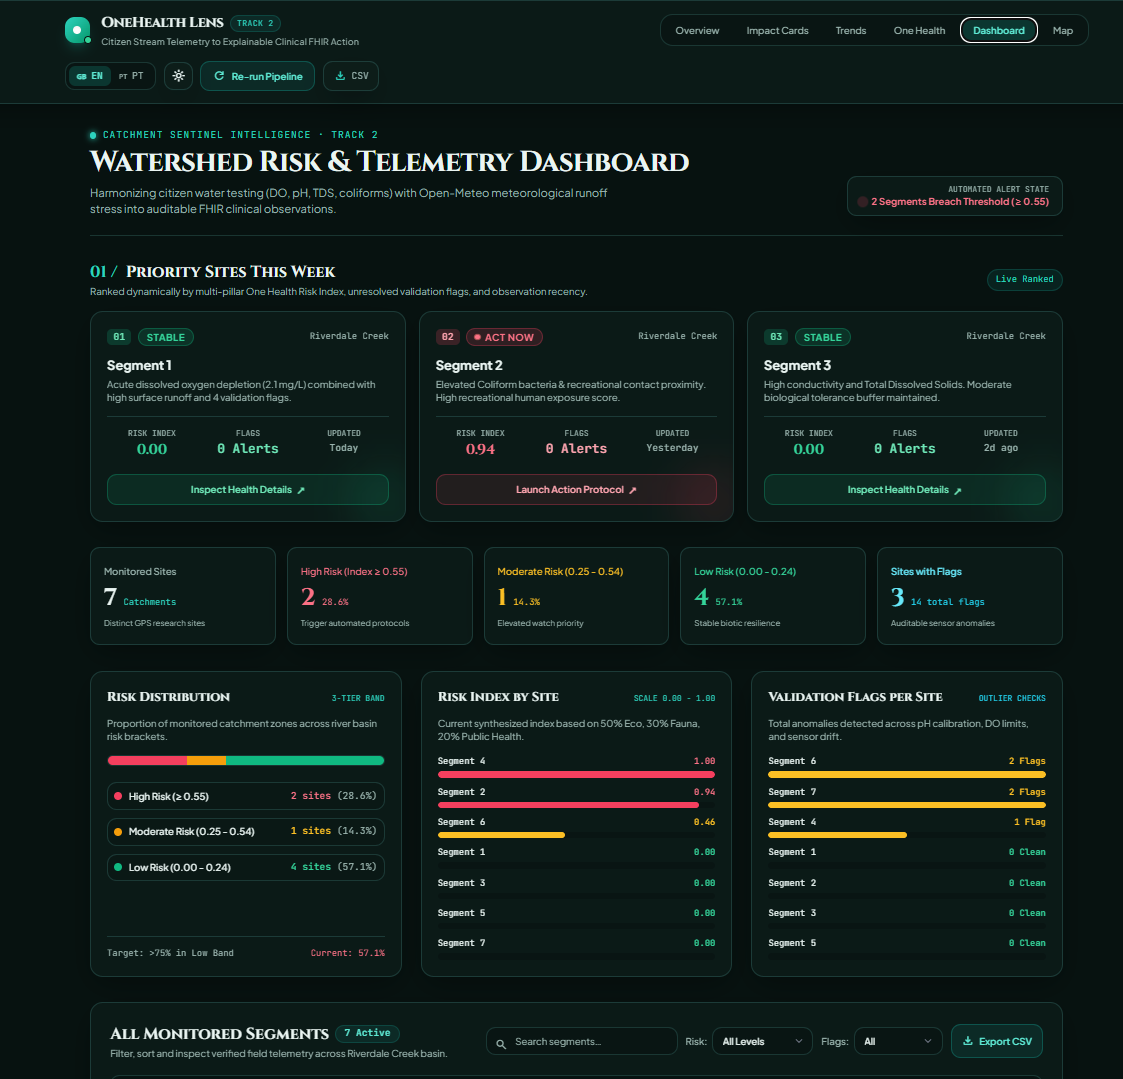
Dashboard_a
-
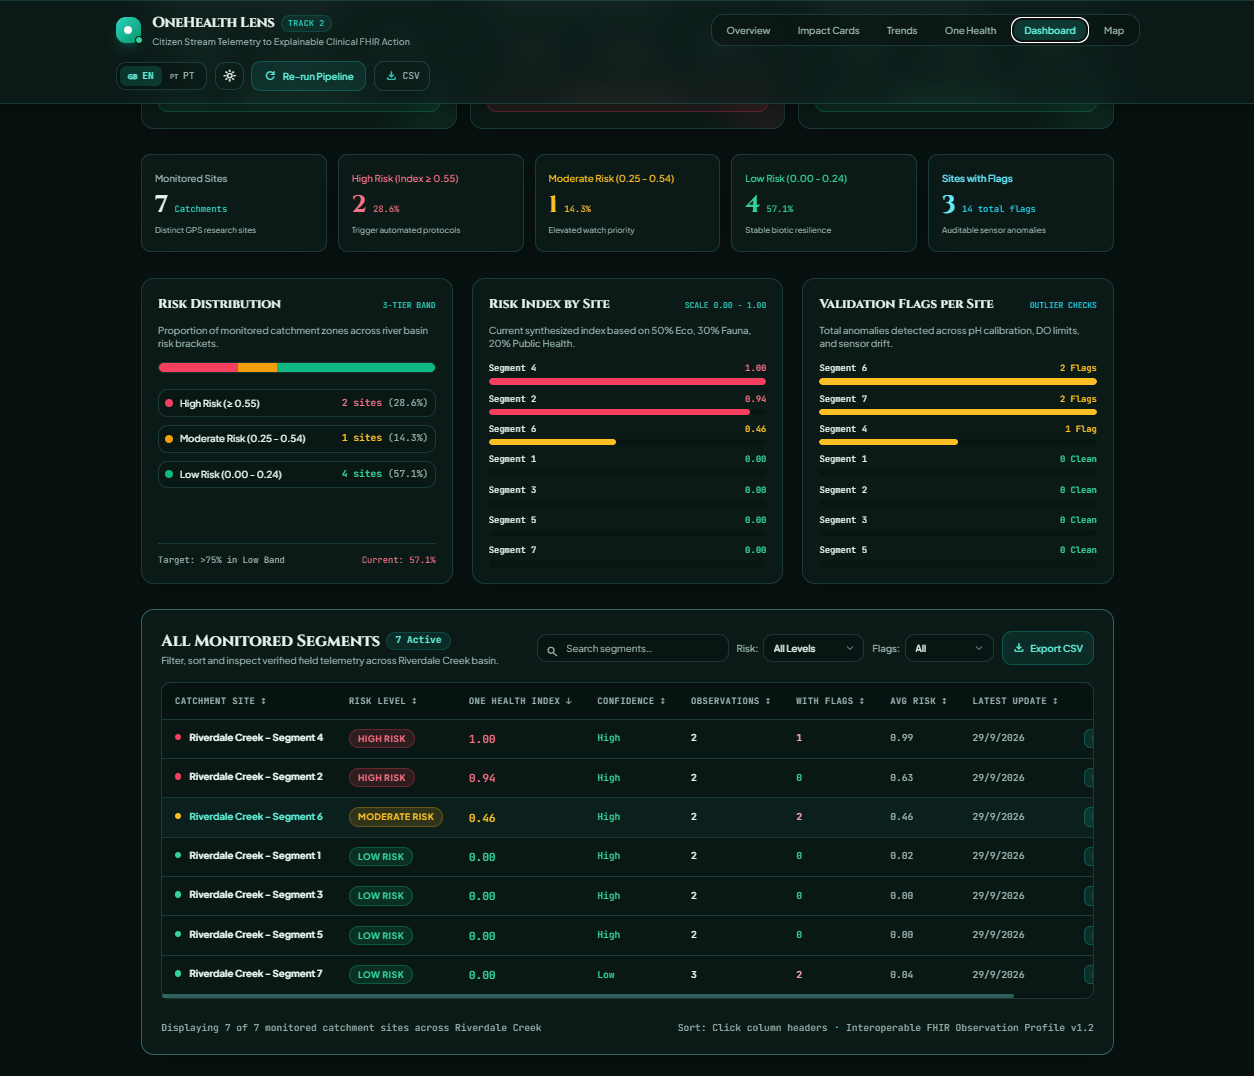
Dashboard_b
-
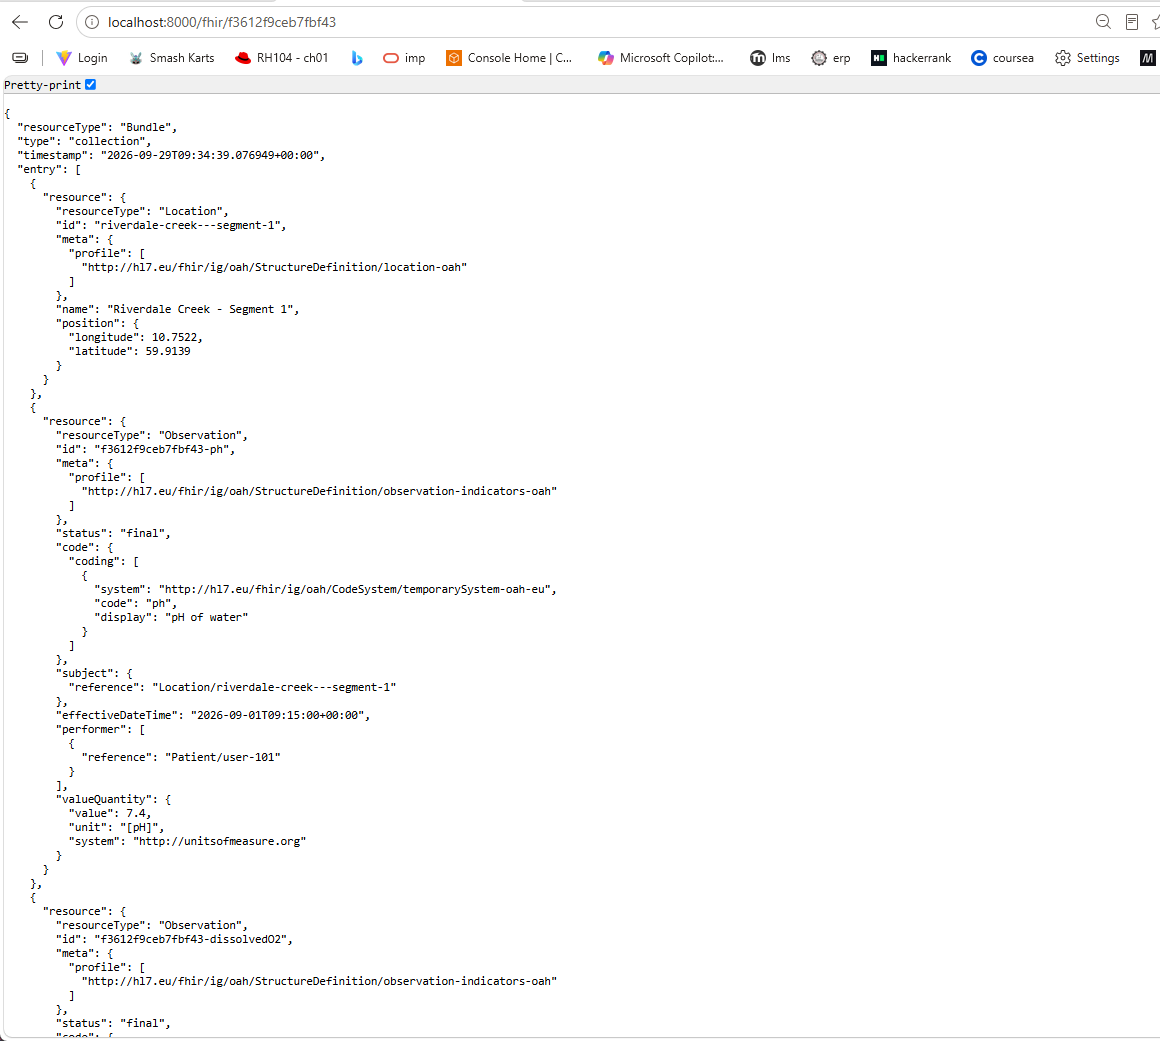
fhir_bundle_json
-
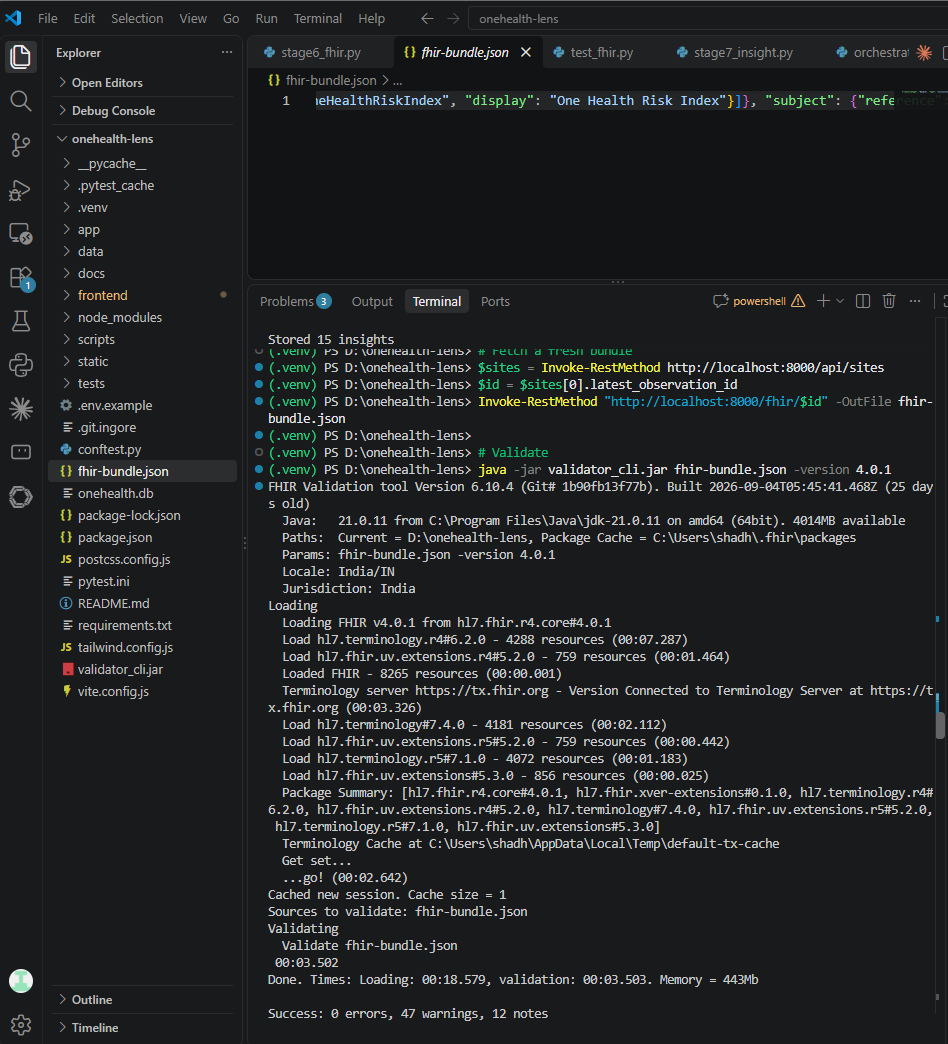
fhir-validator-0-errors
-
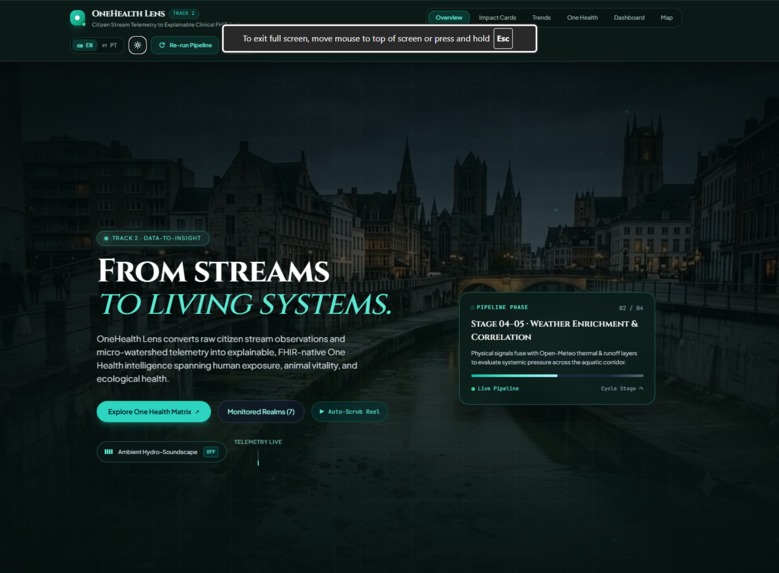
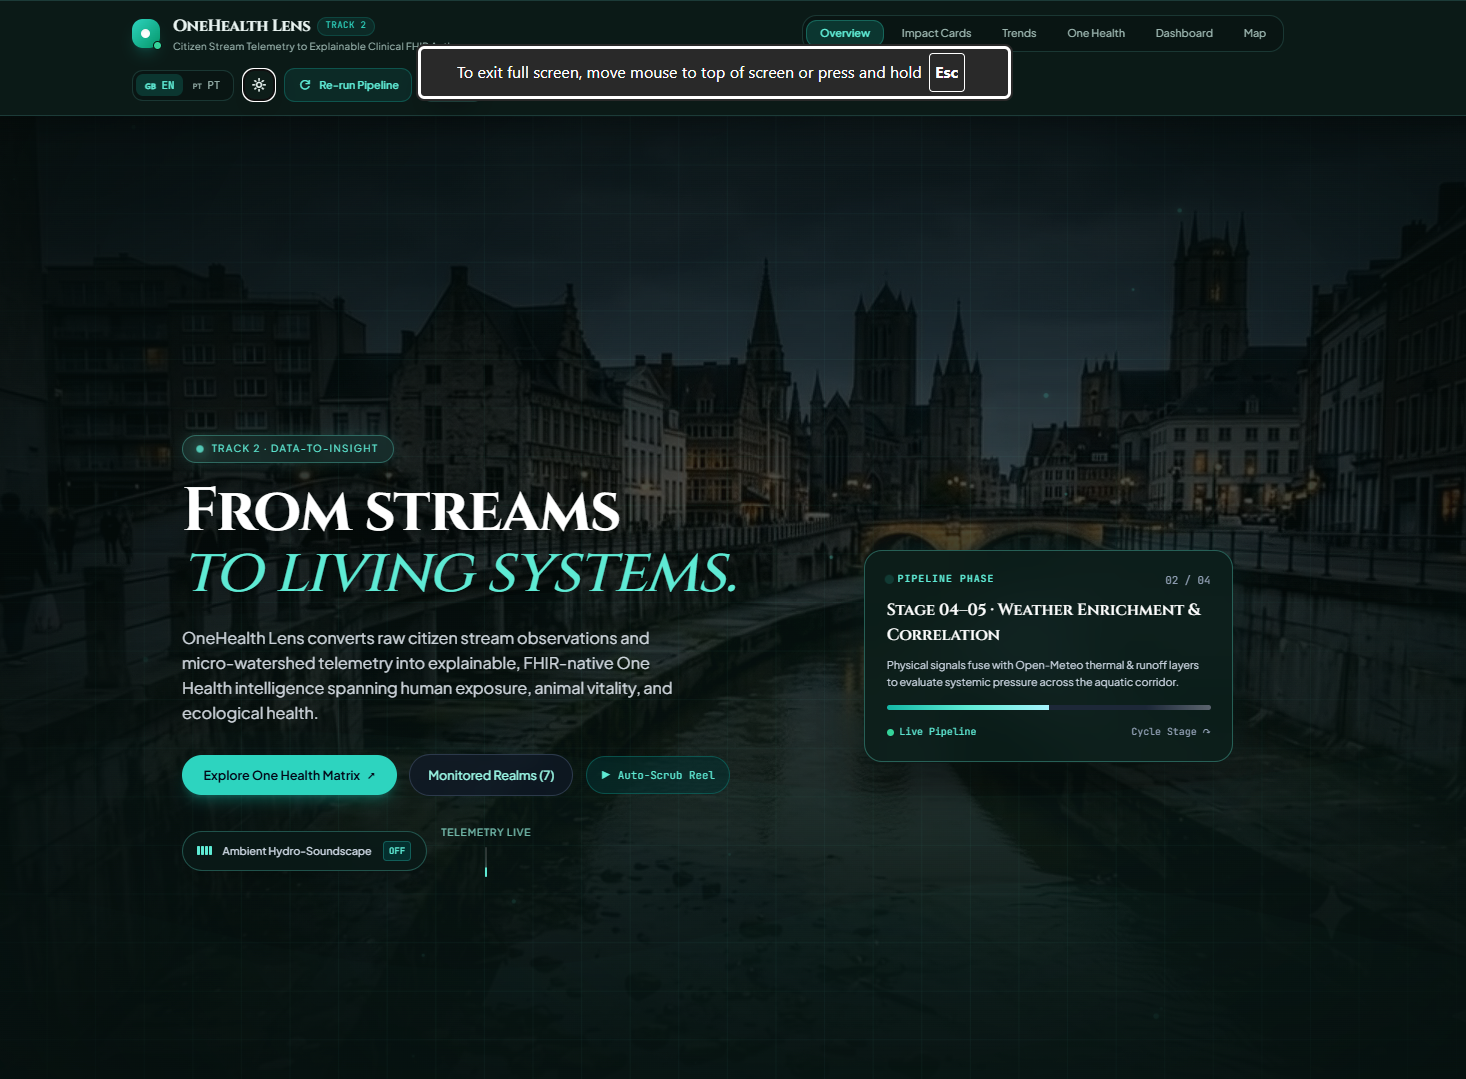
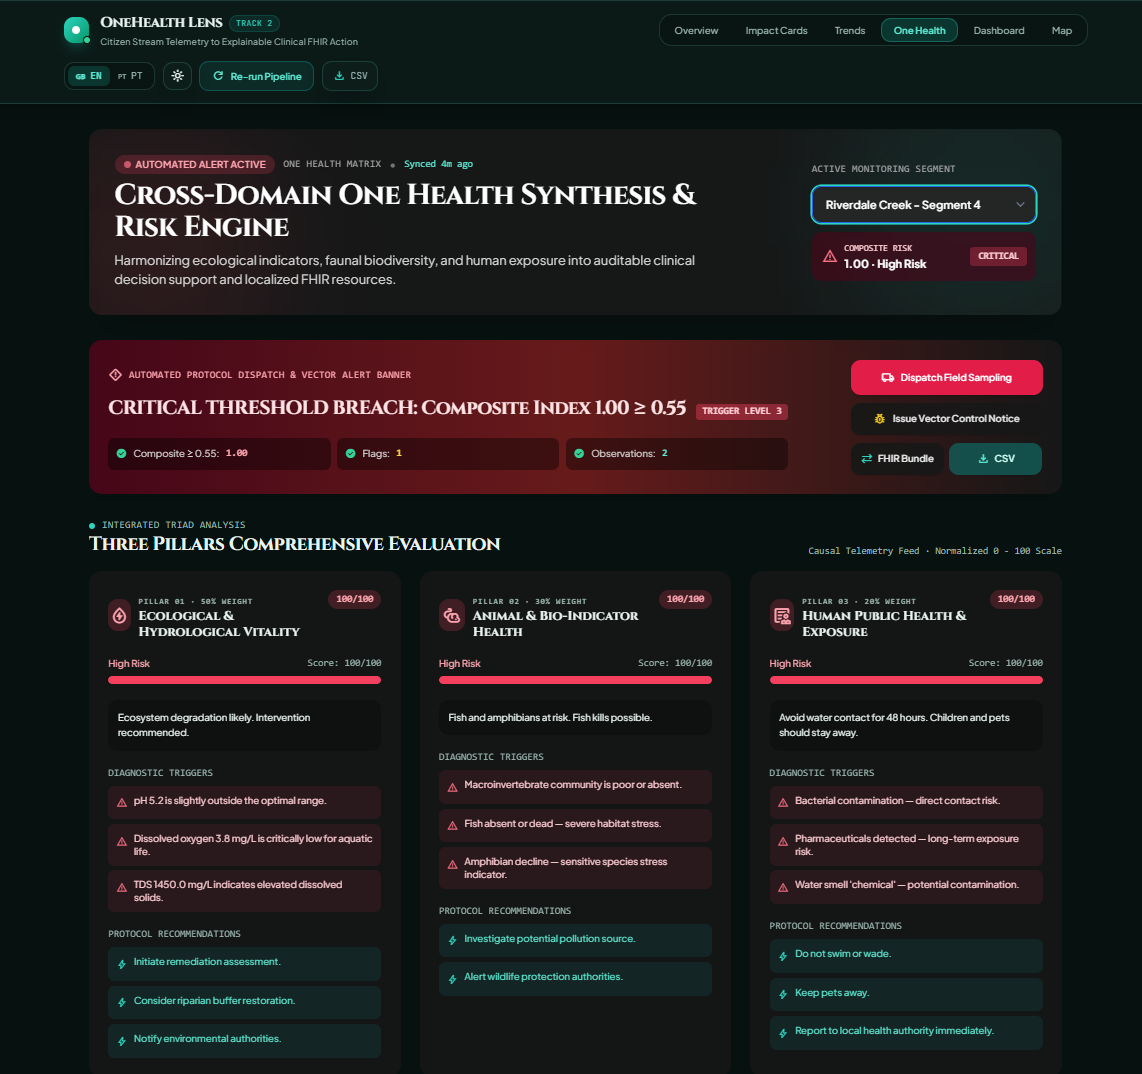
Hero_section
-
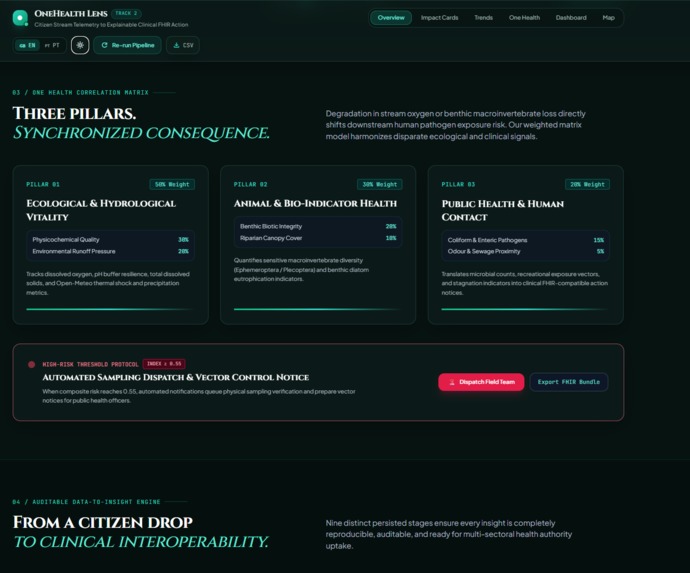
Overview_page
-
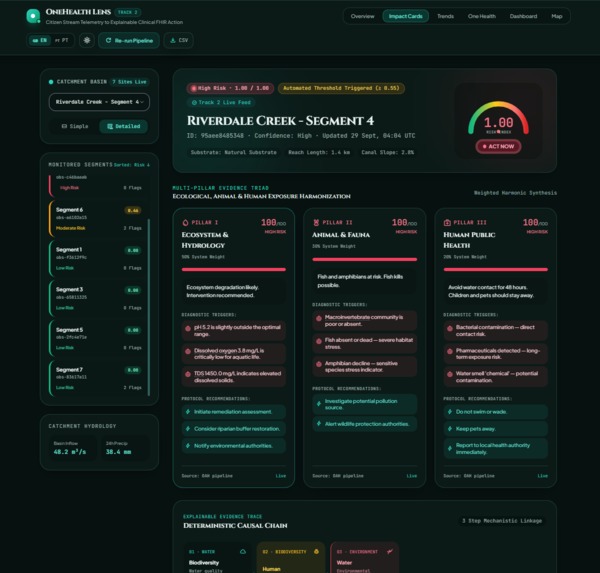
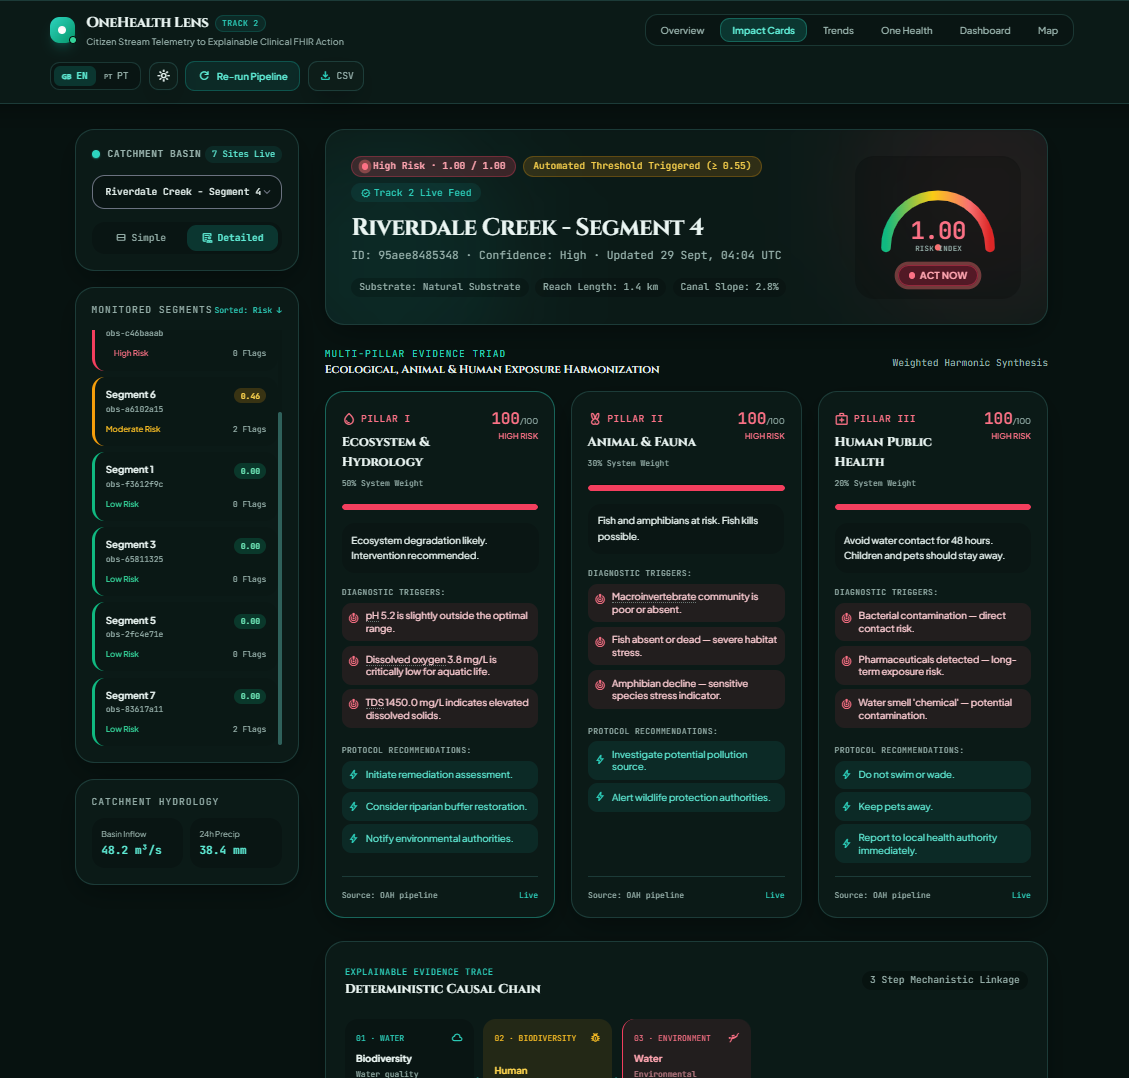
Impact_cards
-
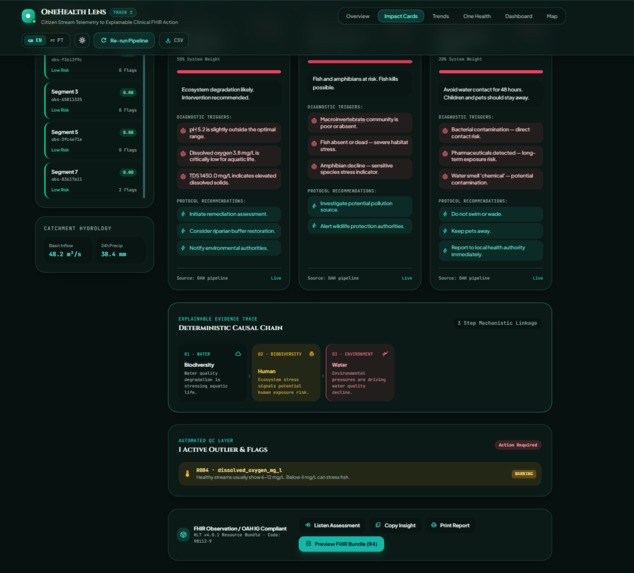
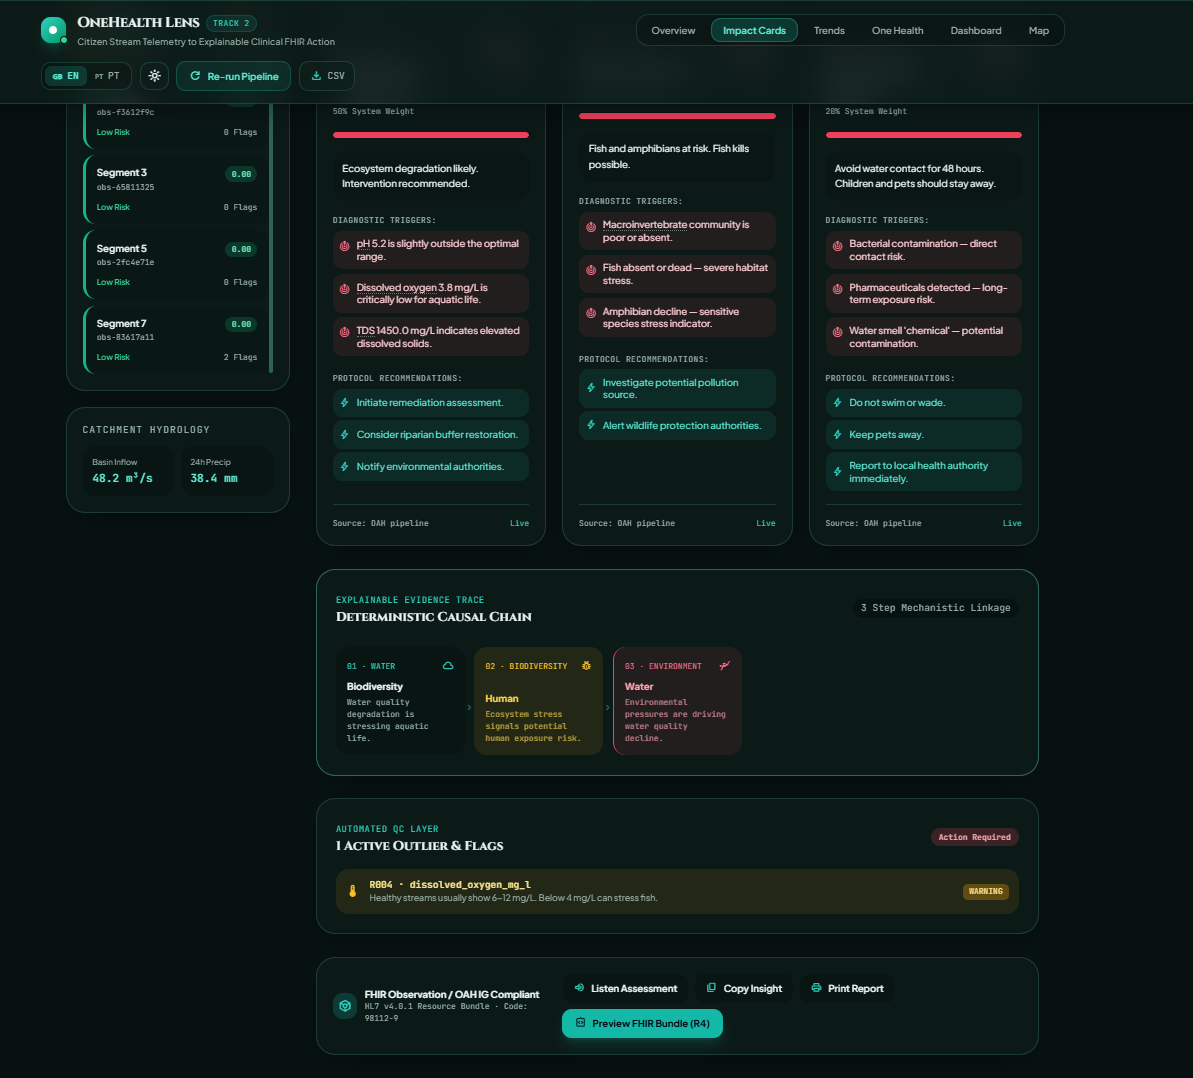
Impact_card_detailed
-
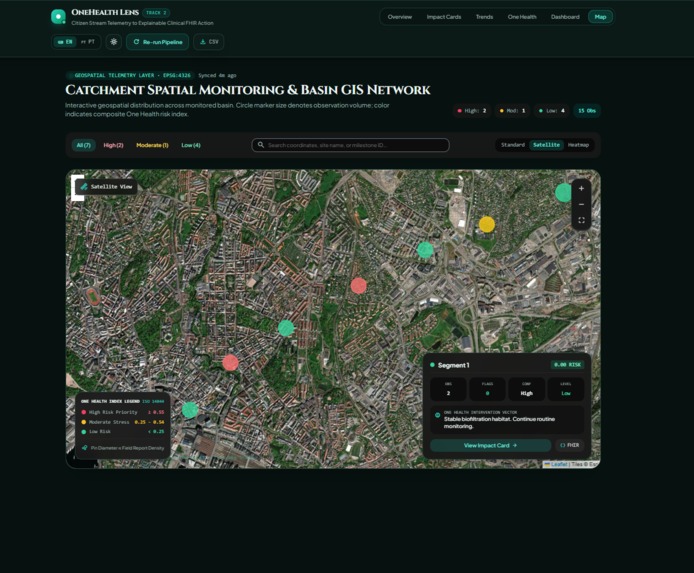
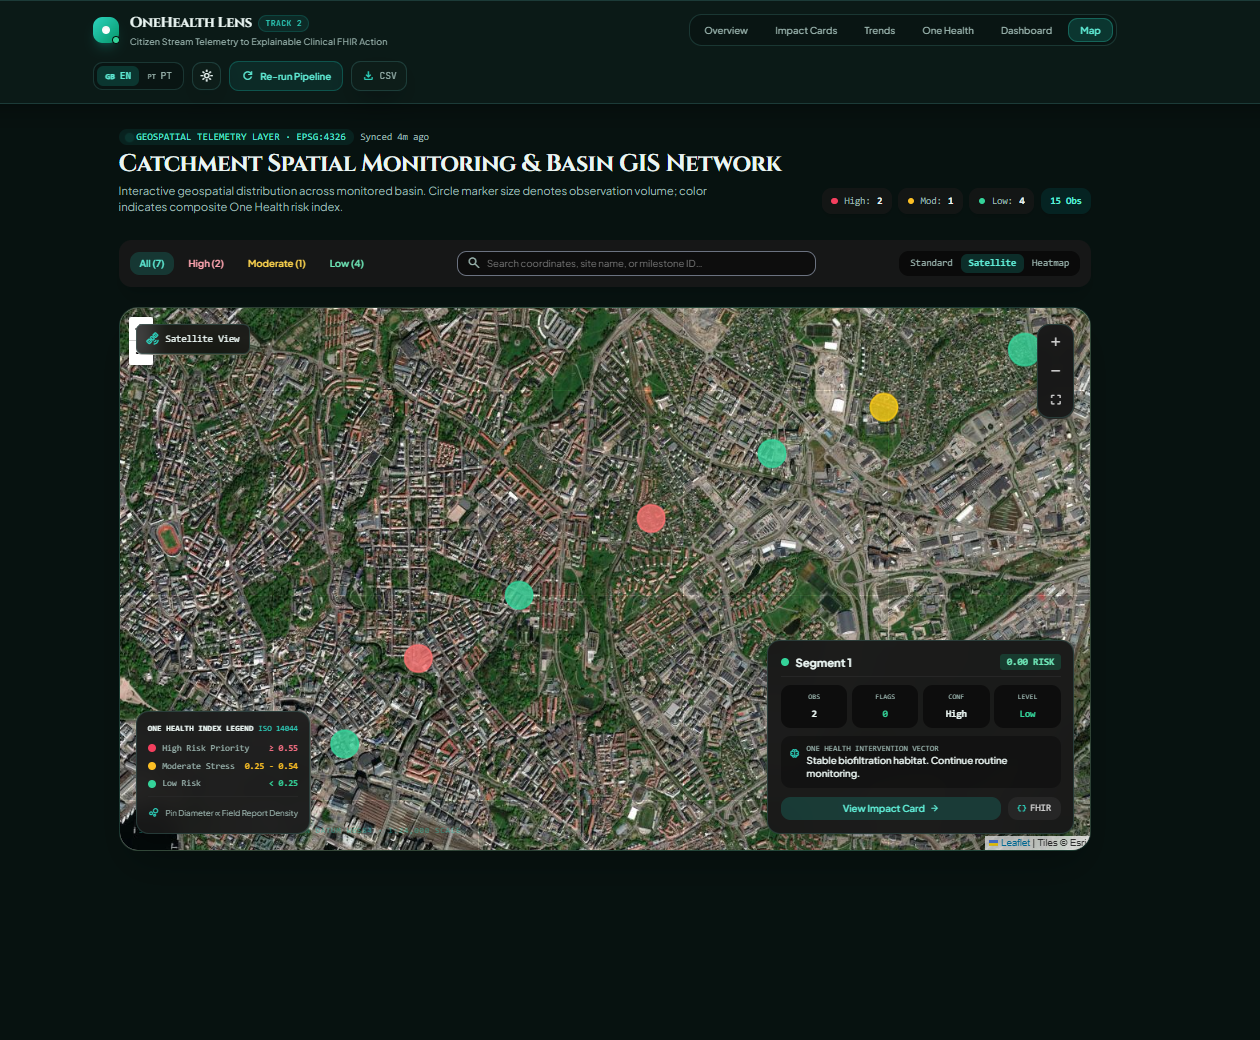
Map
-
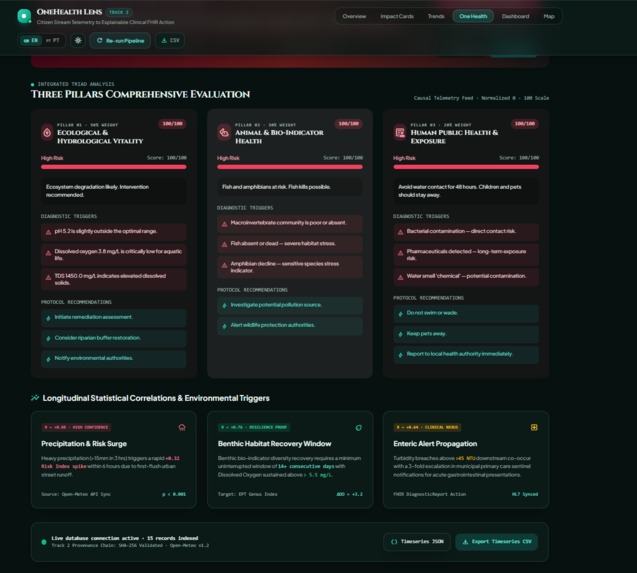
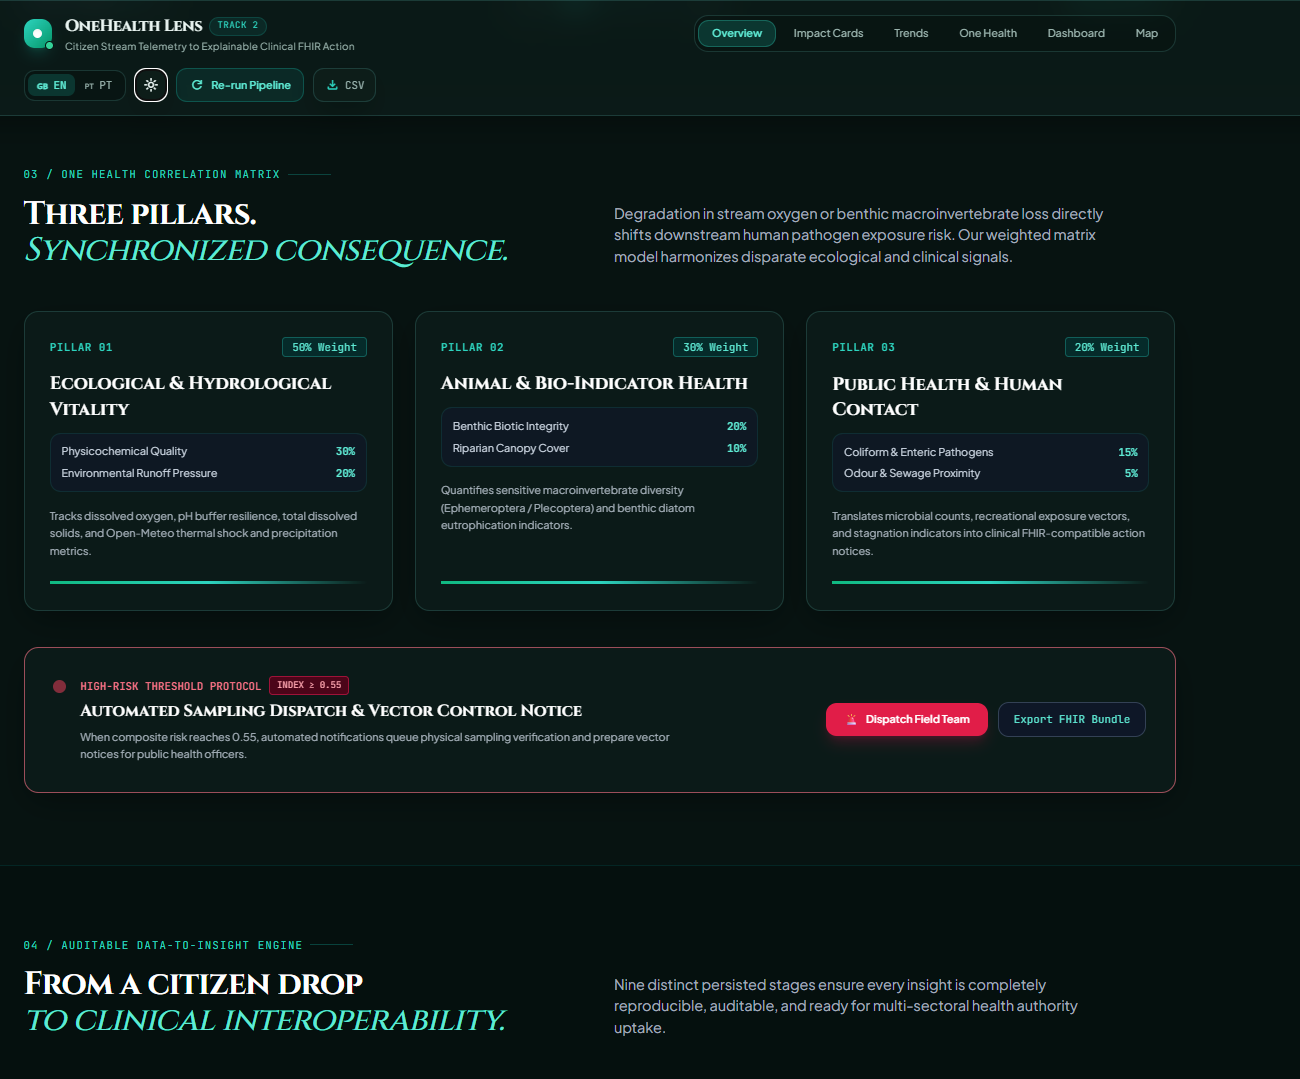
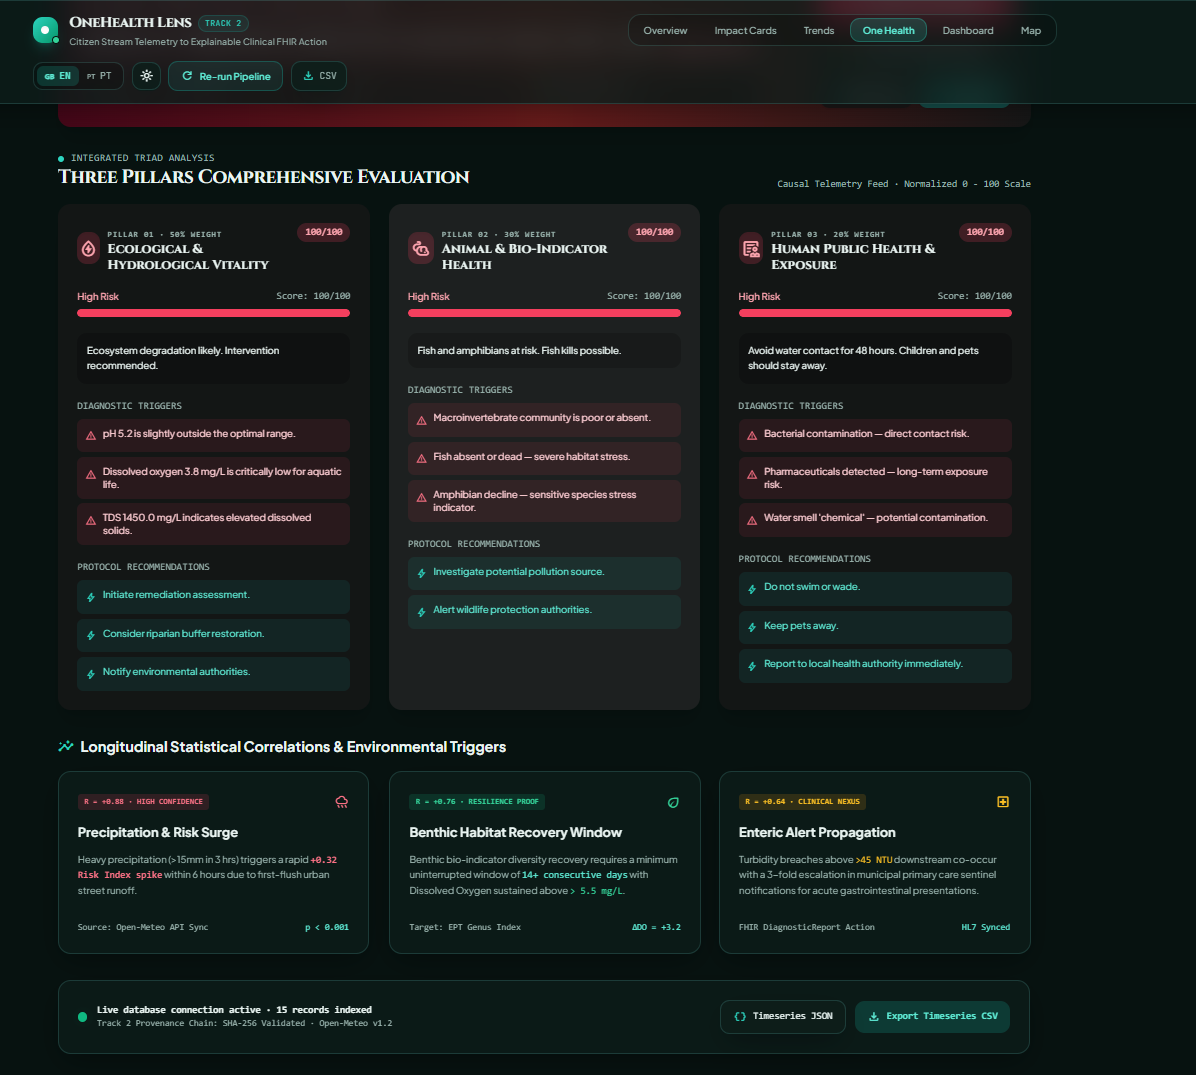
one_health_matrix
-
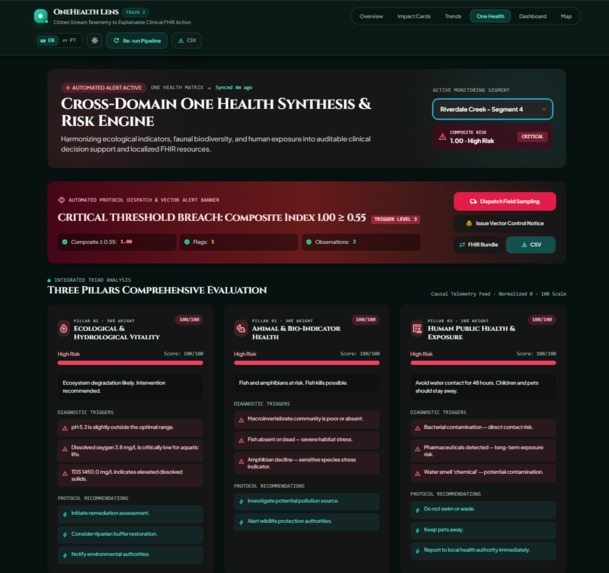
one_health_matrix
-
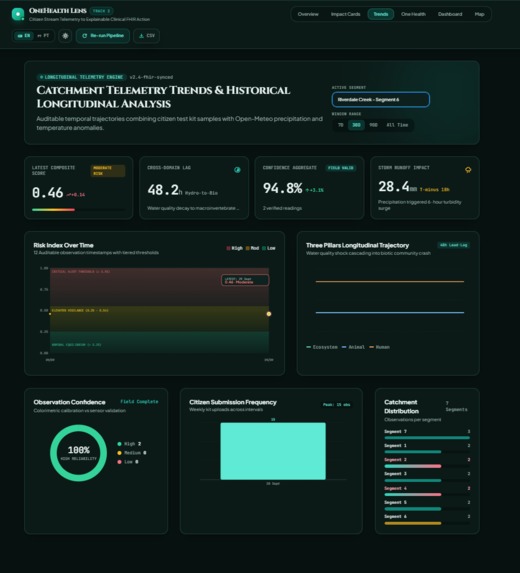
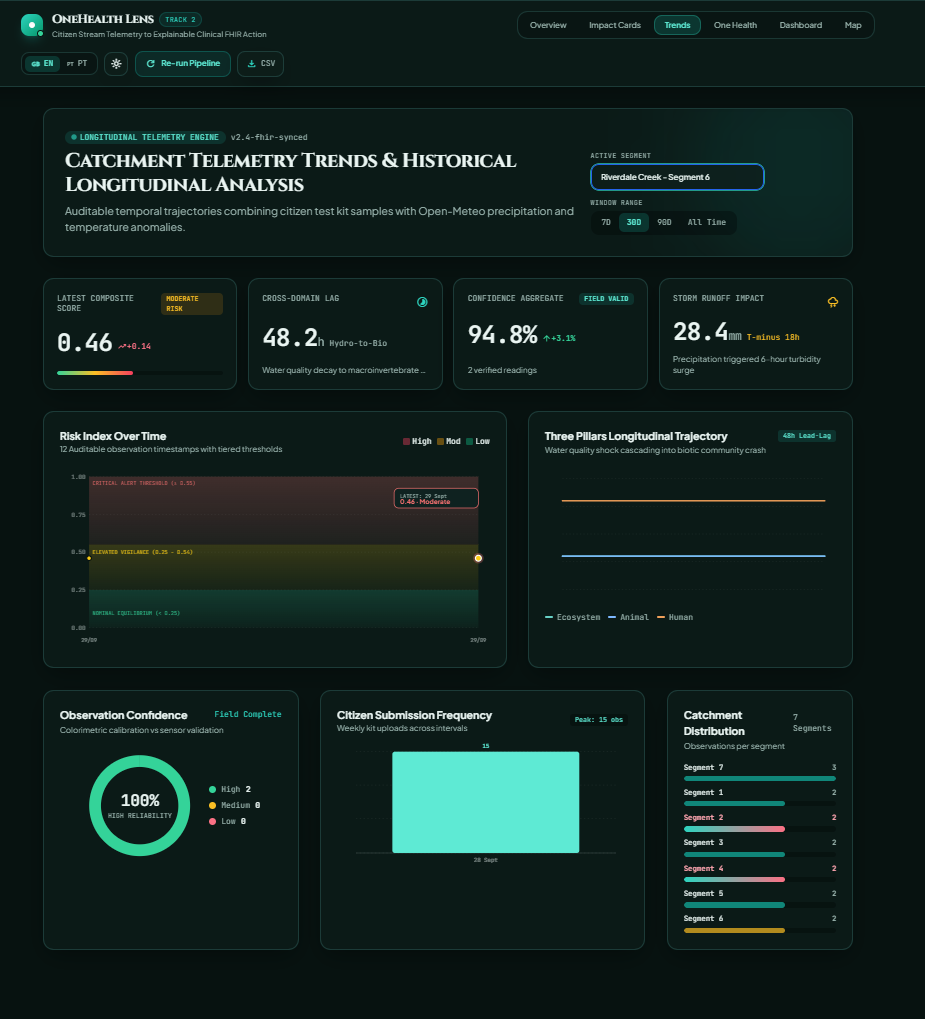
Trend_forecast_linearReg
-
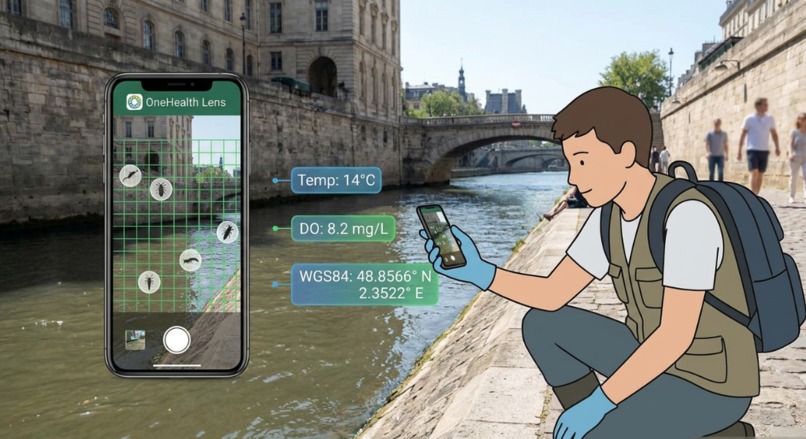
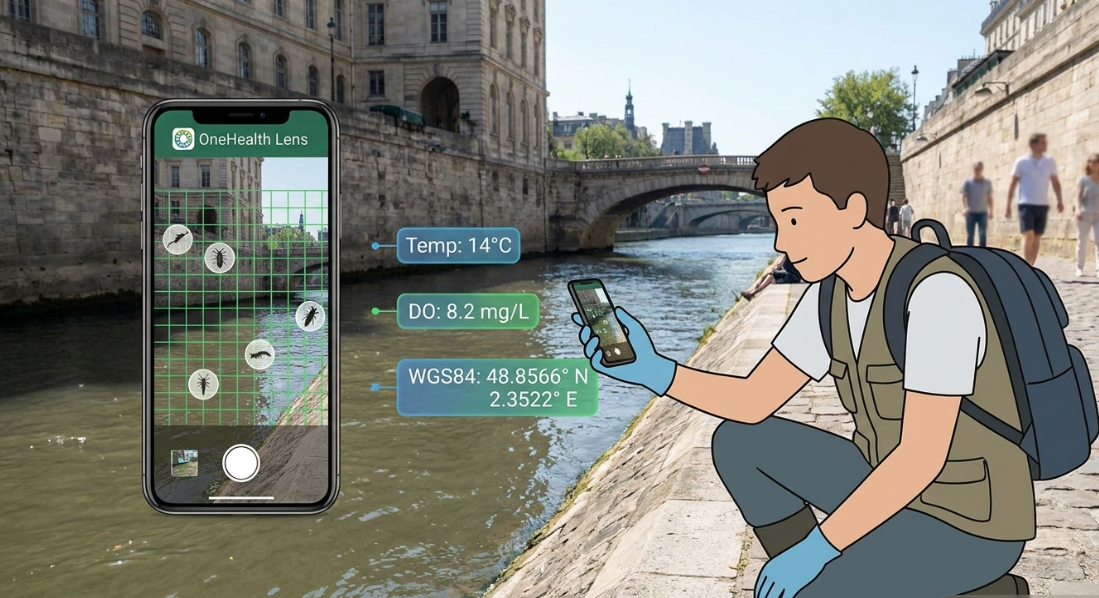
Citizen Science Field App in Action
-
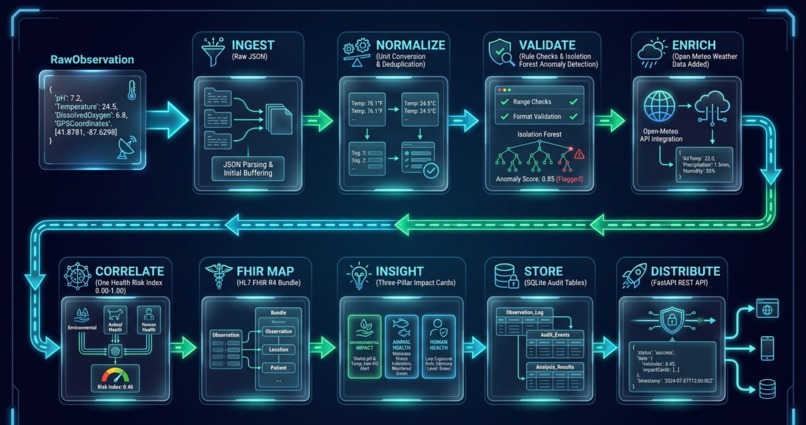
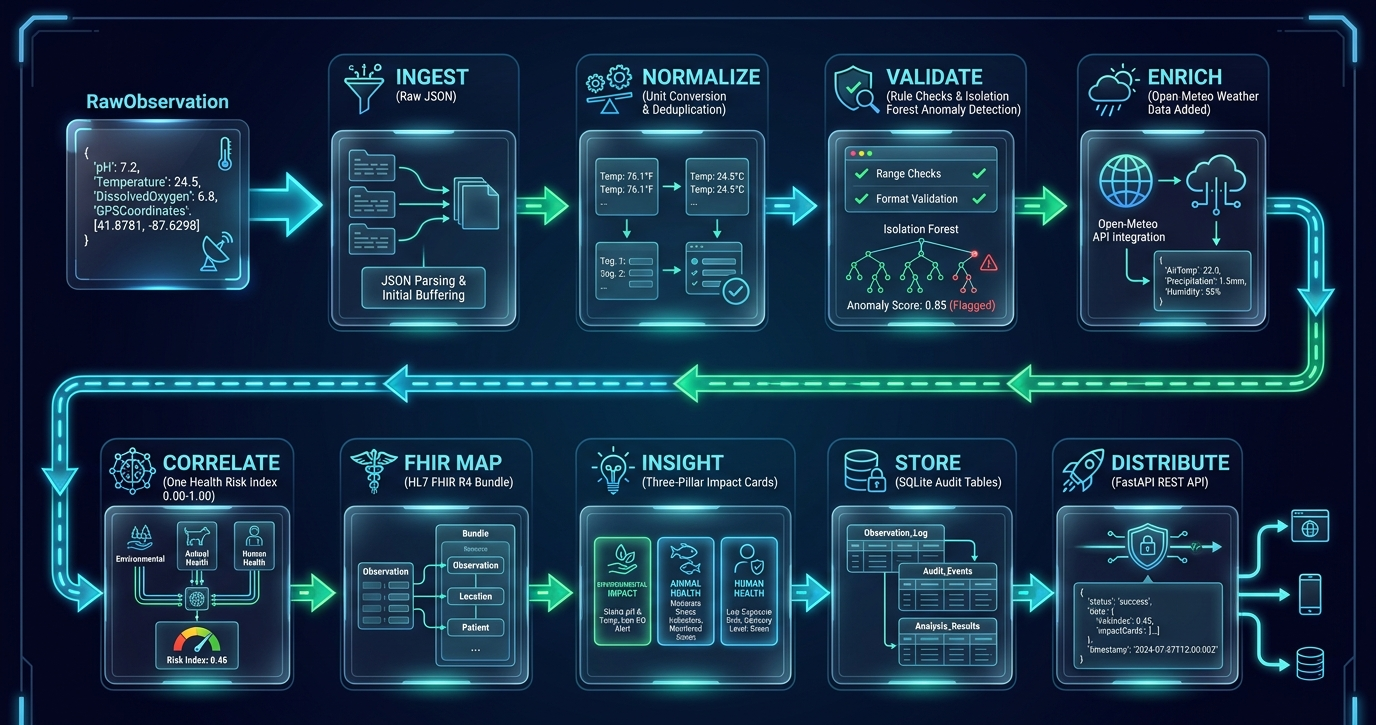
9-Stage Pipeline
OneHealth Lens: Closing the Data Black Hole in Citizen Water Science
Inspiration
A citizen walks beside an urban stream, records water quality, counts insects, captures a photograph, and submits the observation from a phone.
Then nothing happens.
The observation may enter a research database, but the person who collected it rarely learns what it means. Was the pH dangerous? Is the stream improving? Could the condition affect fish, biodiversity, or human exposure? Did the observation help a municipality decide where to act?
We call this the data black hole: valuable community observations go in, but understandable insight never comes back.
That missing feedback affects everyone. Citizens stop contributing when their effort disappears. Researchers need traceable evidence rather than isolated measurements. Municipal teams need priorities, not spreadsheets. Health systems need structured data that can move into existing workflows.
OneHealth Lens was created to close that loop.
Our guiding question was:
What if every citizen observation could return as a clear, explainable One Health insight connected to ecosystem, animal, and human health?
What OneHealth Lens Does
OneHealth Lens transforms a raw stream observation into an explainable, auditable, and action-oriented result.
The current risk model combines four evidence domains:
- Water quality — 30%
- Biological health — 30%
- Human exposure — 20%
- Environmental pressure — 20%
The result is presented through three understandable pillars:
- 🌿 Ecosystem Health
- 🐟 Animal and Fauna Health
- 🧑 Human Public Health
Instead of presenting only one unexplained number, OneHealth Lens shows:
- The risk level and risk band
- Confidence and data completeness
- The evidence that influenced the result
- The causal relationship between domains
- Recommended next actions
- The provenance behind the final insight
The same result serves different audiences. A volunteer can understand the plain-language summary. A researcher can inspect the evidence. A municipality can identify priority sites. A health or data team can access the structured FHIR representation.
From Observation to Action
Every observation moves through a structured nine-stage pipeline:
- Ingest — receive observations from an API, field workflow, CSV export, or local dataset.
- Normalize — standardize measurements, units, identifiers, and timestamps.
- Validate — apply rule-based checks and anomaly detection.
- Enrich — add contextual weather information where available.
- Correlate — combine water, biological, human, and environmental signals.
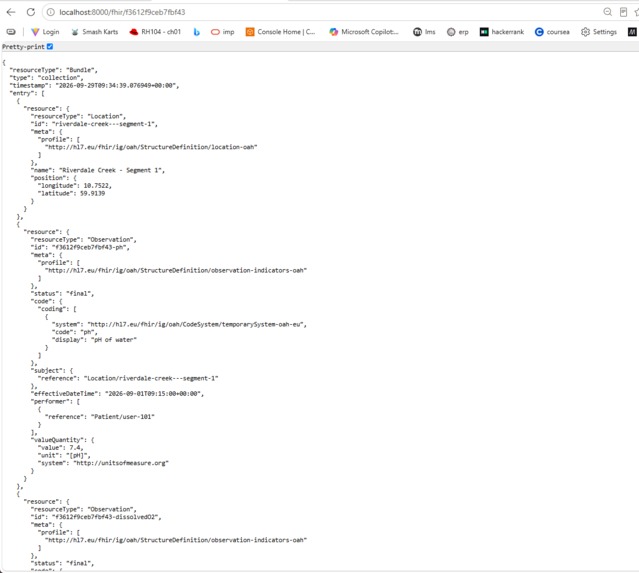
- FHIR Map — serialize the observation into FHIR R4 resources.
- Insight — generate the Impact Card and plain-language explanations.
- Store — preserve pipeline artifacts for auditability.
- Distribute — expose results through FastAPI and the React interface.
The primary output is the Three-Pillar Impact Card. For example, a low dissolved-oxygen reading may increase ecosystem risk, indicate stress for aquatic organisms, and contribute to a related exposure concern when the available evidence supports one.
Every score includes a “why” list. Instead of saying only “High Risk,” the card can explain that:
- pH is outside the preferred range
- dissolved oxygen is low for aquatic life
- validation flags remain unresolved
- recent environmental pressure increases concern
This is explainability as a product feature, not an afterthought.
Product Experience
Overview
The Overview page gives citizens, scientists, and decision-makers a shared starting point. It answers:
- Where are we monitoring?
- What is changing?
- Why does it matter for health?
Dashboard
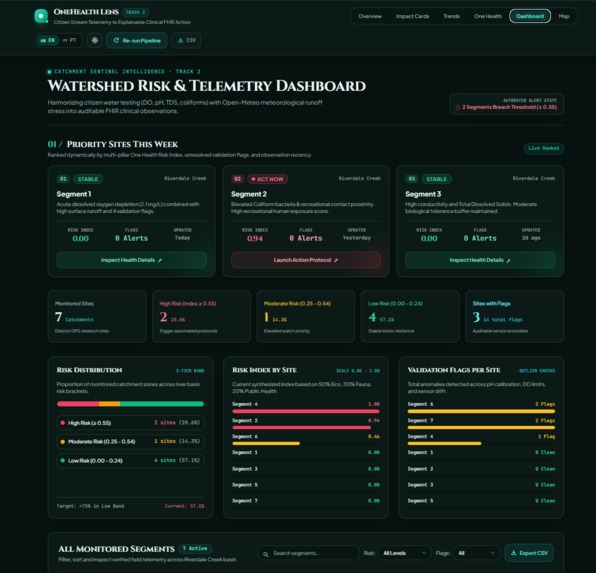
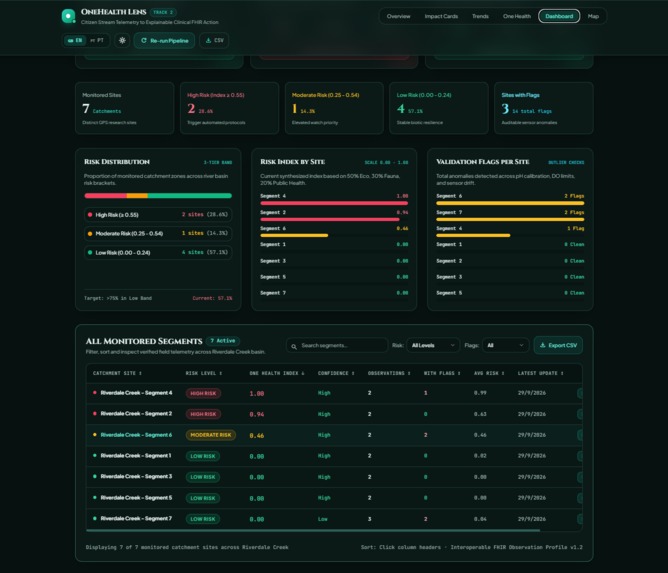
The Dashboard is the operational view. It includes monitored-site KPIs, risk distribution, priority-site ranking, search, filtering, validation status, and direct navigation to detailed evidence.
The goal is to shorten the distance between “something may be wrong” and “this is the site that needs attention.”
Impact Cards
Impact Cards are the explanation layer. They provide:
- Risk index and risk band
- Three-pillar synthesis
- Causal chain
- Confidence indicator
- Diagnostic triggers
- Protocol recommendations
- FHIR preview
- Speech narration
Simple mode supports quick field briefings and community understanding. Detailed mode reveals the evidence, triggers, and recommended actions for scientific or municipal review.
Trends
The Trends page prevents overreaction to a single reading. It shows historical risk movement, risk bands, forecast context, confidence, and submission frequency so users can distinguish persistent deterioration from a one-time unusual measurement.
One Health
The One Health page makes the relationship between ecosystem, animal, and human health explicit. It connects evidence to alert protocols, recovery context, field sampling, environmental intervention, and public-health follow-up.
Map
The Map turns risk into place. Colour-coded markers help catchment managers identify clusters, select a site, and move directly to its Impact Card. It uses Leaflet and OpenStreetMap to avoid unnecessary vendor lock-in.
Field Capture
The field workflow supports measurements and optional photo or video evidence. When connectivity is unreliable, observations can be queued locally using IndexedDB with a fallback mechanism. The application exposes connectivity state and supports retry and Background Sync patterns so a difficult field visit does not become another data black hole.
Audit Trail
The Audit Trail makes the system inspectable. Reviewers can follow an insight back through ingestion, normalization, validation, enrichment, correlation, FHIR mapping, rendering, storage, and distribution.
How We Built It
The backend uses:
- Python and FastAPI
- Pydantic v2 validation
- SQLite with configurable production database settings
fhir.resources- scikit-learn Isolation Forest anomaly detection
- pytest
The frontend uses:
- React and Vite
- Leaflet and OpenStreetMap
- Native browser APIs
- Hand-written SVG visualisations
- Progressive Web App capabilities
The architecture is modular. Pipeline stages use typed inputs and outputs, validation failures remain visible, and unusual citizen values are flagged instead of silently rewritten.
The project includes automated API and frontend tests, production builds, API readiness checks, request validation, configurable CORS, authenticated live ingestion, duplicate-submission reporting, media metadata, offline queue handling, and service-worker Background Sync configuration.
Challenges We Faced
Ambiguous units
Citizen data does not always arrive with perfect context. A temperature value
such as 57 could mean Fahrenheit or Celsius. Dissolved oxygen may be
expressed as concentration or saturation.
We added documented conversion rules and preserved the transformation logic. When the system cannot safely interpret a value, it flags the issue rather than silently inventing certainty.
Validation versus trust
An early approach silently corrected implausible values. That was convenient, but it could destroy trust. A pH reading of 3 may be a mistake, or it may indicate a genuine pollution event.
The final system flags anomalies, explains the rule that was triggered, and keeps the original observation available for review. It supports human judgment instead of pretending the algorithm is always right.
FHIR interoperability
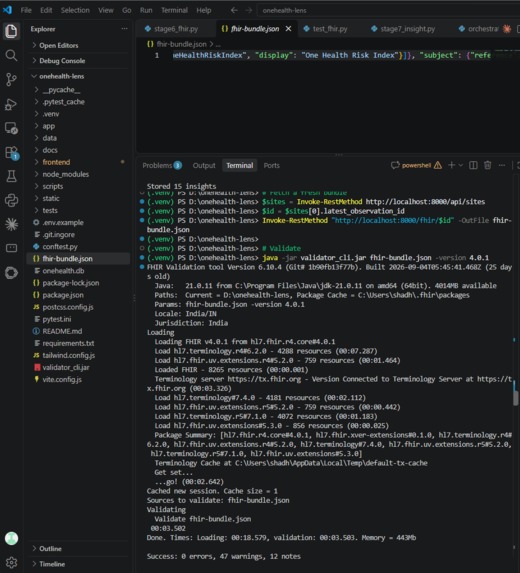
FHIR is not simply JSON with familiar field names. Correct interoperability requires appropriate resources, profiles, identifiers, terminology, and references.
We implemented explicit FHIR mapping rather than loosely templated output. Local structural validation is part of the development workflow. Official OAH package/profile validation remains a submission evidence gate and is not claimed here without the corresponding external validator result.
Scope discipline
We considered satellite indices, computer vision, health-registry integration, and larger data integrations. We did not display metrics that we could not compute from an actual source.
A missing metric is more credible than a fabricated one.
What We Learned
One Health is an engineering constraint
It is easy to put “One Health” in a project title. It is harder to represent ecosystem, animal, and human health separately, connect them causally, and explain how one domain influences another.
That requirement changed the architecture, data model, visual design, and wording of every insight.
Explainability must be designed from the beginning
Our reason strings are not added after the score is calculated. Scoring functions record which fields contributed to the result and why. Explanation is a first-class output of the pipeline.
Performance is part of usability
A field application must feel responsive, particularly on mobile devices and unstable networks. We designed for clear loading and error states, responsive layouts, visible connectivity, and offline-friendly interaction.
Citizen science needs a feedback loop
Citizens do not contribute only because they are asked to submit data. They contribute when they can see that their effort matters.
OneHealth Lens returns meaning to the person who created the observation.
What Comes Next
Our remaining validation milestones are deliberately measurable:
- Official OAH Implementation Guide package/profile validation
- Calibration against real expert and laboratory reference data
- PostgreSQL concurrency and load testing
- Production-grade distributed authorization and rate limiting
- Field validation of offline synchronization and conflict resolution
- Durable media storage for observation evidence
- Deeper integration with OneAquaHealth decision-support workflows
The architecture is prepared for these extensions without changing the core citizen-observation contract.
Why This Matters
OneHealth Lens is not another dashboard that collects data and leaves interpretation to someone else.
It is a translation layer:
From citizen observation, to explainable risk, to coordinated One Health action.
It gives volunteers feedback, scientists traceability, municipalities priorities, and health systems structured data.
Most importantly, it makes the connection visible:
Healthy water supports healthy ecosystems. Healthy ecosystems support healthy animals. Healthy environments support healthy people.
And when a community contributes the first signal, the system gives something meaningful back. for better understanding :https://notebooklm.link.google/rcXlo1kkvJvL || https://youtu.be/JqMzqOijSWo
Built With
- accessibility
- chrome-translator-api
- css
- fastapi
- fhir
- hl7-fhir
- html
- i18n
- javascript
- leaflet.js
- open-meteo
- openstreetmap
- progressive-web-apps
- pydantic
- pytest
- python
- react
- rest-api
- scikit-learn
- sqlite
- svg
- vite
- wcag
- web-speech-api


Log in or sign up for Devpost to join the conversation.