-
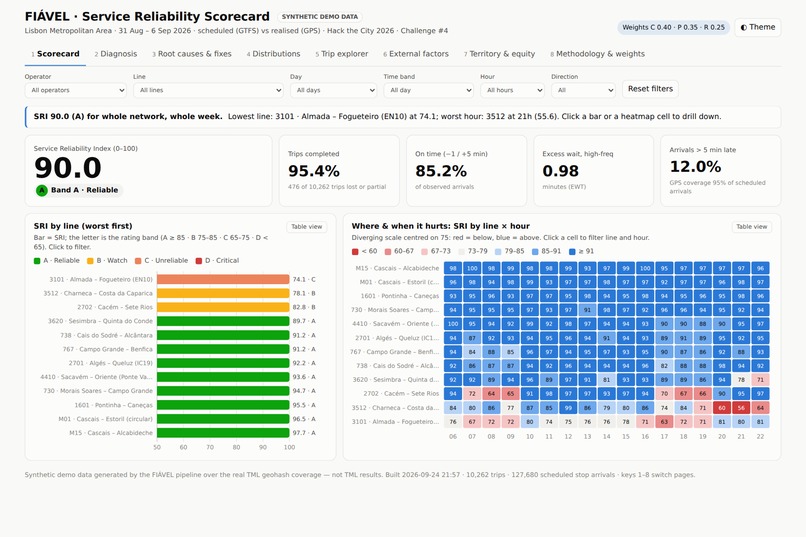
Scorecard
-
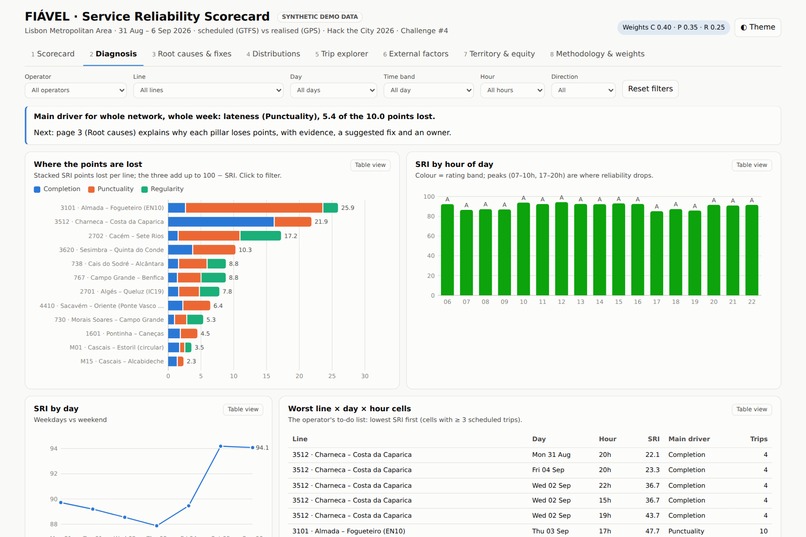
Diagnosis
-
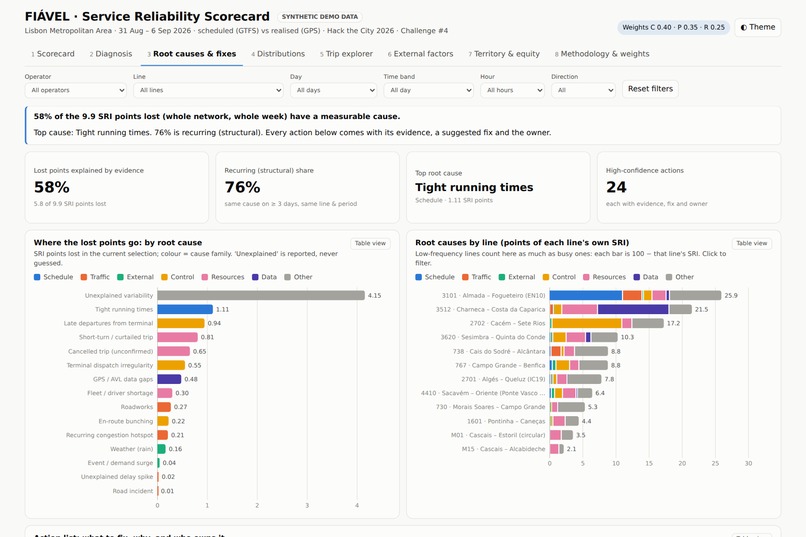
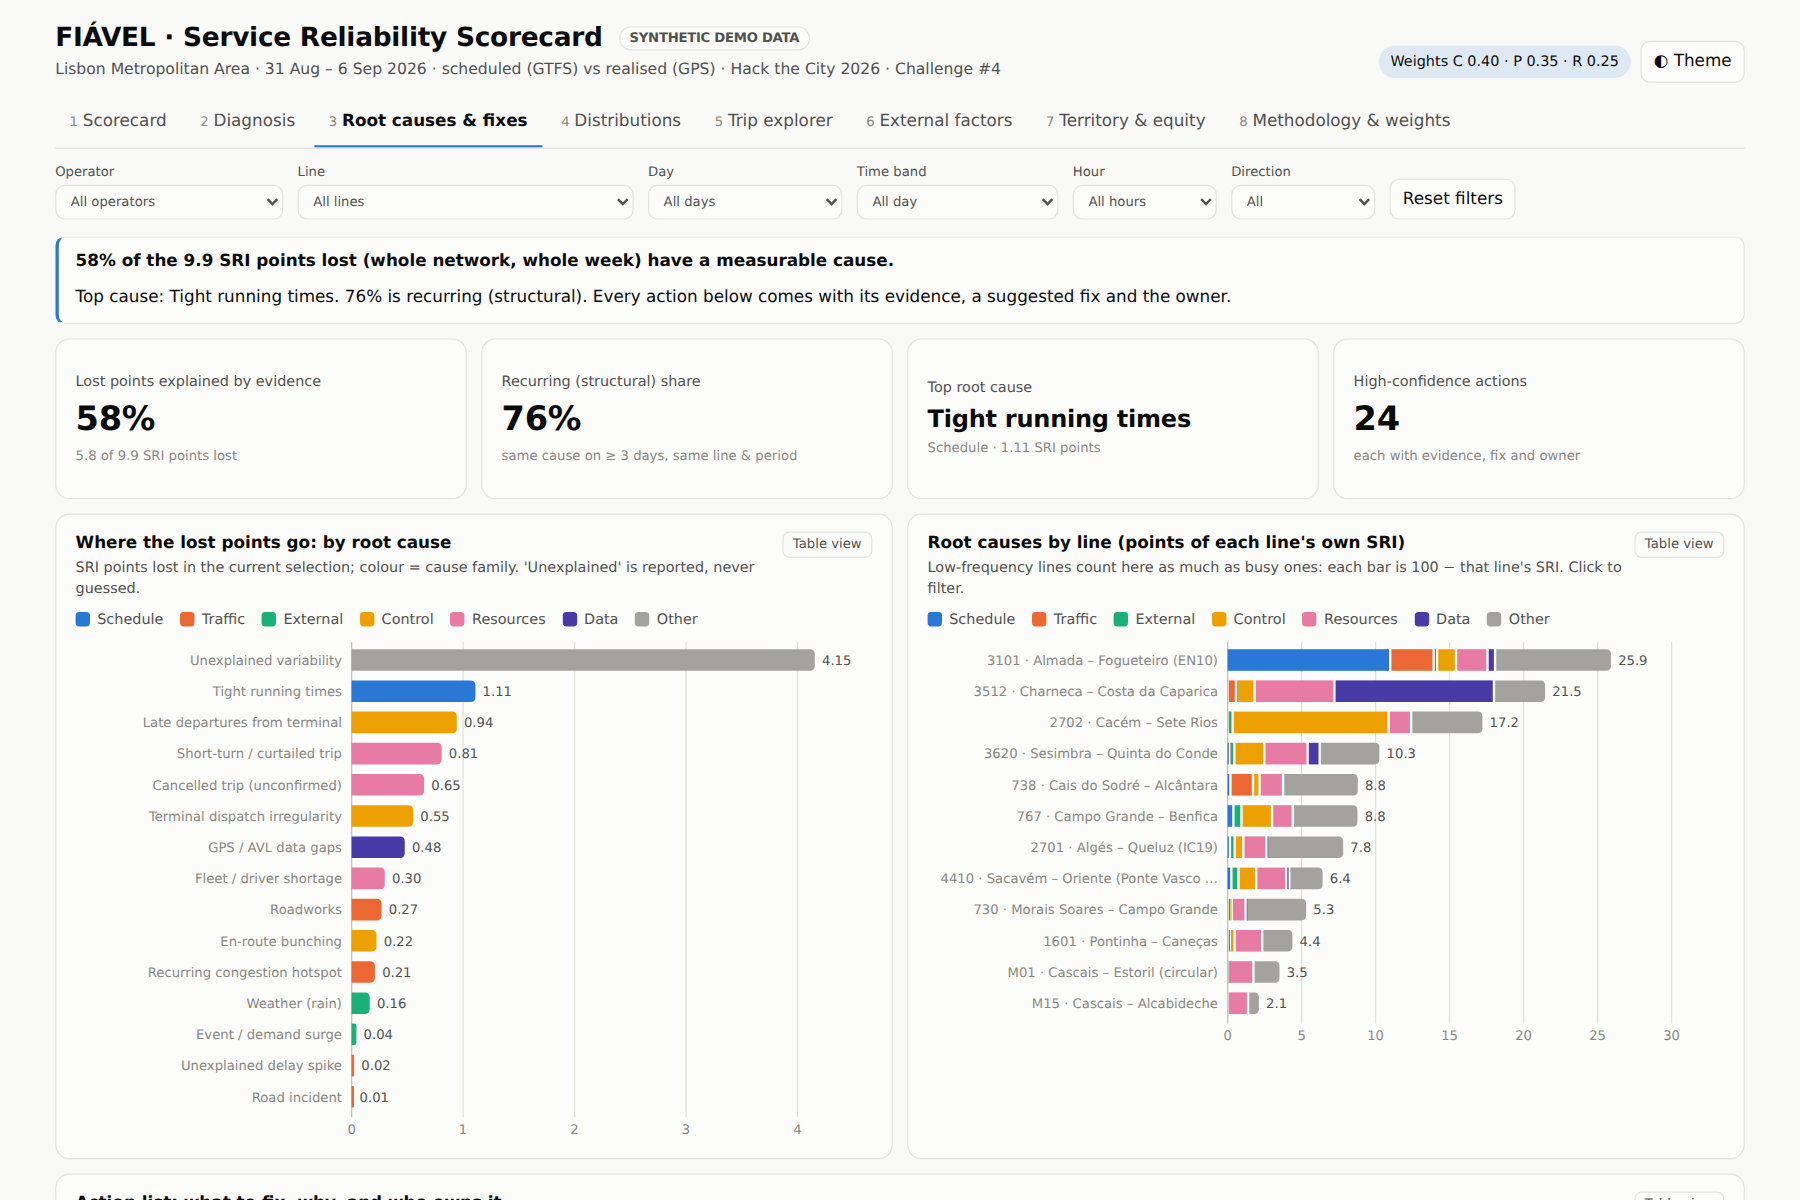
Root causes & fixes
-
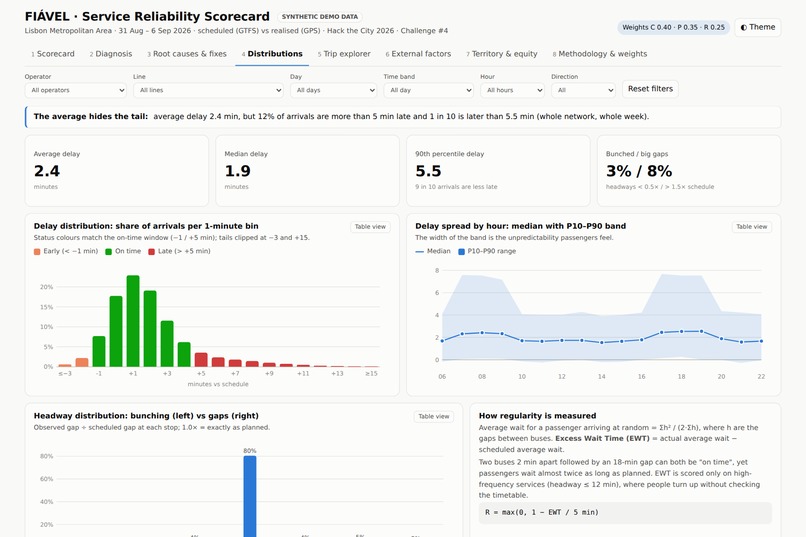
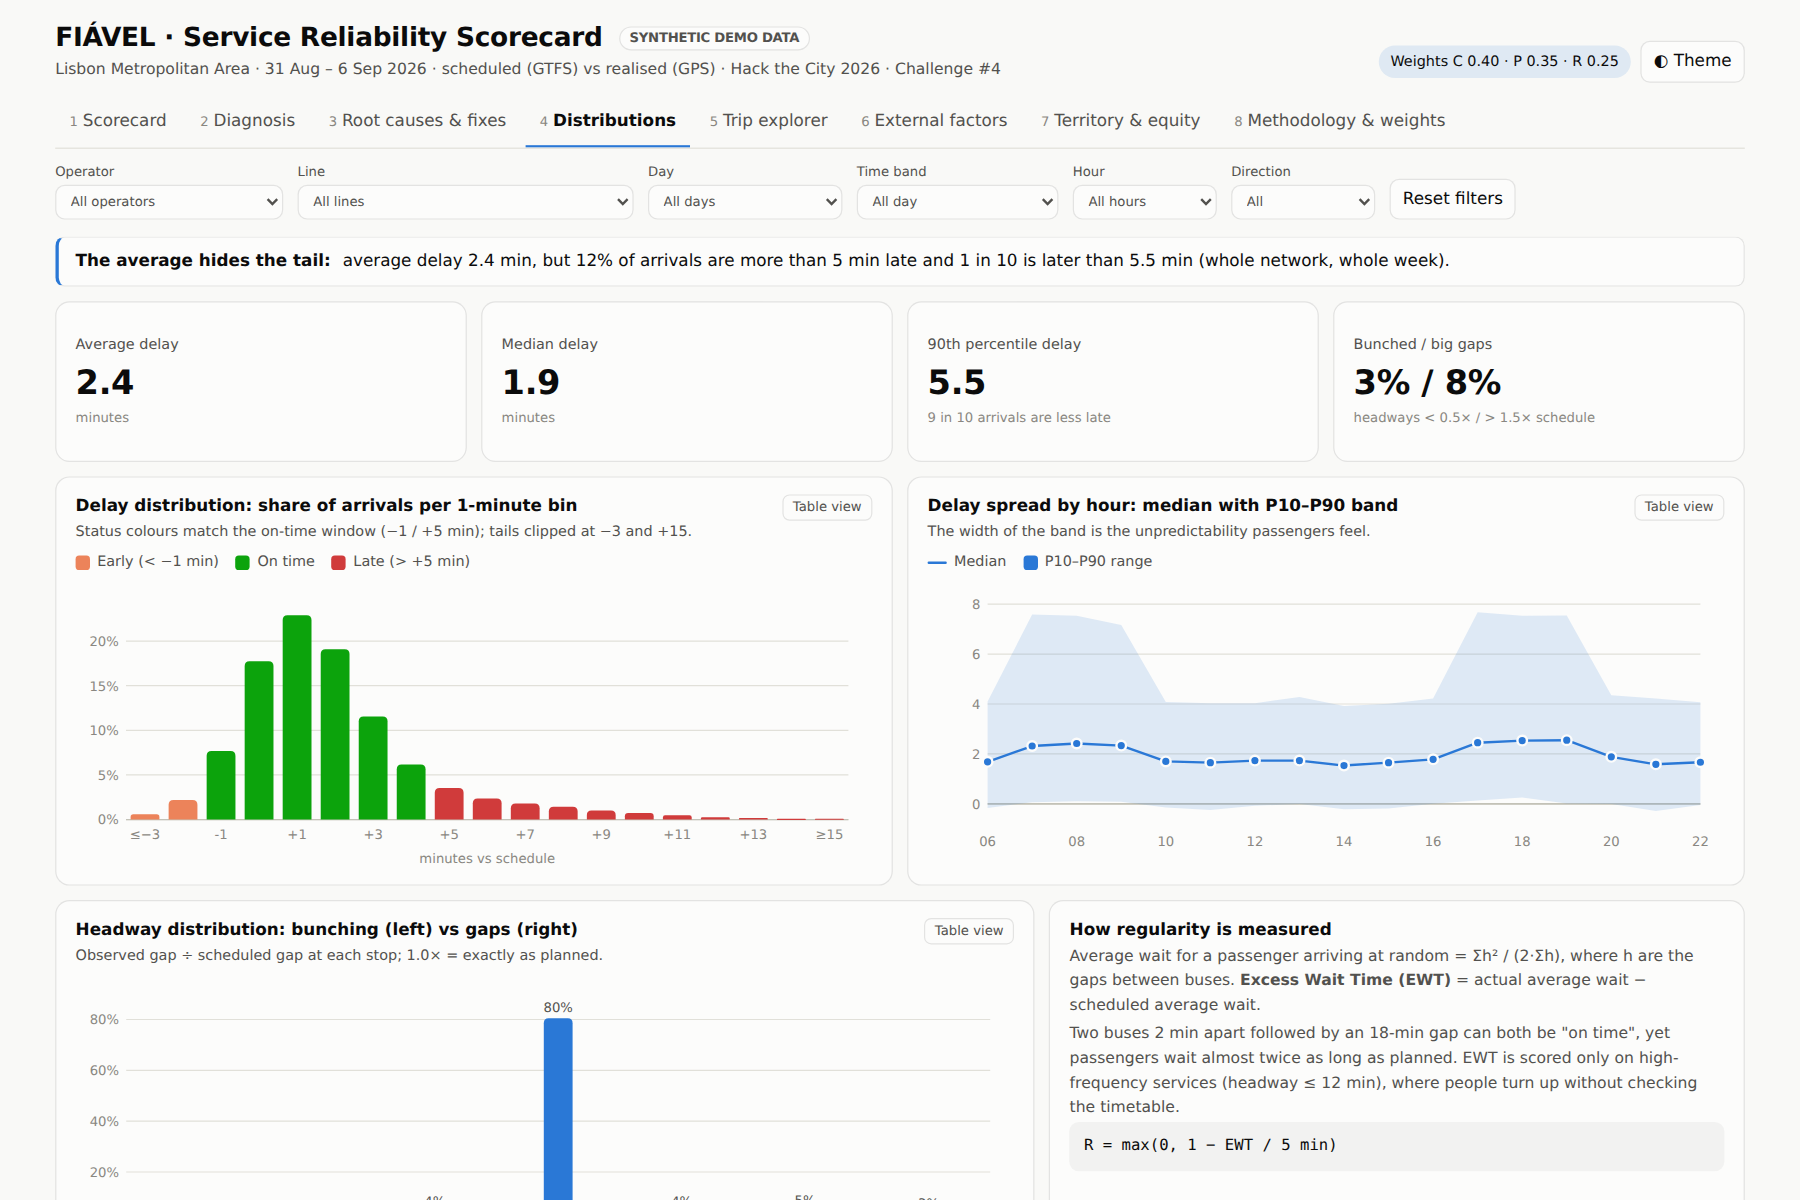
Distributions Analysis
-
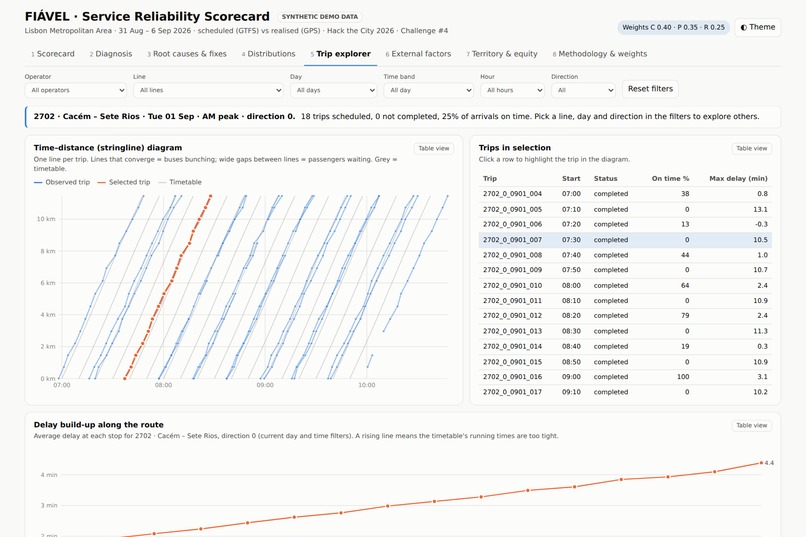
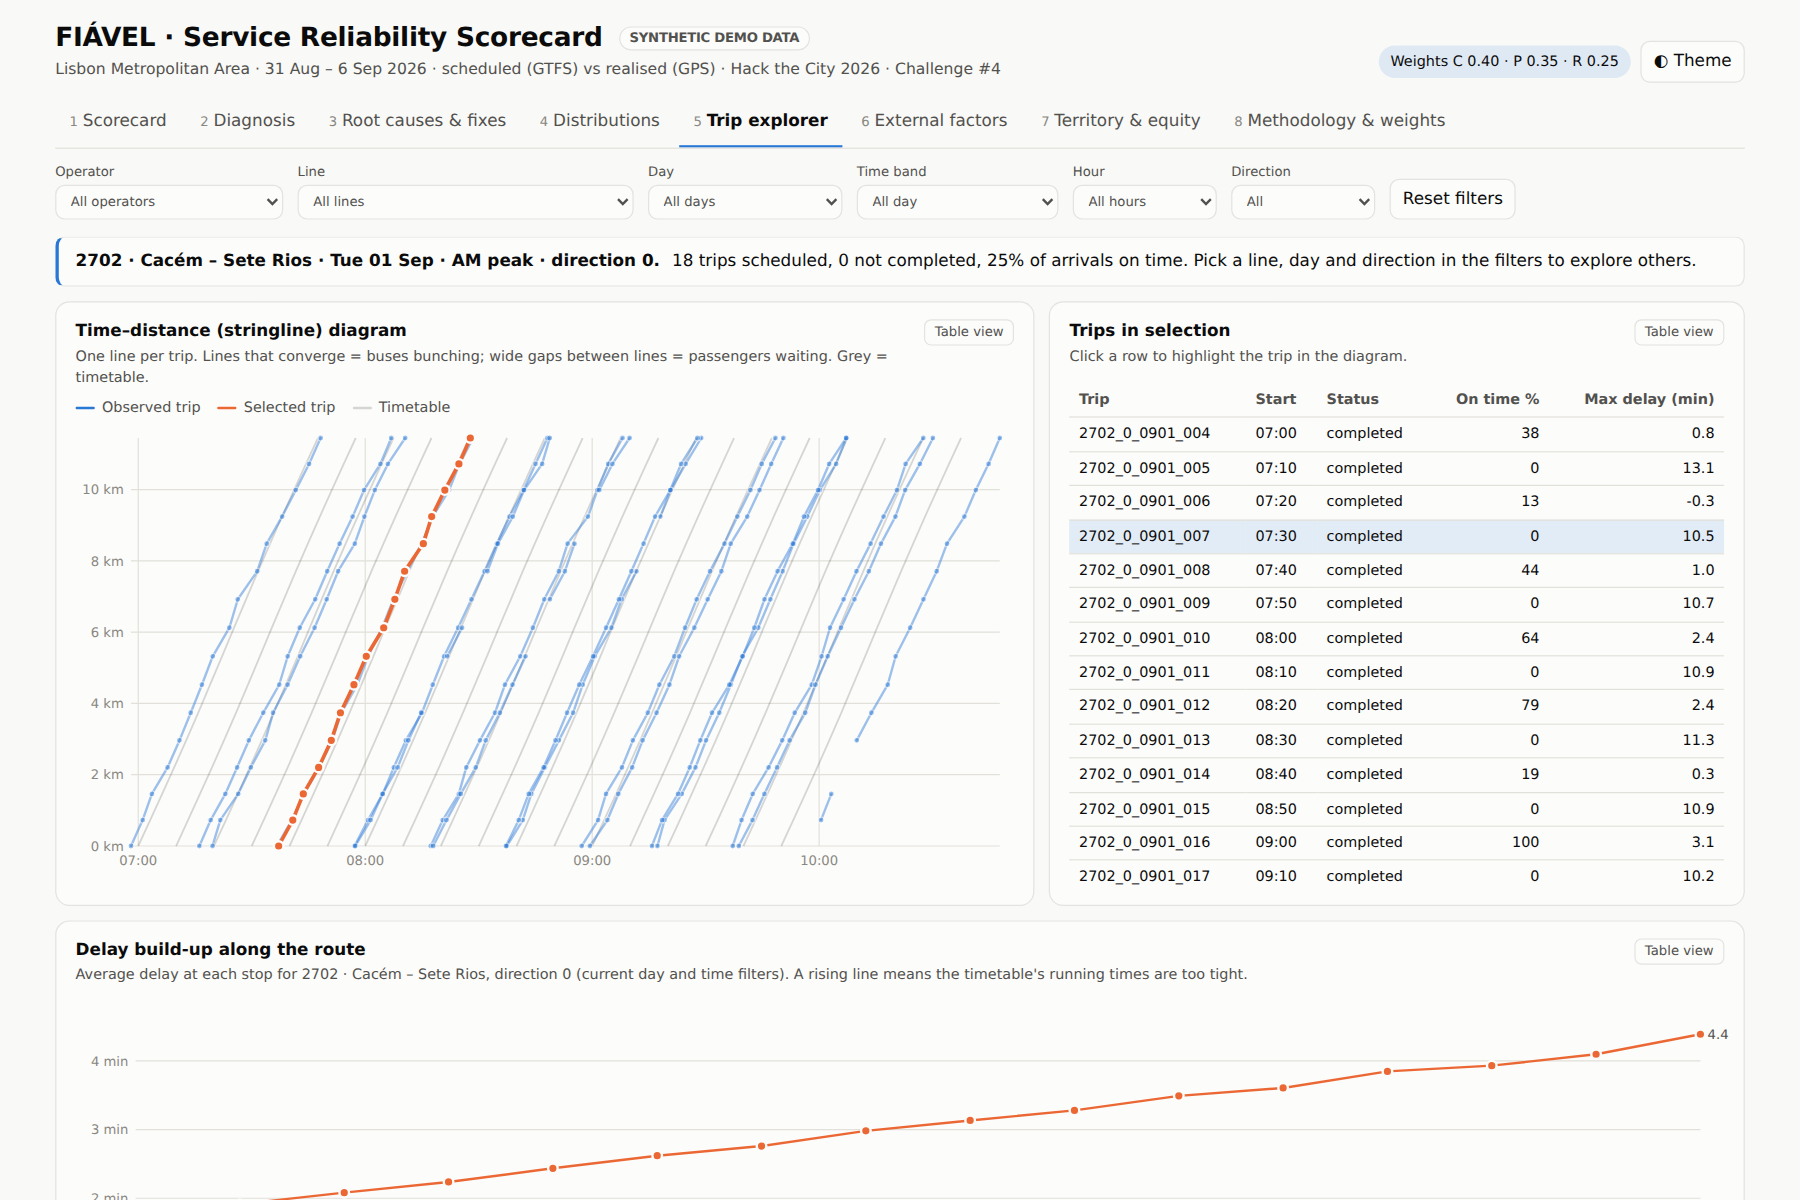
Trip explorer
-
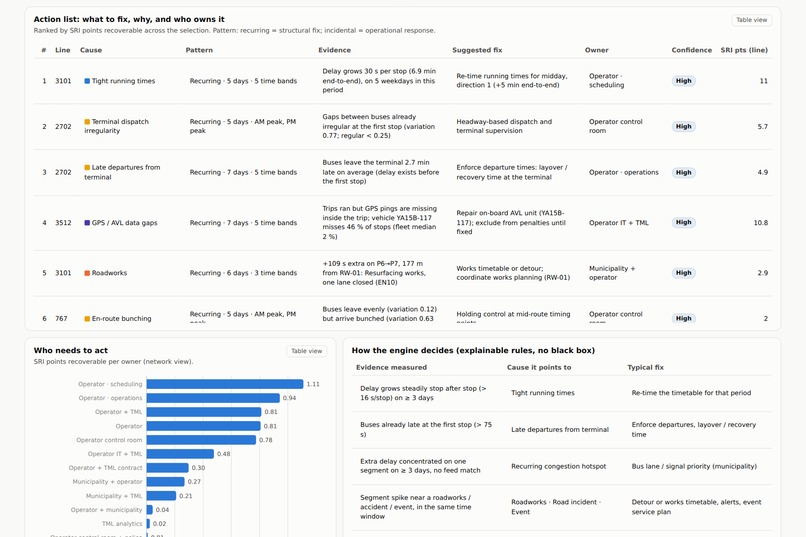
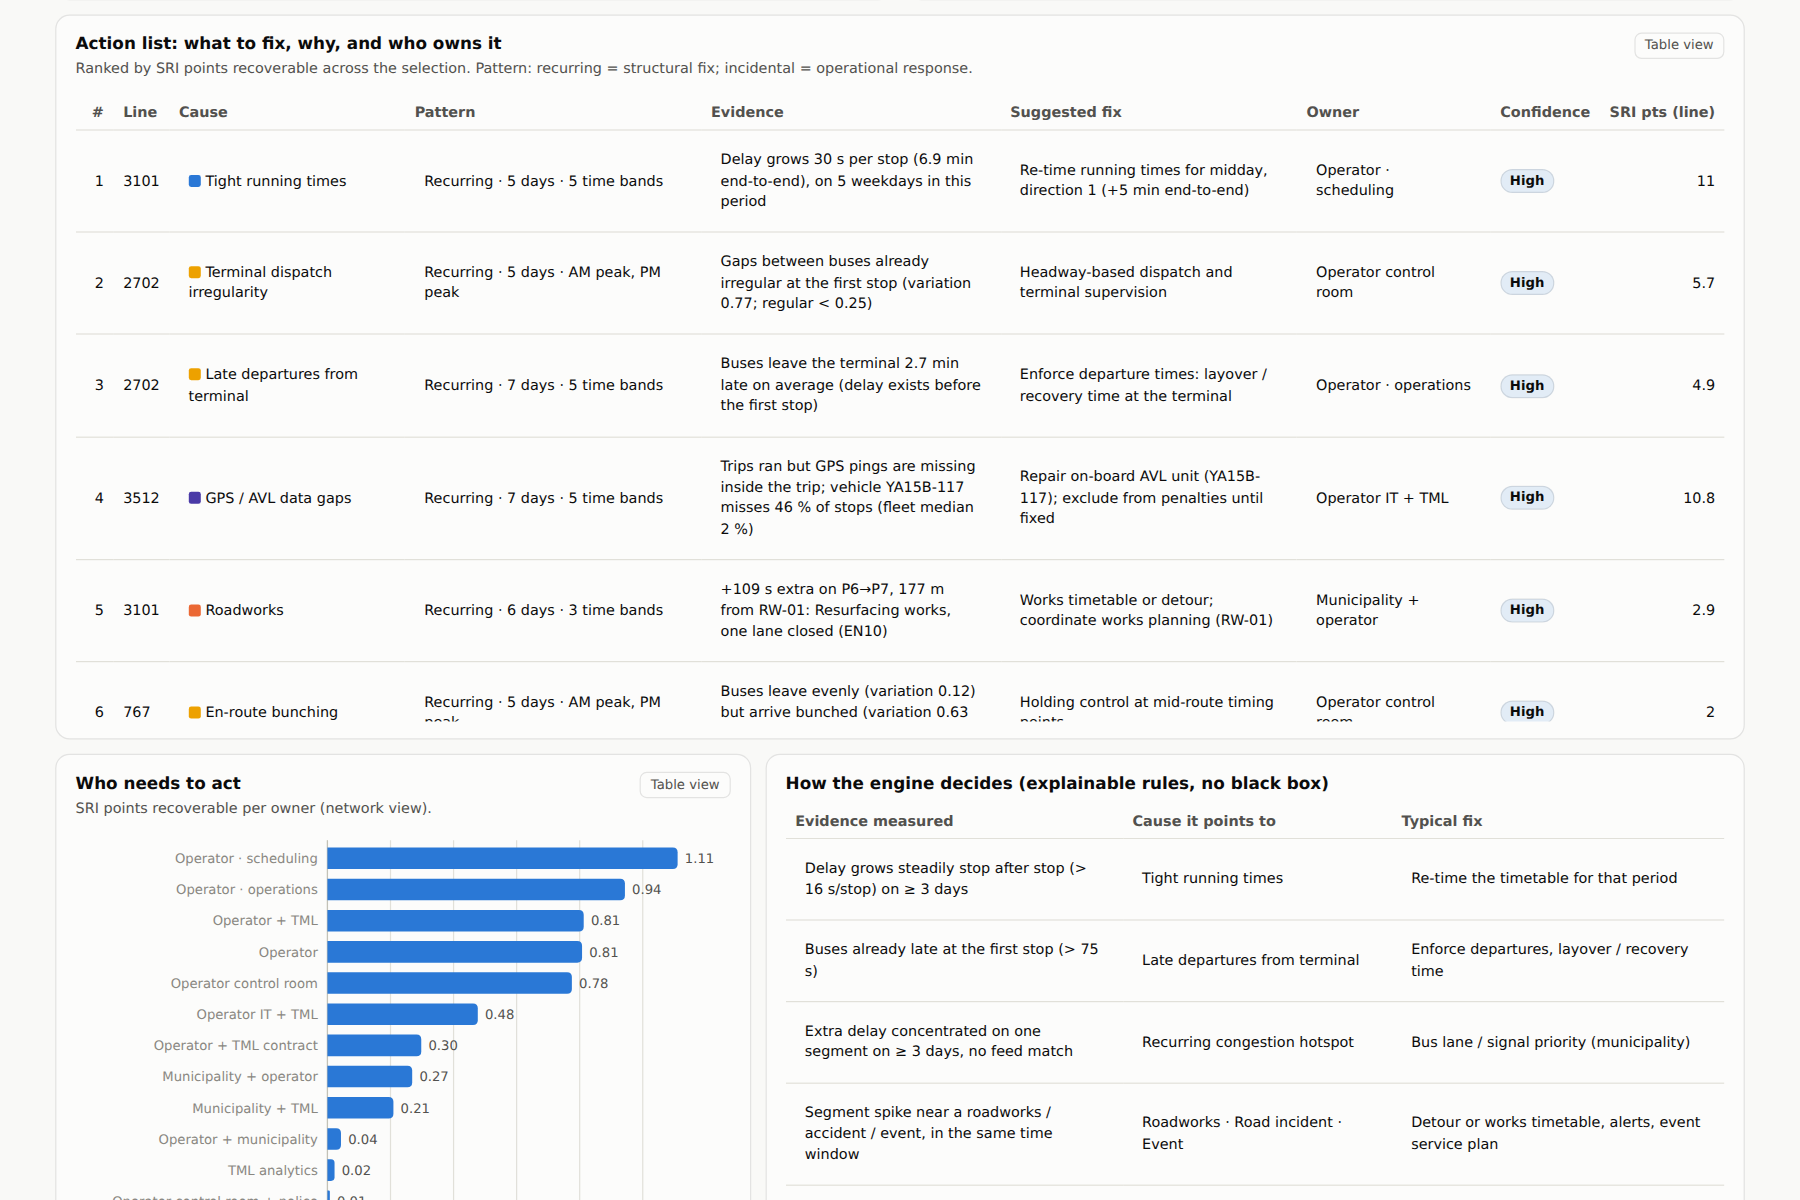
Action list: what to fix, why, and who owns it
-
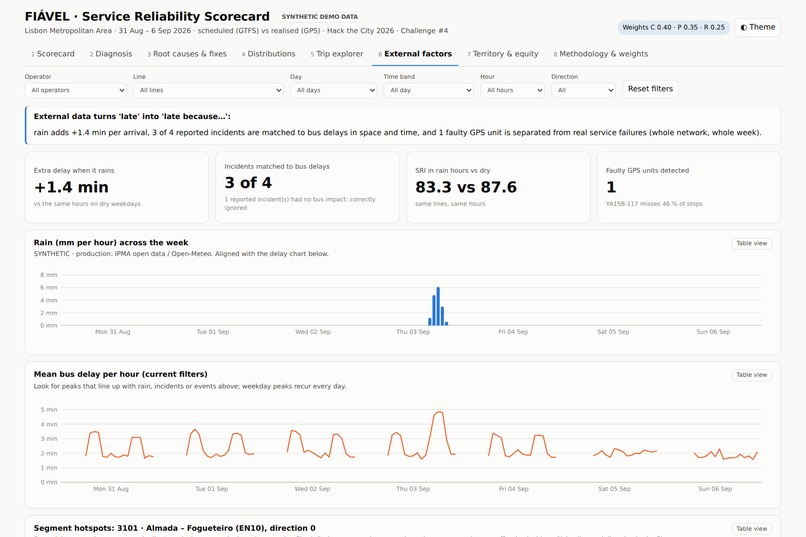
External factors 1
-
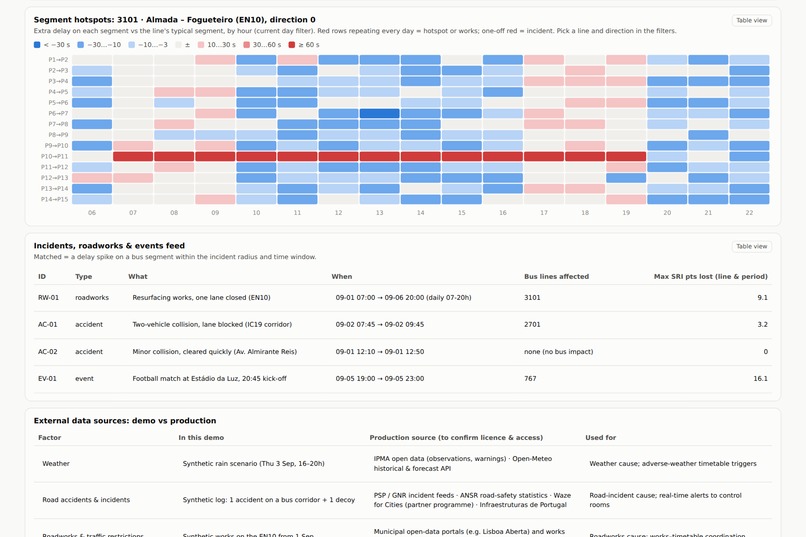
External factors 2
-
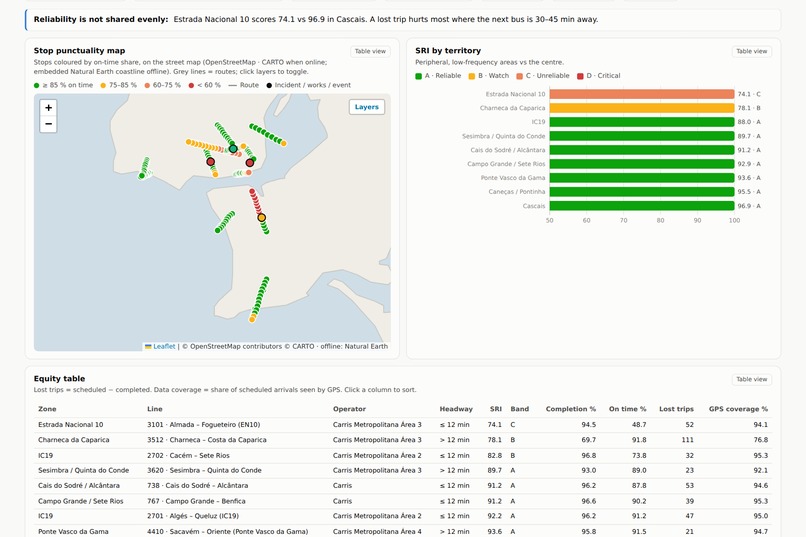
Territory & Equity
-
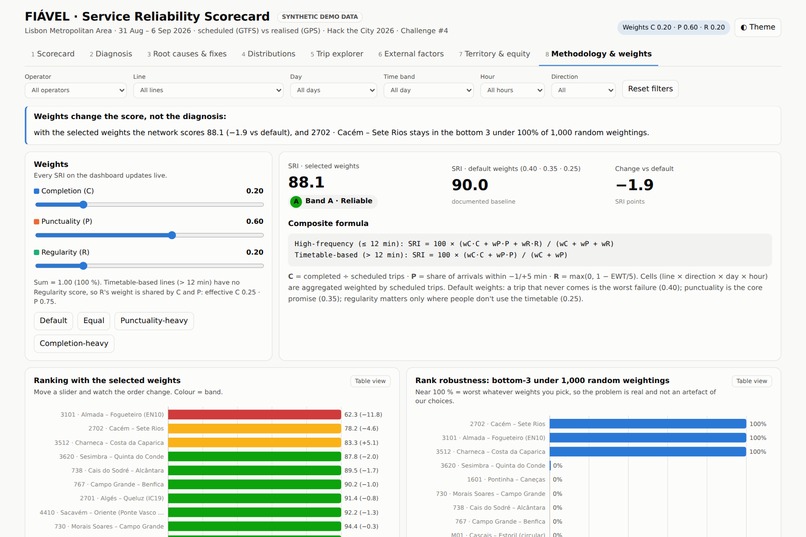
Methodology & weights
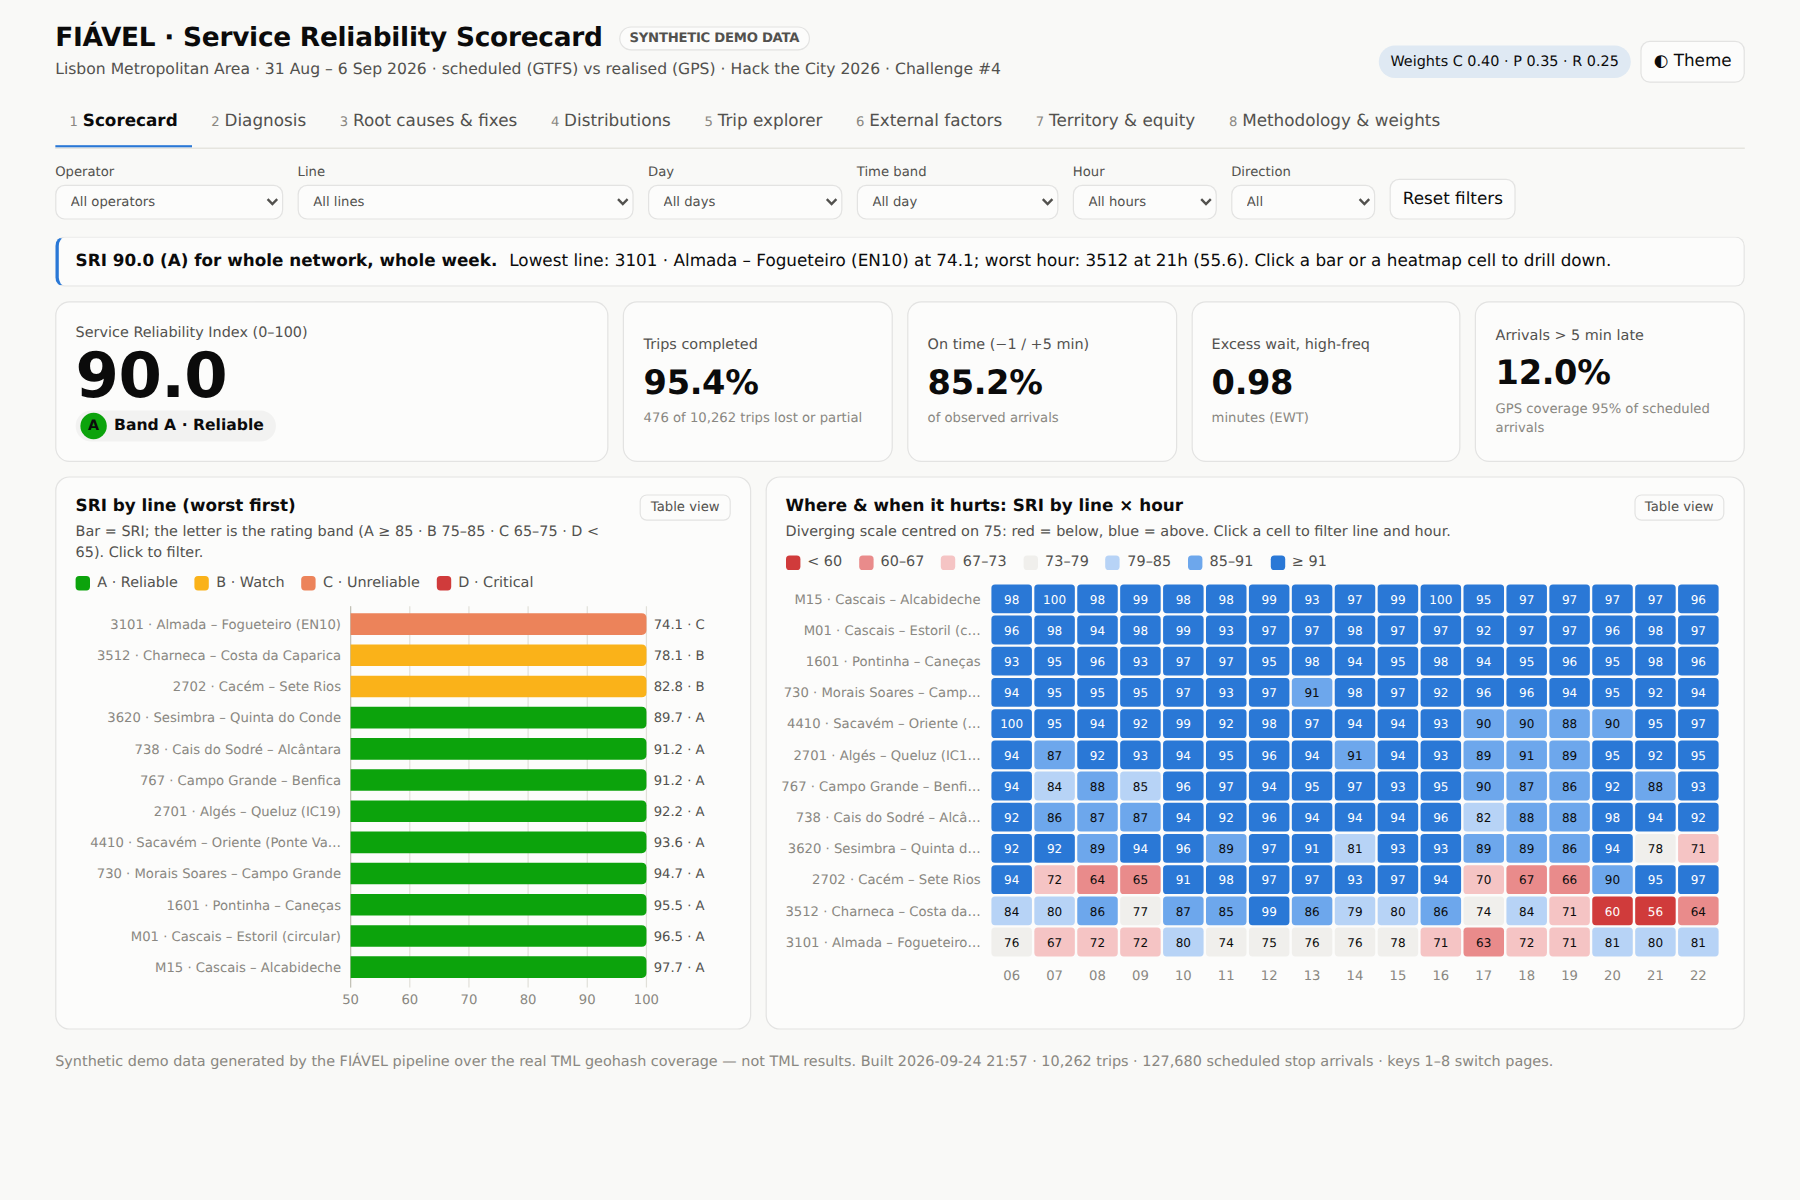
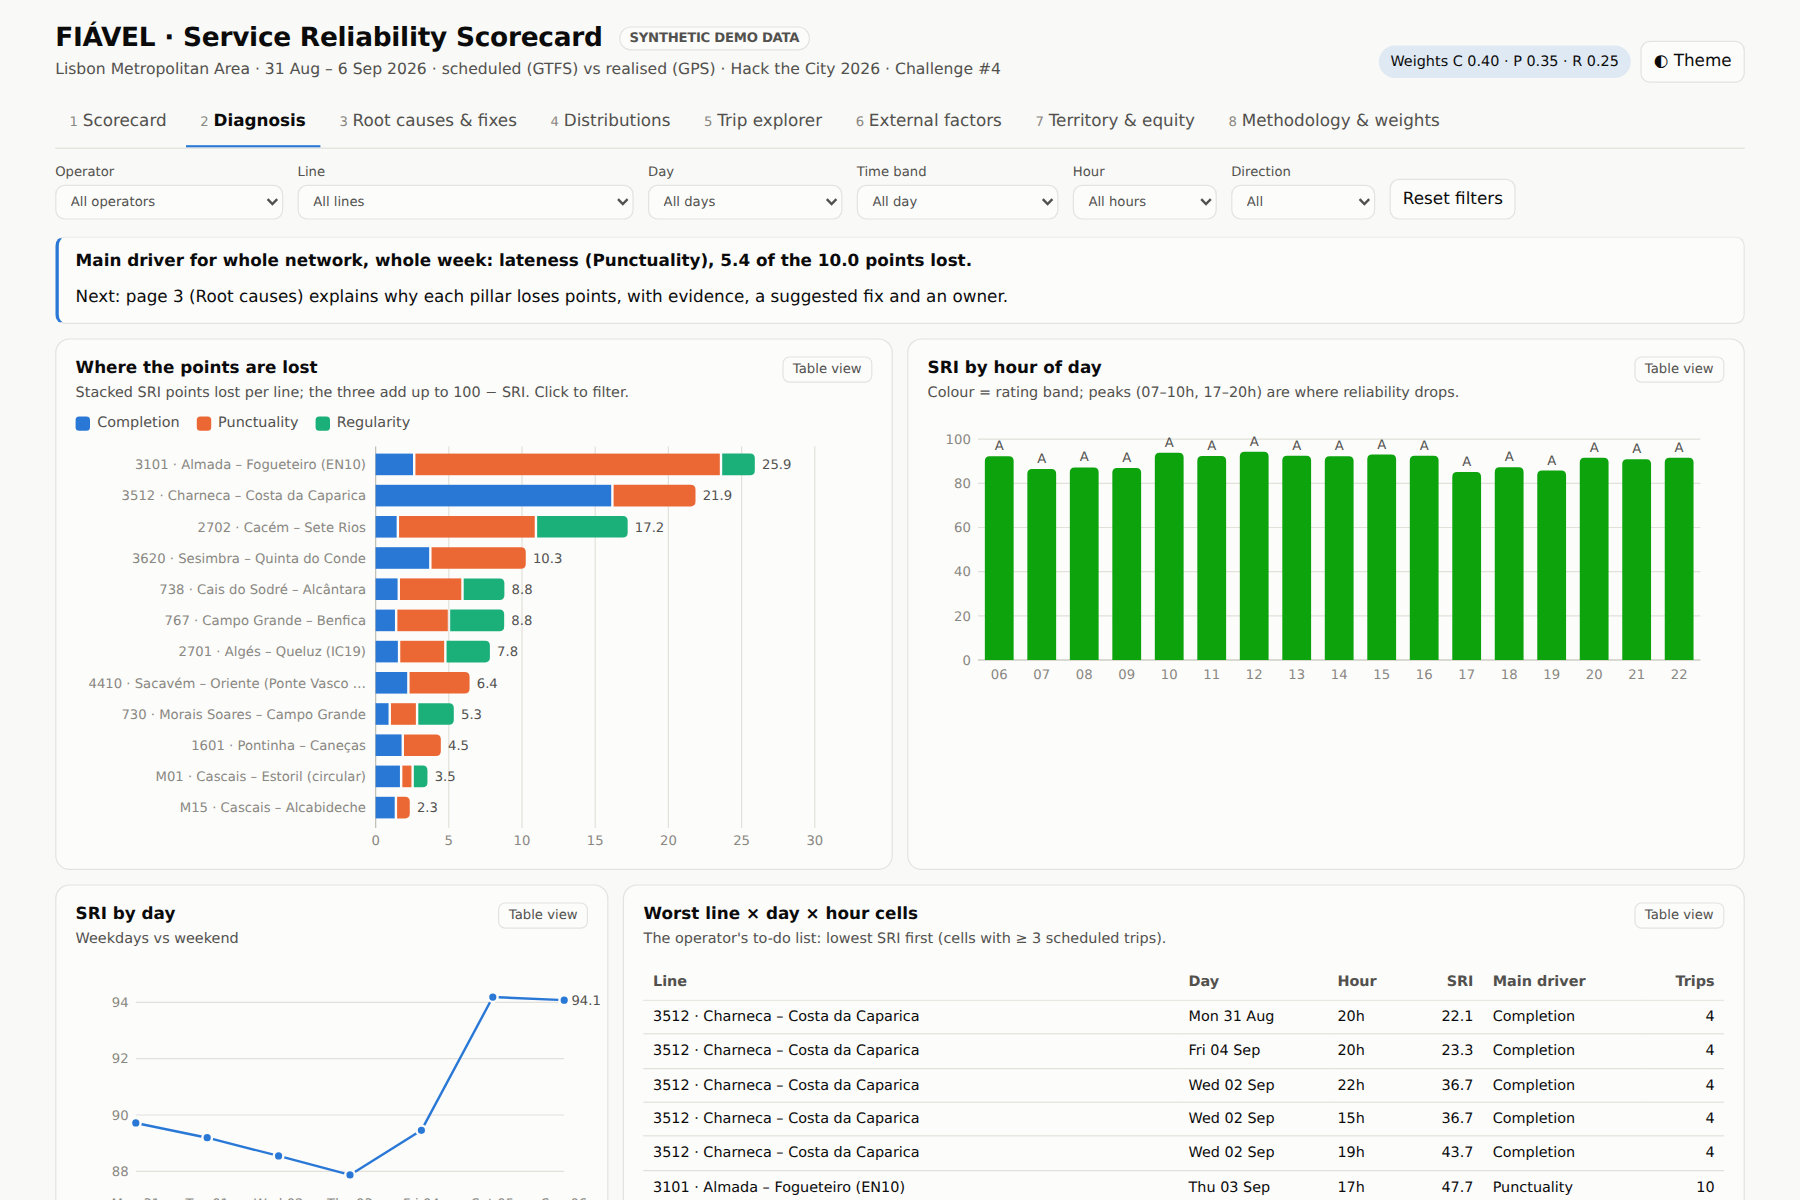
Inspiration
Every commuter in Lisbon knows the feeling: the app says the bus is "on time", yet you wait 18 minutes and then two arrive together. When we opened TML's data for the Hack the City challenge, we saw the same gap from the other side. Transport authorities judge service on averages, and averages hide the pain. In our prototype week the network's average delay was only 2.4 minutes, but 12 % of arrivals were more than 5 minutes late.
We also noticed a second, subtler problem: knowing that a line is late doesn't tell you why, or who should fix it. A timetable that is too tight, roadworks, rain, a football match, a bus leaving the terminal late and a broken GPS unit all look the same in a KPI, but each needs a different fix from a different owner. That became our mission: build a scorecard that measures reliability and explains it.
What it does
FIÁVEL compares the promise (the GTFS operation plan) with reality (vehicle GPS every ~20 s) and produces:
- A Service Reliability Index (SRI, 0–100) built from three pillars: Completion, Punctuality and Regularity.
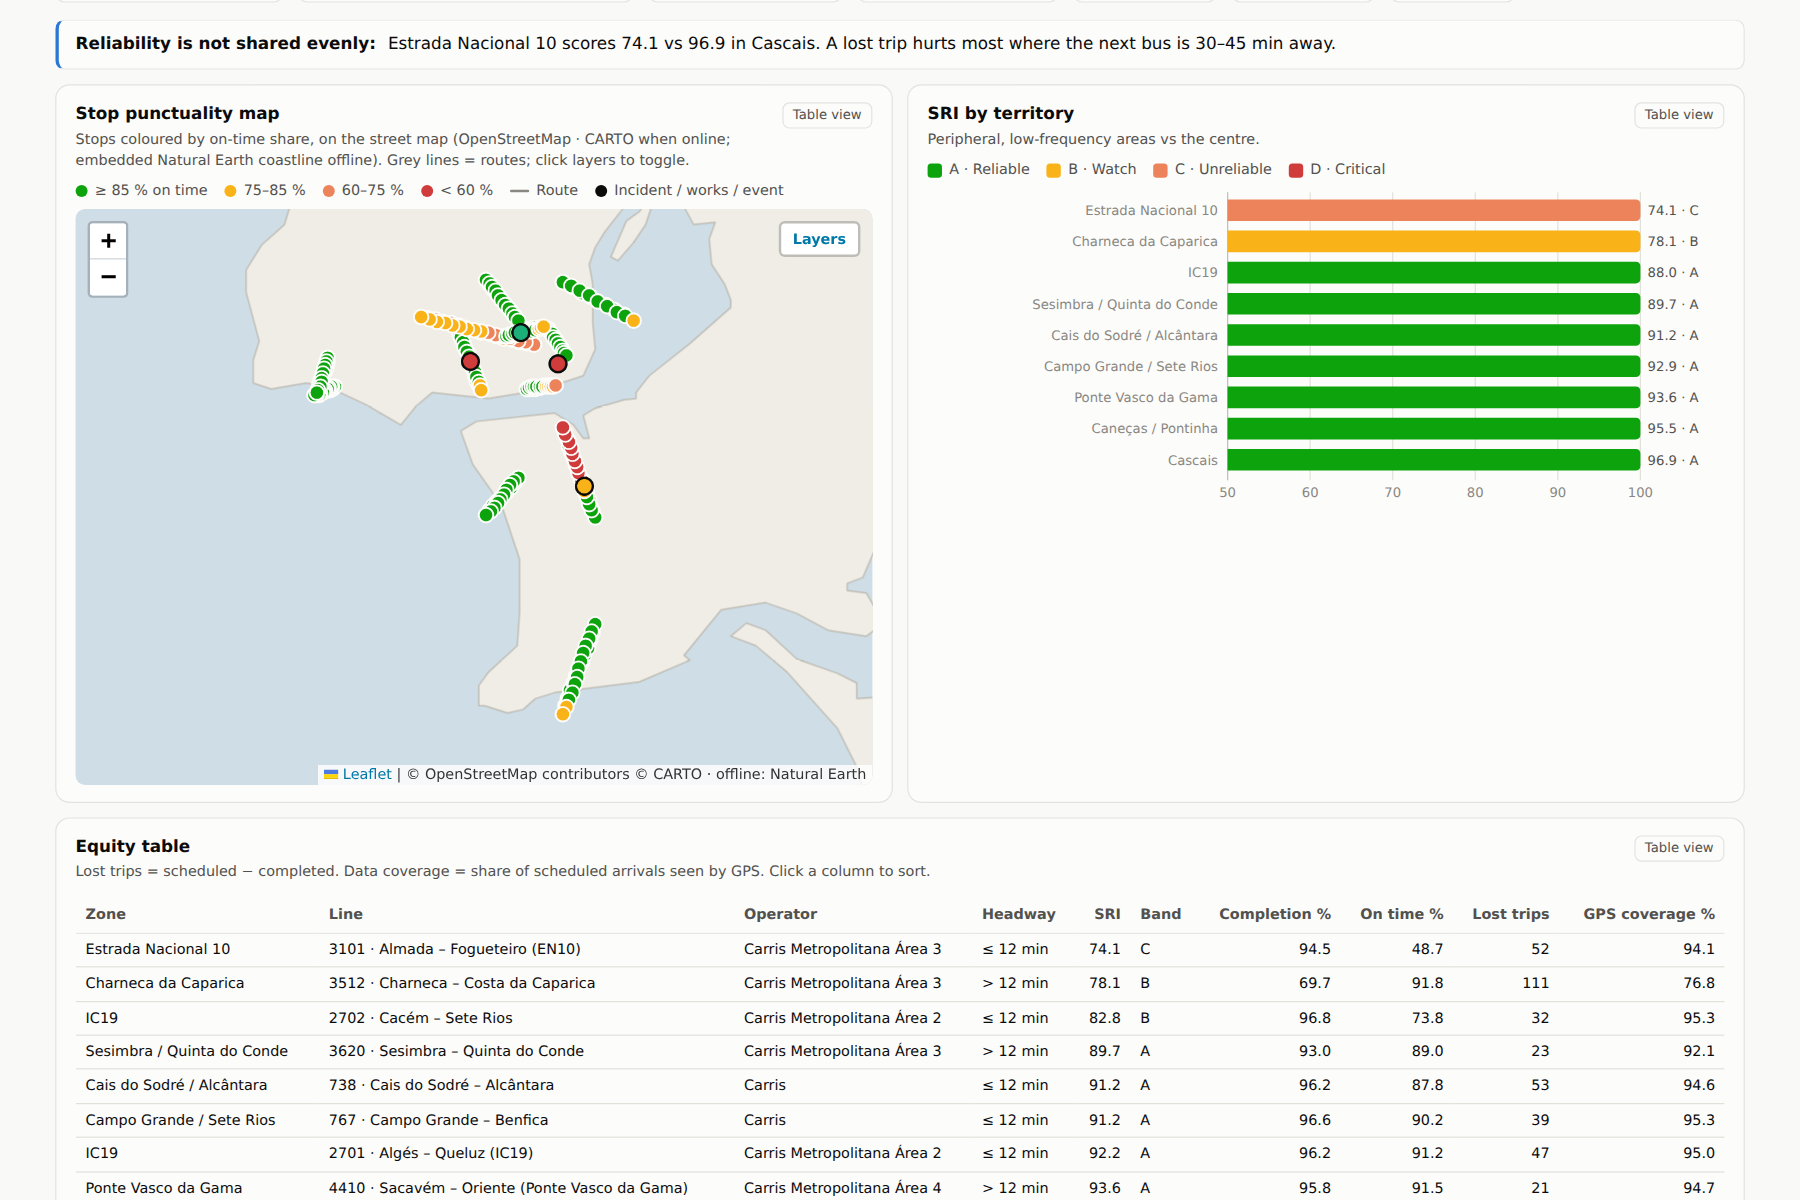
- Drill-downs from the network to operator, line, day, hour, trip, stop and road segment.
- Distribution views: delay histograms, P10–P90 bands, headway distributions and stringline diagrams that make bus bunching visible.
- An explainable root-cause engine that assigns every lost SRI point to a cause (14 causes in 7 families), with the evidence, a suggested fix, the owner and a confidence level.
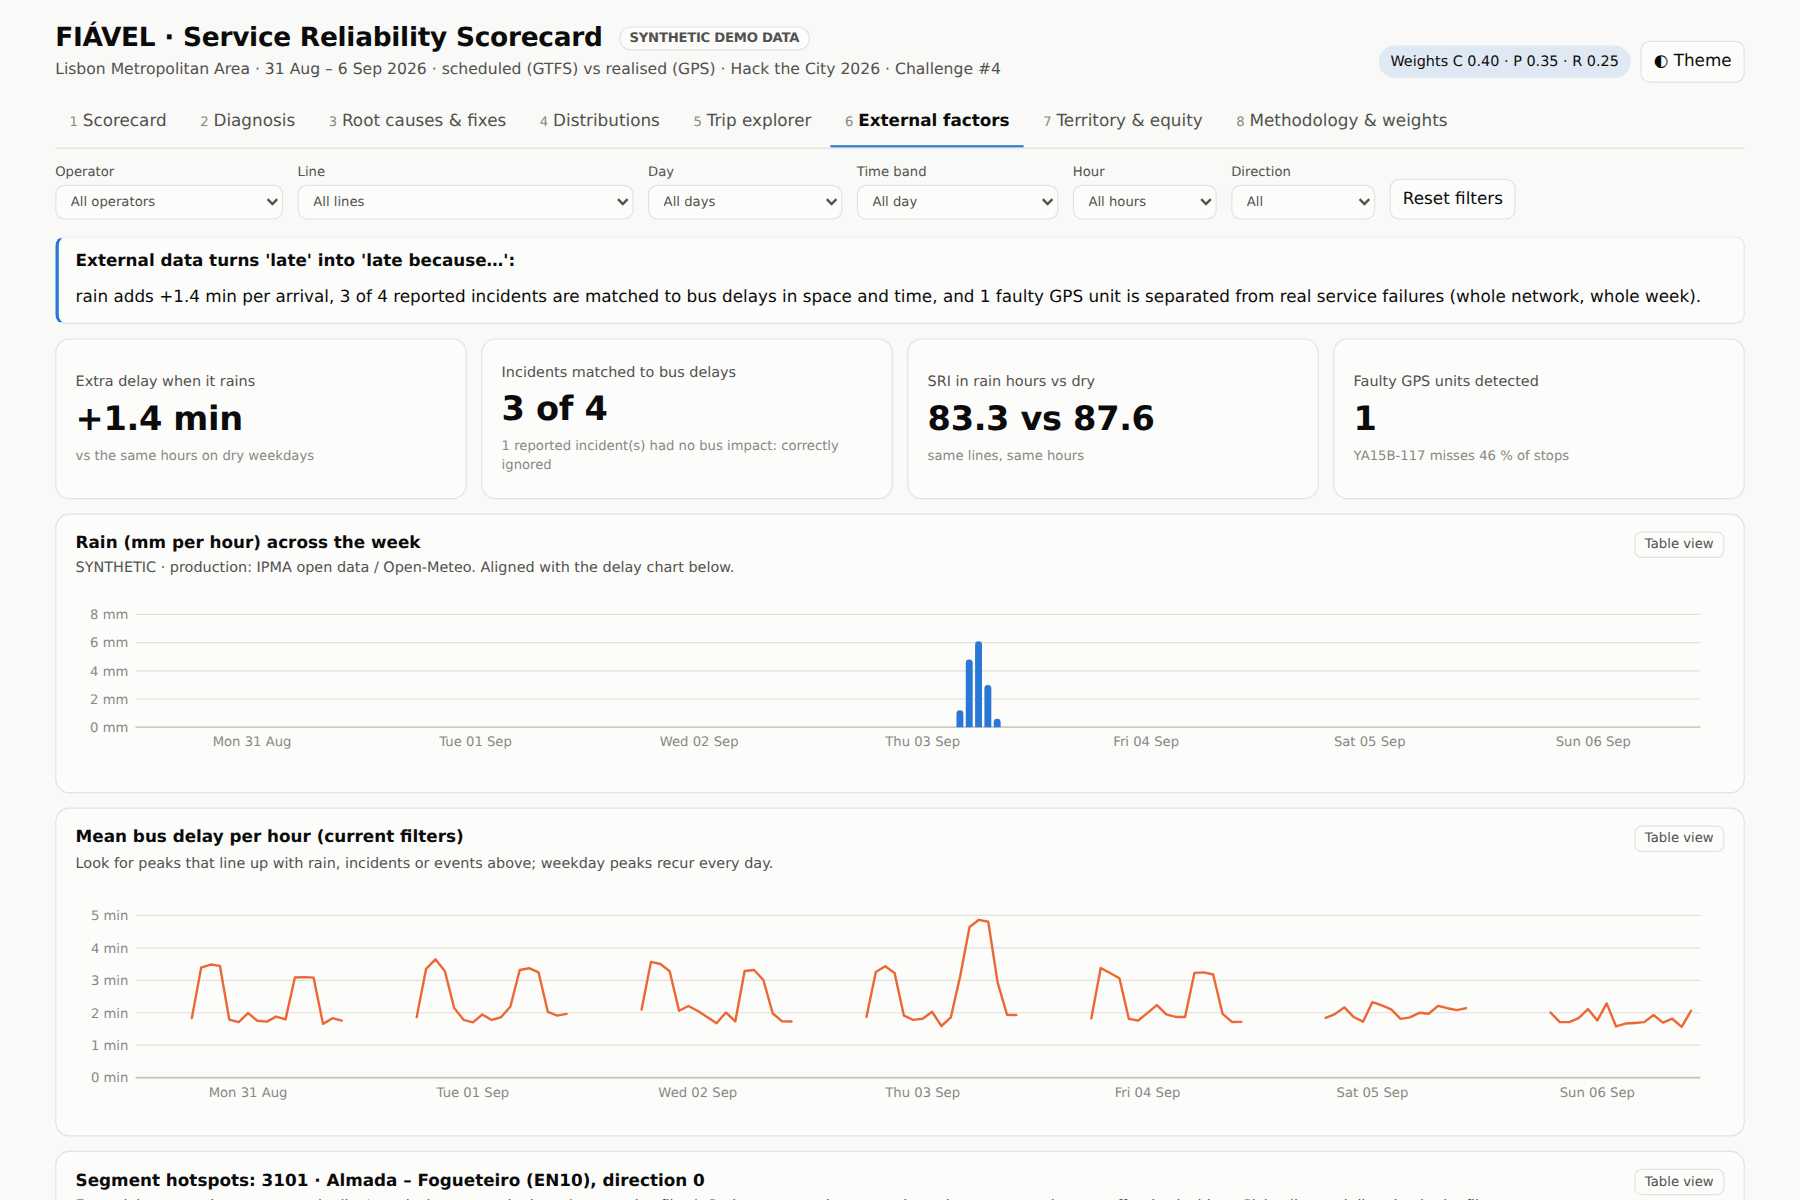
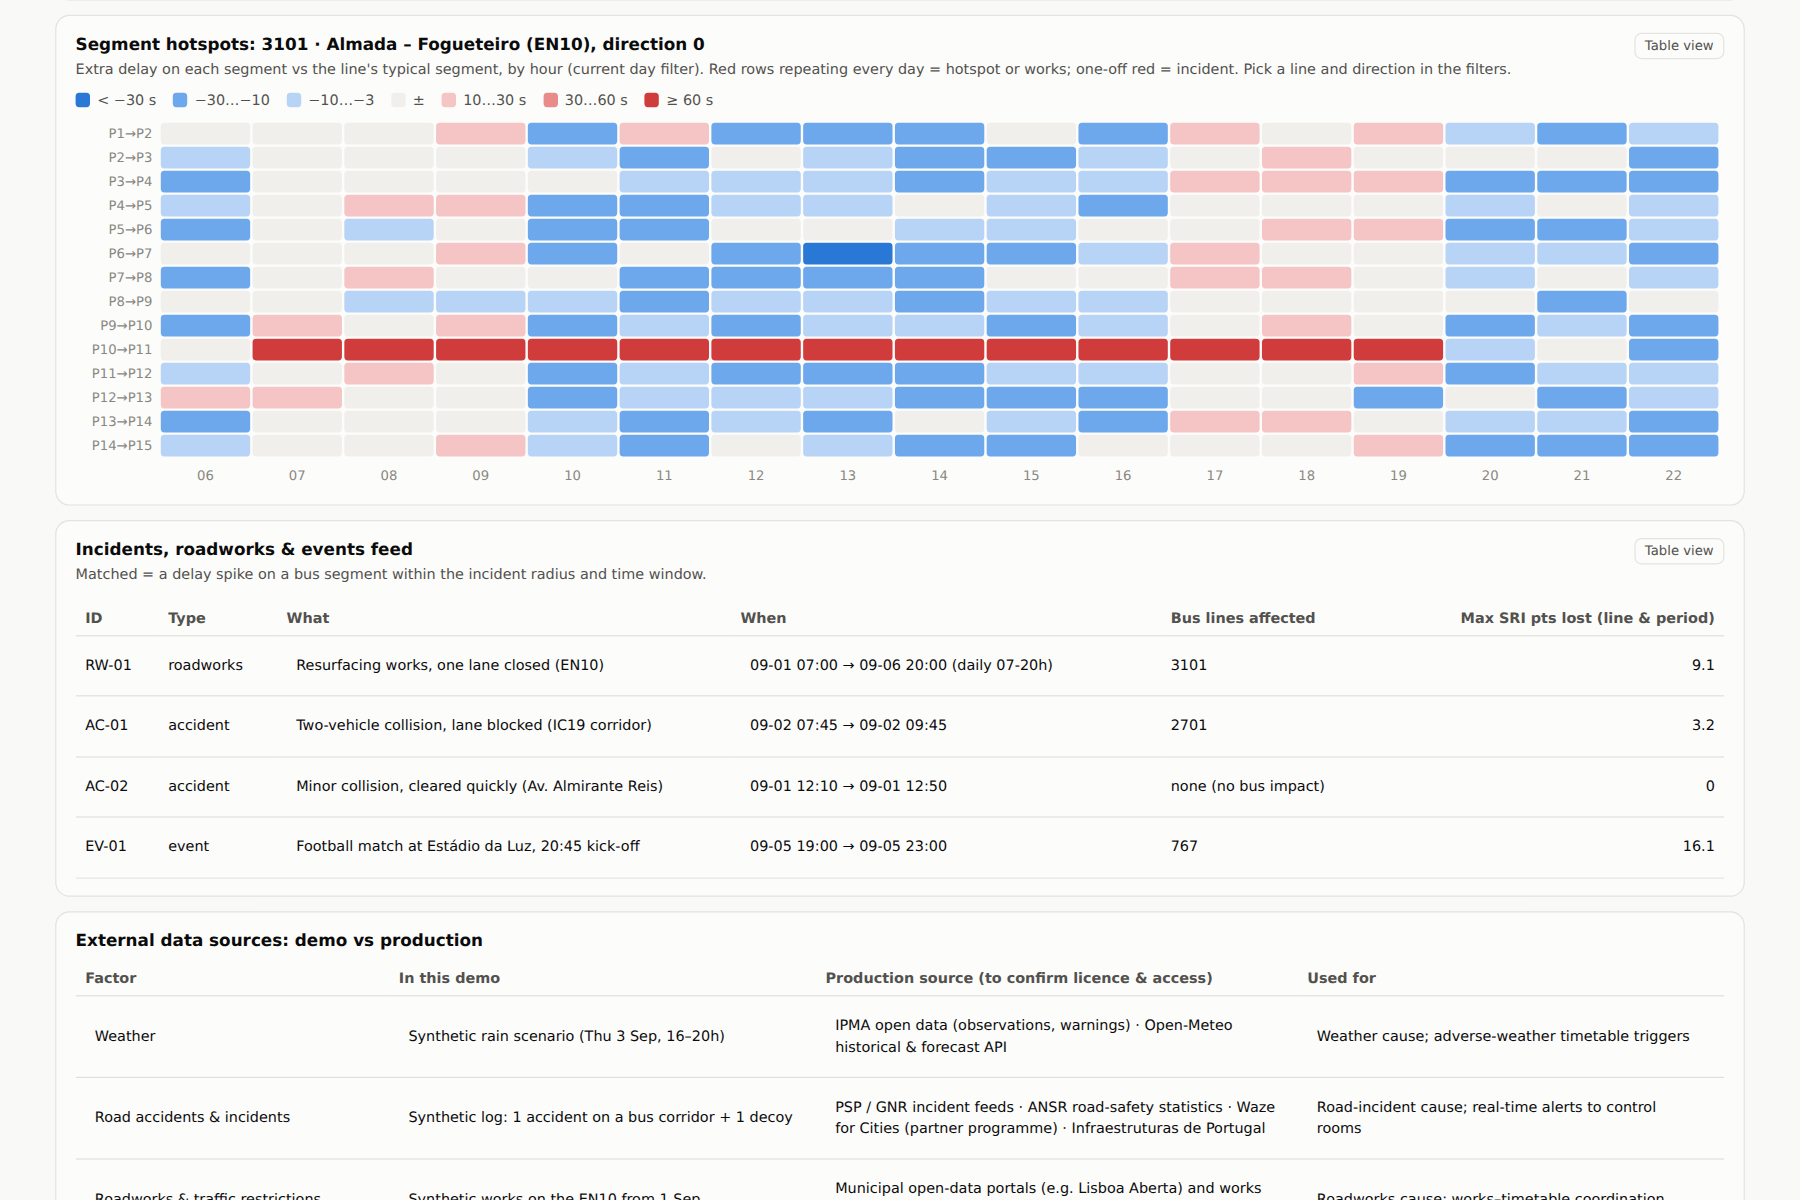
- An external-factors layer (weather, road incidents, roadworks, events) that separates what the operator controls from what it doesn't.
How we built it
Data. We used TML's Operation Plans (normalised GTFS per operator and validity period), the vehicle GPS events and the validation metadata. We joined each GPS event to the plan in force using agency_id and the plan's validity dates, and handled the traps along the way:
- the operational day runs from 04:00 to 03:59;
- GTFS times can exceed 24:00;
- GTFS download links expire after about 30 minutes;
- GPS only covers 23 geohash cells, so we score only the stops inside that coverage. Arrival detection. A scheduled stop counts as served when the closest GPS ping is within 40 m. Delay is the observed time minus the scheduled time.
The index. A trip is completed when at least 70 % of its in-coverage stops are observed. Punctuality is the share of arrivals within −1/+5 minutes. Regularity uses Excess Wait Time, the passenger-perspective measure used in London's bus contracts. For headways $h_i$, the average wait of a passenger arriving at random is
$$ AW = \frac{\sum_i h_i^2}{2\sum_i h_i}, \qquad EWT = AW_{\text{actual}} - AW_{\text{scheduled}}, \qquad R = \max\left(0,\ 1 - \frac{EWT}{5\ \text{min}}\right) $$
The composite index uses normalised weights. For high-frequency lines (headway ≤ 12 min):
$$ SRI = 100 \cdot \frac{w_C\,C + w_P\,P + w_R\,R}{w_C + w_P + w_R} $$
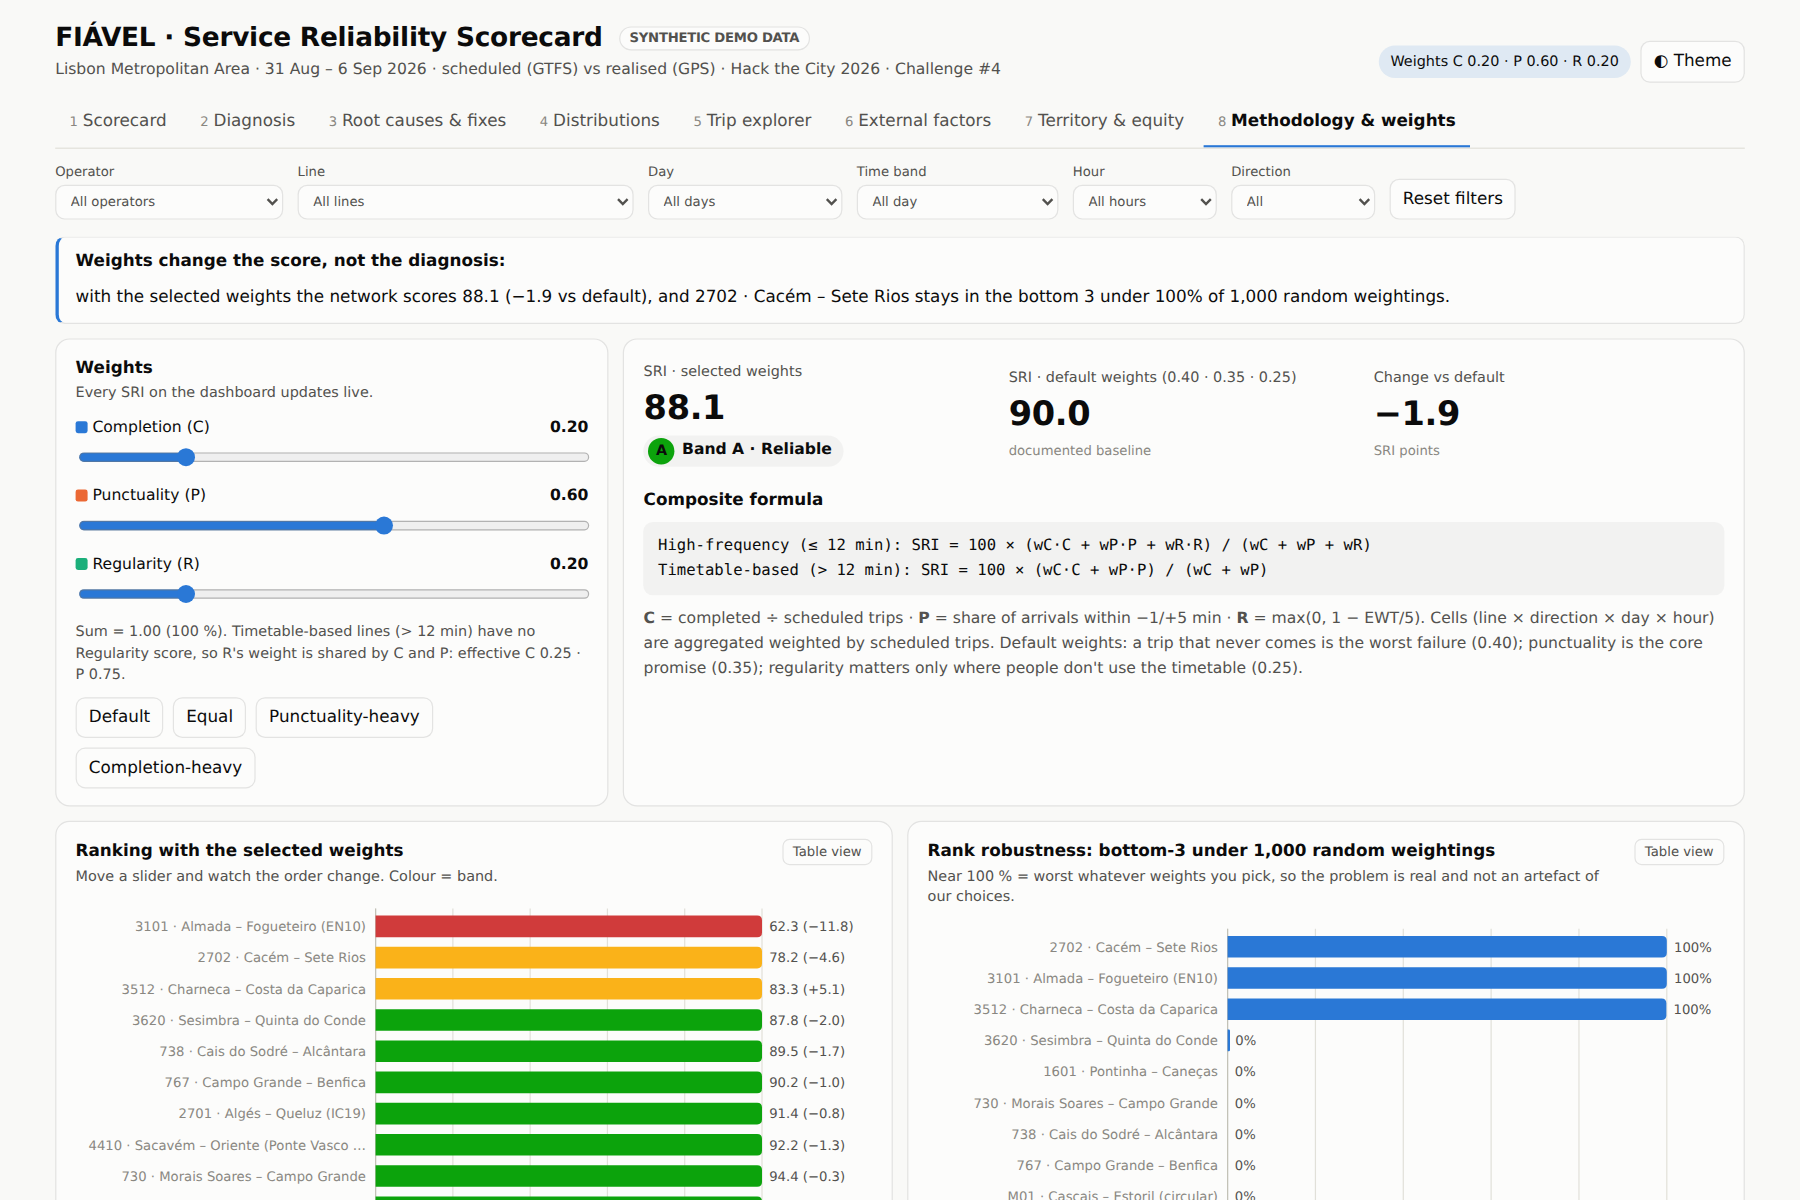
Timetable-based lines drop $R$, because their passengers follow the timetable rather than the gaps between buses. The defaults are $w_C = 0.40$, $w_P = 0.35$ and $w_R = 0.25$, since a trip that never comes is the worst failure.
Robustness. To show that our weights don't drive the conclusions, we re-rank all lines under 1,000 random weightings drawn from a Dirichlet distribution:
$$ (w_C, w_P, w_R) \sim \text{Dirichlet}(4, 4, 4) $$
The worst line stayed in the bottom three in 100 % of them.
Root-cause engine. For each line × direction × day × period, the points lost in each pillar are split among candidate causes in proportion to measured evidence:
- Punctuality:
- delay growing steadily along the route points to a tight timetable;
- a spike on one road segment points to congestion, or to roadworks, an accident or an event when it matches an external feed within the incident radius and time window;
- lateness above the dry-day baseline during rain points to weather;
- buses already late at the first stop point to late terminal departures.
- Regularity: gaps that are irregular at the first stop point to dispatch; gaps that become irregular further along the route point to en-route bunching.
- Completion: each lost trip is classified as a missing block (driver or fleet shortage), a trip that stops early (short-turn), or a trip that ran but lost GPS pings, concentrated on one vehicle (data fault). Whatever isn't explained is reported as unexplained variability, never guessed.
Stack
- Pipeline: Python and DuckDB (a week processes in about 15 s on a laptop).
- Power BI project: a TMDL semantic model with 75 DAX measures and a PBIR report, validated against Microsoft's official JSON schemas.
- HTML dashboard: a single offline file with 8 pages, hand-built SVG charts, a Leaflet map and a colour-blind-validated palette. We also designed a fully open-source big-data path: Kafka, Airflow, Iceberg, Spark with Sedona, Flink, dbt, Trino and Superset on Kubernetes.
Challenges we faced
- Ground truth. How do you prove a root-cause engine works? We generated a synthetic week on TML's real coverage and formats and injected ten known causes, plus a decoy accident far from any line. The engine recovered 11 of 11 (the driver shortage hits two lines) and correctly ignored the decoy.
- Honest attribution. Our first version blamed "terminal dispatch" for almost everything and read roadworks in one direction as a congestion hotspot. Tightening the evidence rules and spatial matching fixed both. We then chose to report 42 % of lost points as unexplained rather than stretch the model.
- Fairness. On one line, two-thirds of the "lost trips" were actually a single faulty GPS unit. Separating data faults from service failures matters if the index is ever used for contract penalties.
Tooling constraints. We had no Power BI Desktop and no live weather APIs in our build environment. That pushed us to validate the Power BI report files against Microsoft's official schemas, and to make the HTML dashboard work fully offline.
What we learned
A single number is only useful if you can drill into it and argue with it: transparency beats sophistication.
Regularity, not punctuality, is what passengers on frequent lines actually feel.
Decision support means naming an owner: operator scheduling, the control room, the municipality or IT.
Validating an algorithm against known answers is what turns a demo into a credible proof of concept.
What's next
- Pilot (3 months): Carris Metropolitana and Mobicascais on real data, with IPMA weather and municipal roadworks feeds. Success means a trip_id match rate of at least 95 % and operators confirming at least 70 % of the top-10 actions.
- Network rollout: a daily refresh, operator trip logs and a public "my line" page.
- Real time: GTFS-RT streaming for live bunching and incident alerts.
- Contracts: the SRI as a contract KPI, with external causes excluded. > Reliability is a promise. FIÁVEL measures whether we keep it, and tells us exactly what to fix when we don't.
All figures come from a synthetic prototype week built on TML's real data formats; they are not TML results.
Built With
- css3
- dax
- duckdb
- gtfs
- html5
- javascript
- leaflet.js
- node.js
- numpy
- openstreetmap
- pandas
- parquet
- power-bi
- power-query
- python
- svg
- tmdl

Log in or sign up for Devpost to join the conversation.