-
-
Civitar: the public record on U.S. data centers that are free, neutral, and cited.
-
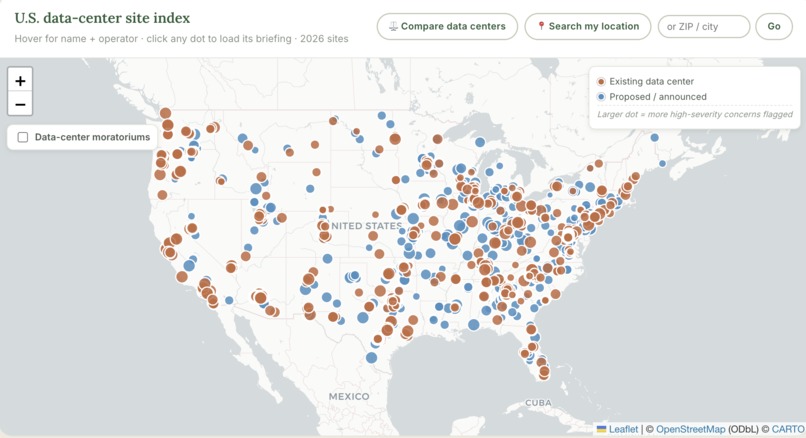
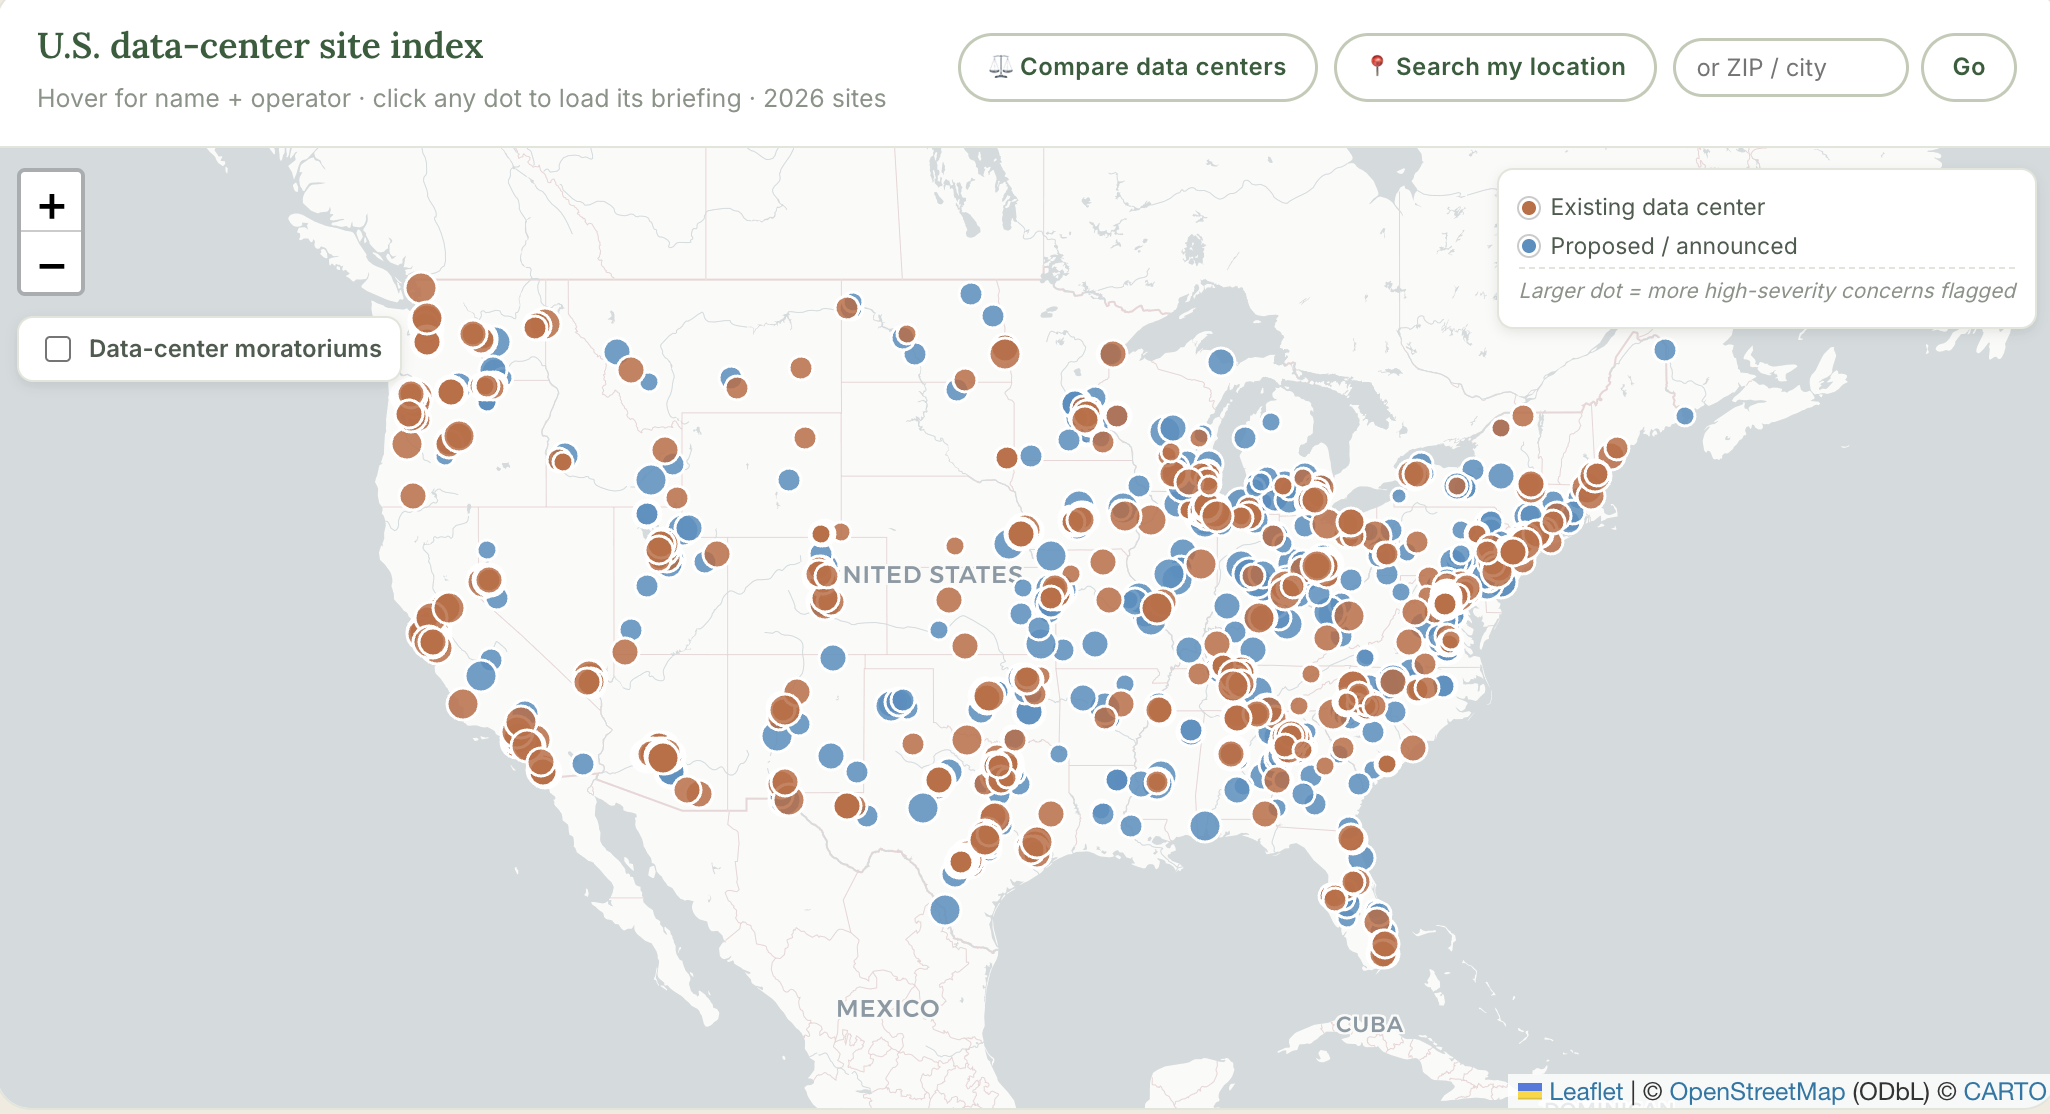
2,027 existing and proposed U.S. data centers mapped . Larger dots flag more high-severity concerns. Click any dot to open its briefing.
-
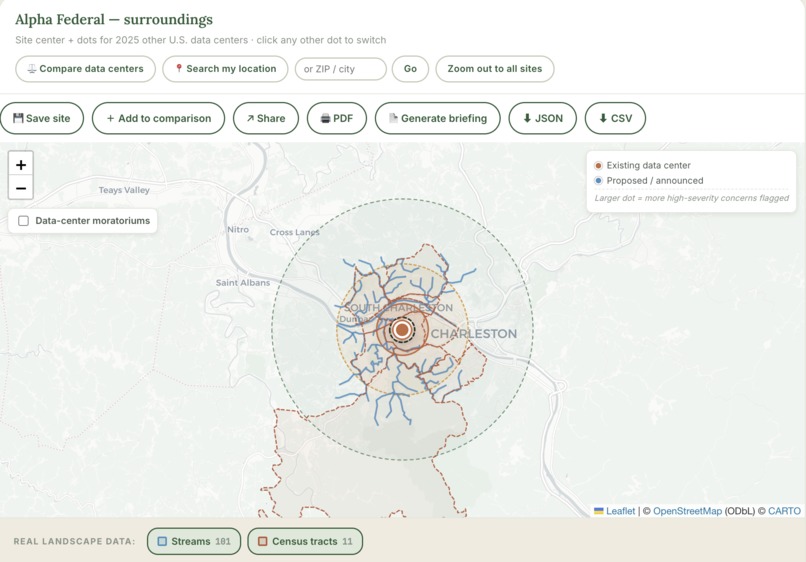
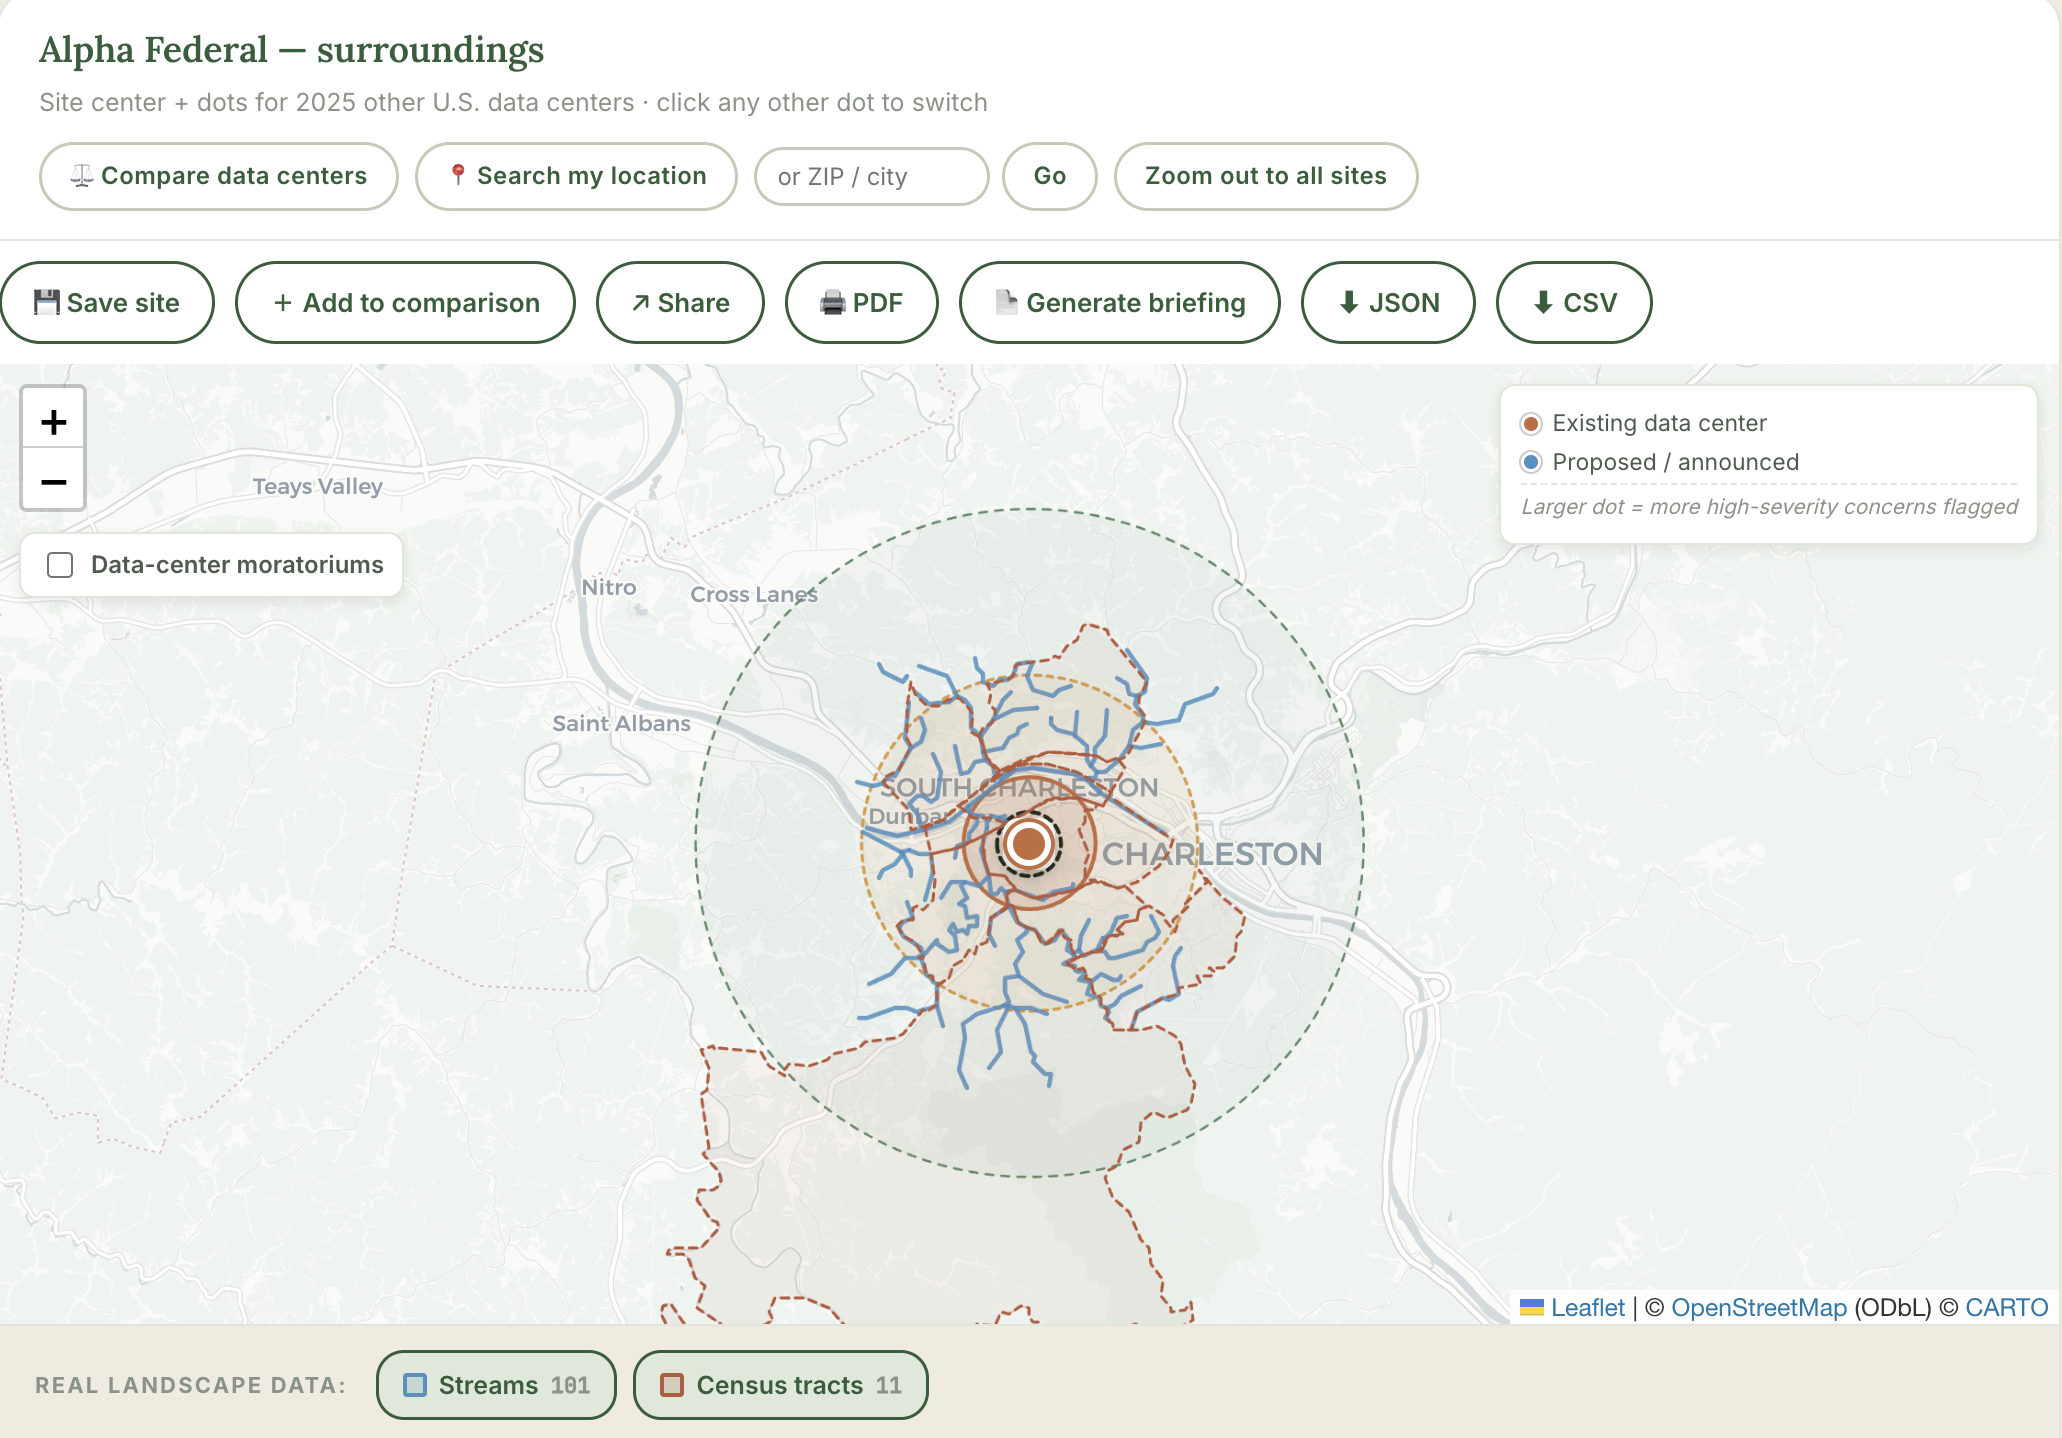
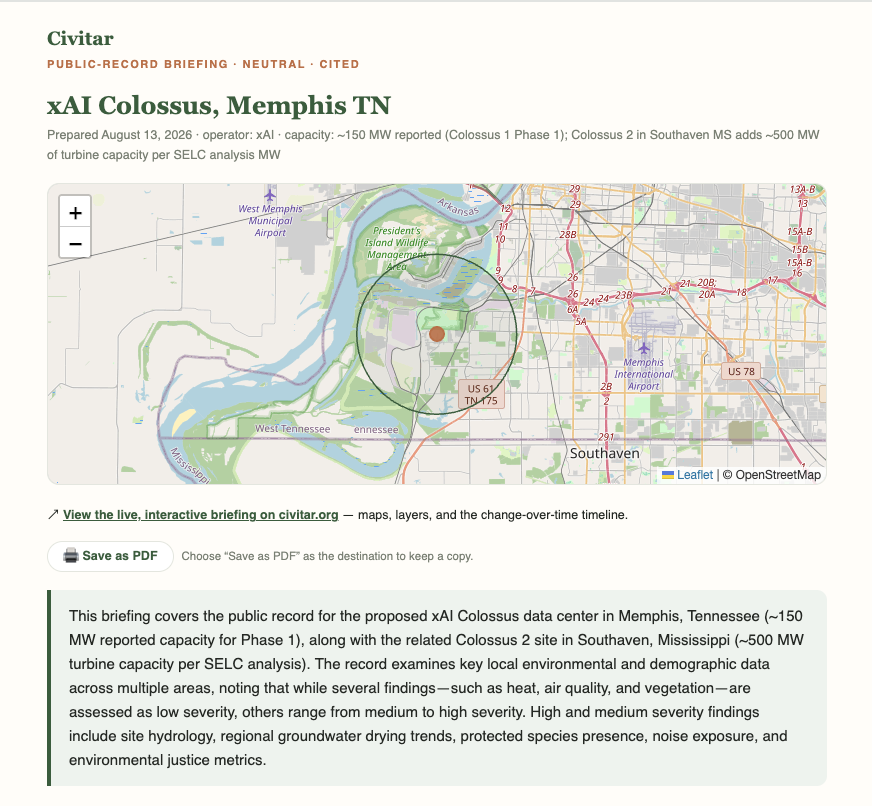
A site page: real landscape data in the impact buffer: 101 streams, 11 census tracts, ability to save, share, and export briefings.
-
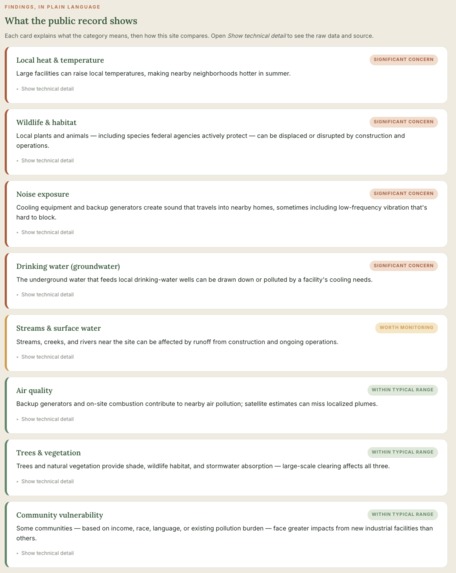
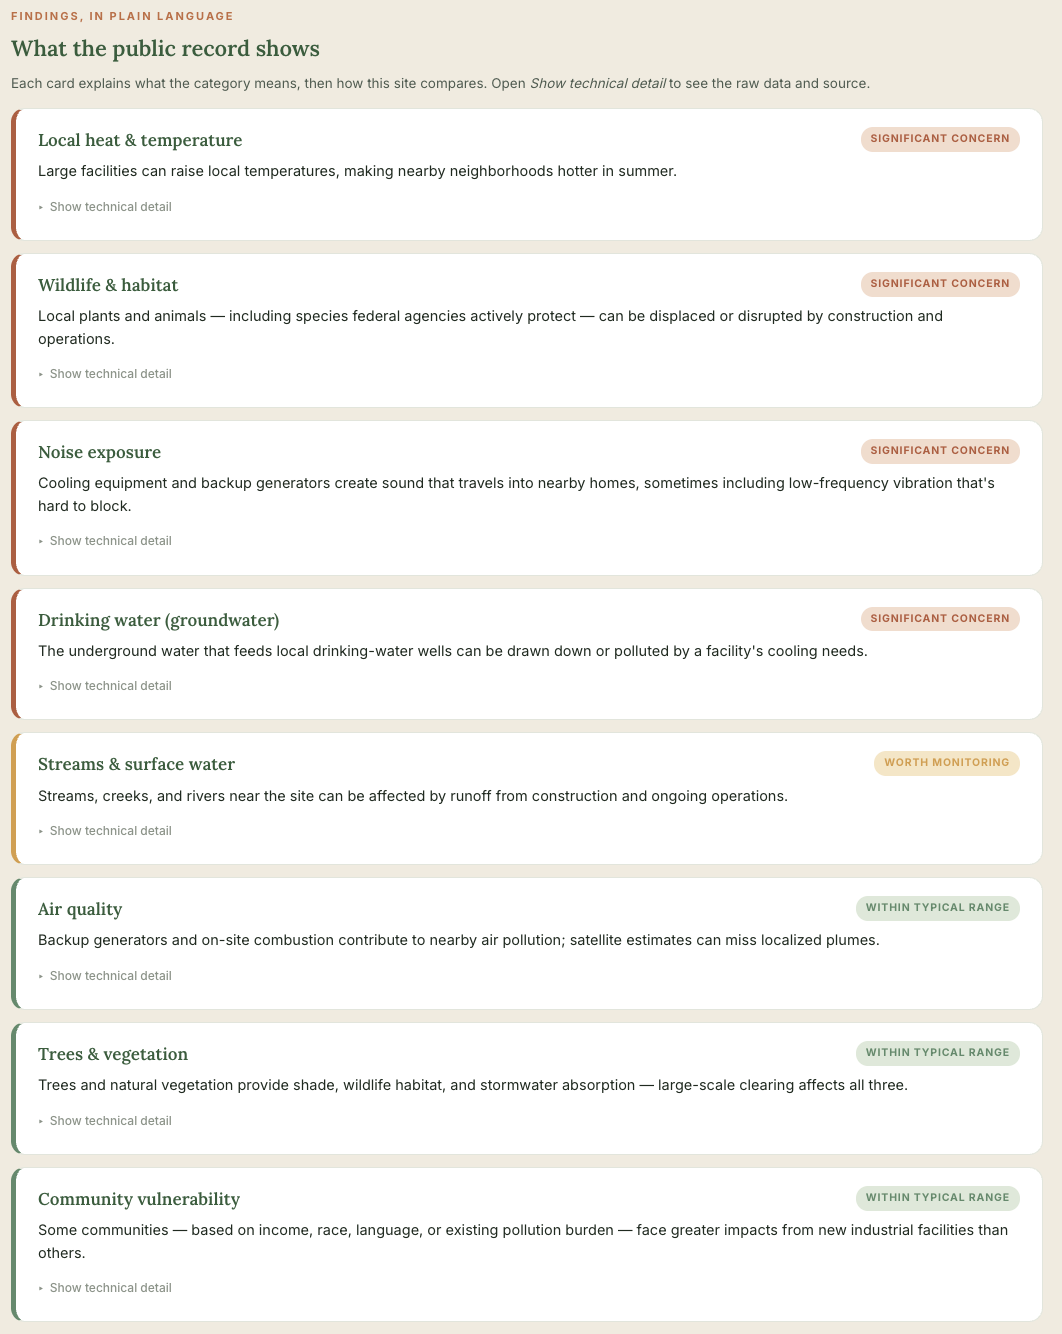
Eight categories in plain language, each badged by severity: significant concern, worth monitoring, or within typical range.
-
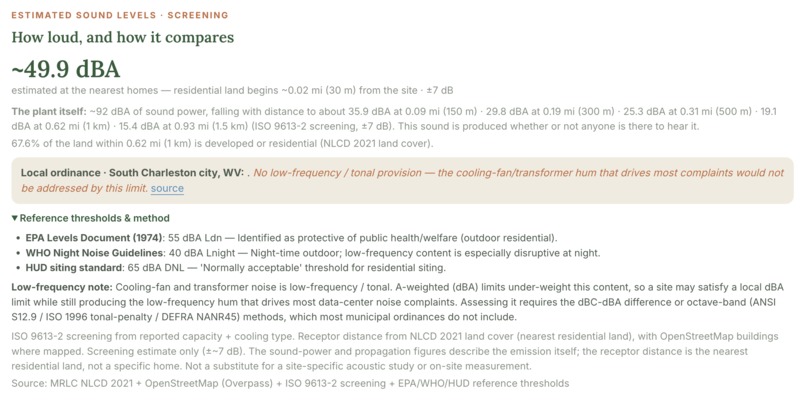
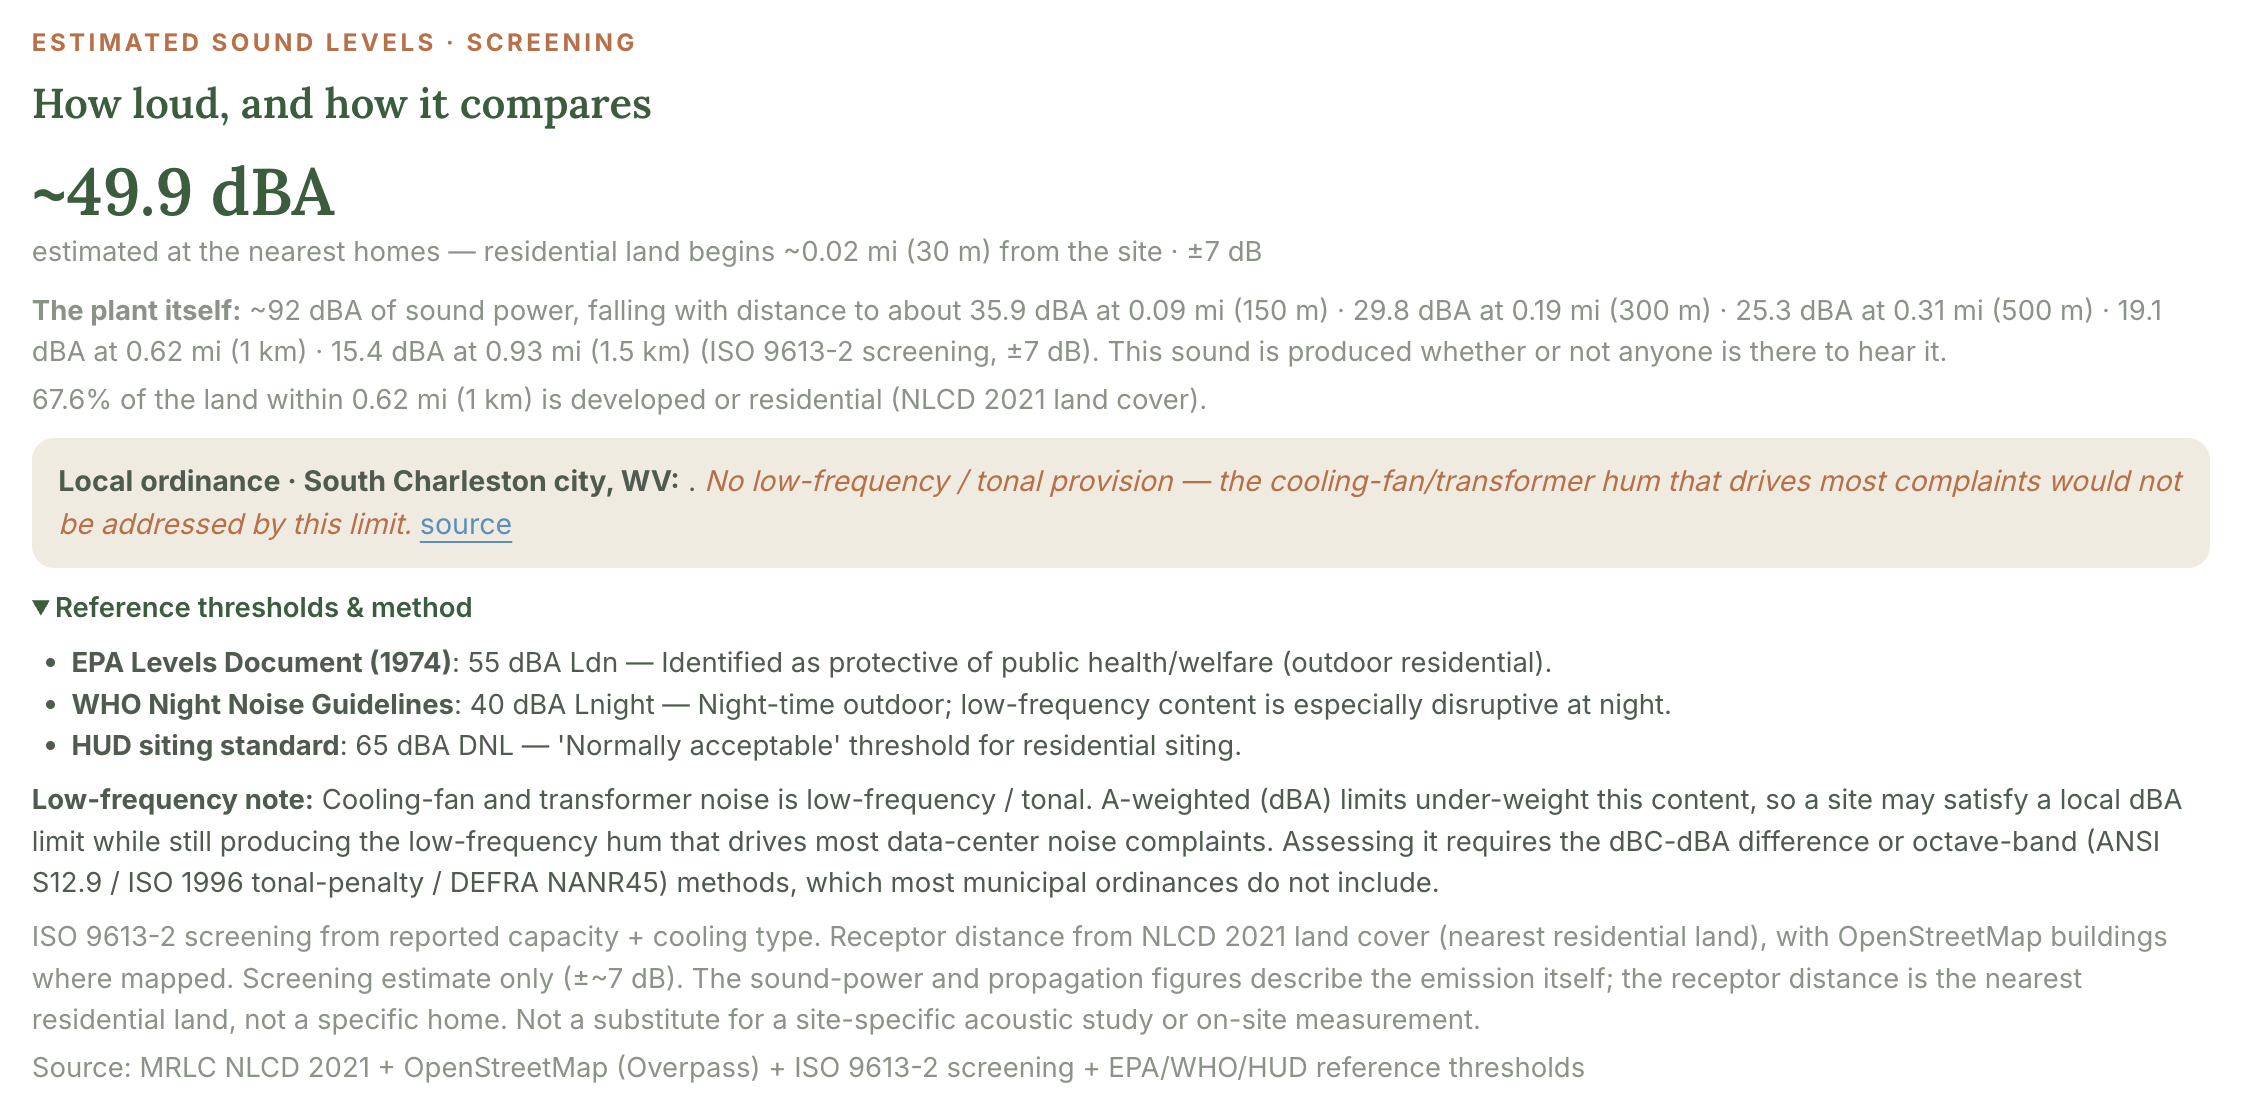
Every figure is traceable: noise modelled by ISO 9613-2, benchmarked to EPA, WHO and HUD thresholds, with the local ordinance gap flagged.
-
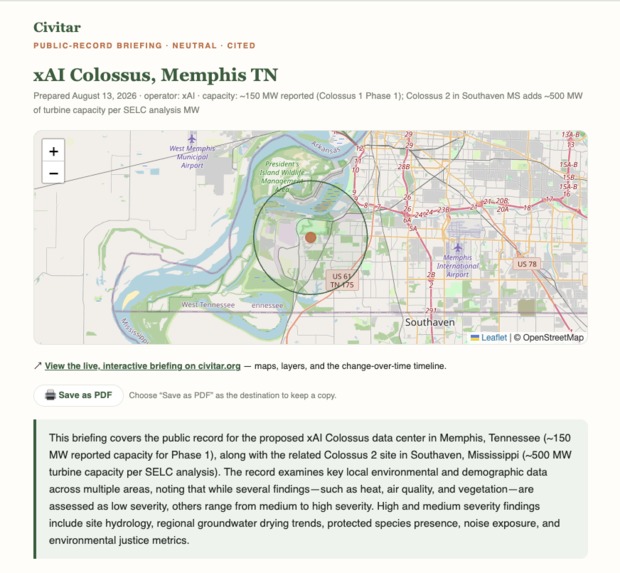
A Public-Record Briefing generated on demand by the Gemini API that is neutral, cited, and saveable as a PDF to take to a public hearing.
-
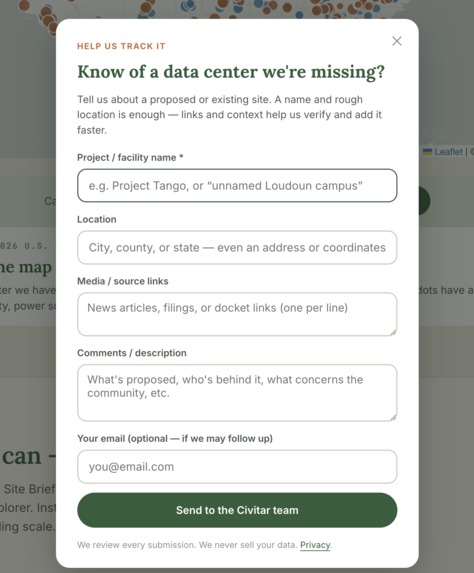
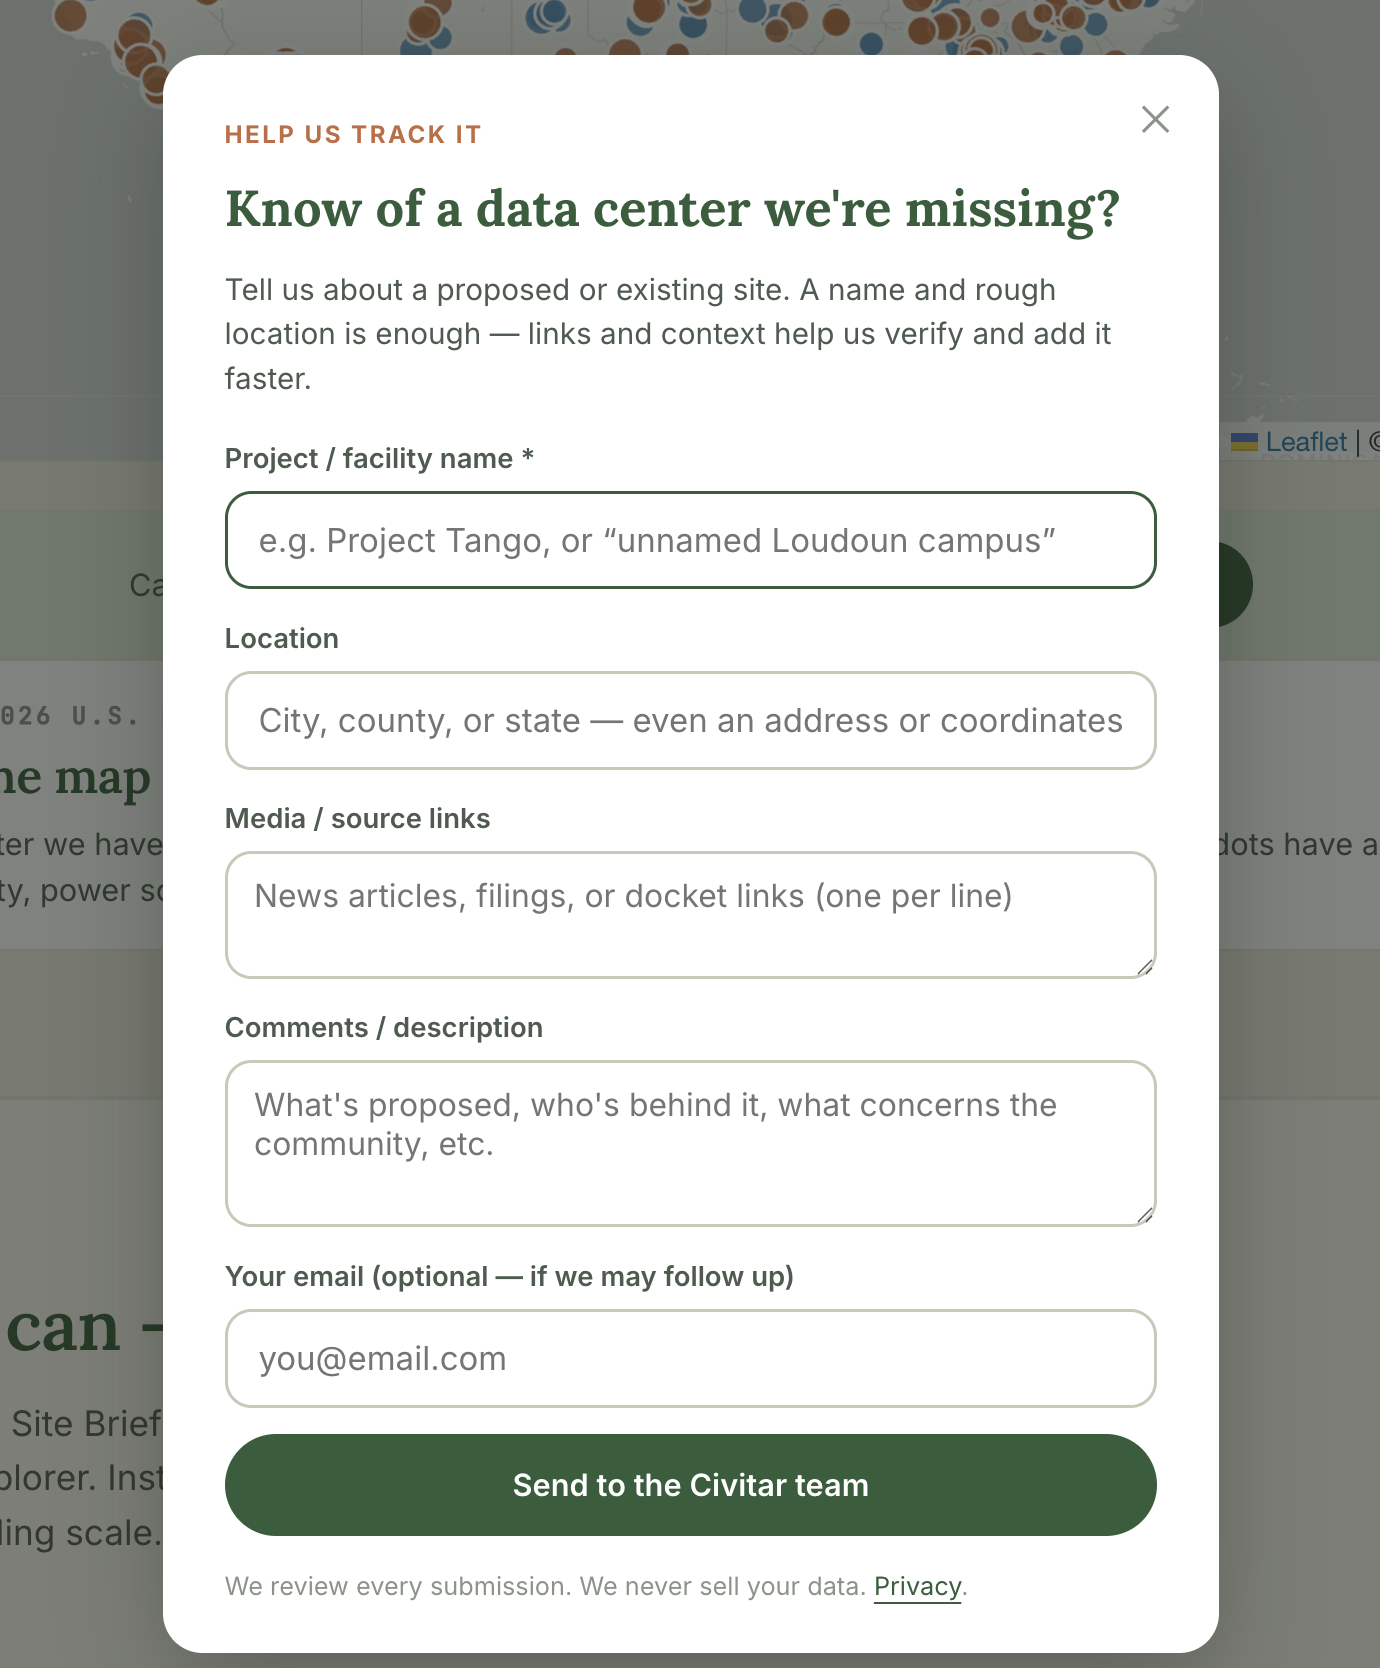
Residents add sites we're missing. A name and rough location is enough. An agent validates, dedups, and drafts the briefing for approval.
-

An agent-approved community submission: validated against 2,027 existing sites, drafted with its source, human-approved before going live.
-
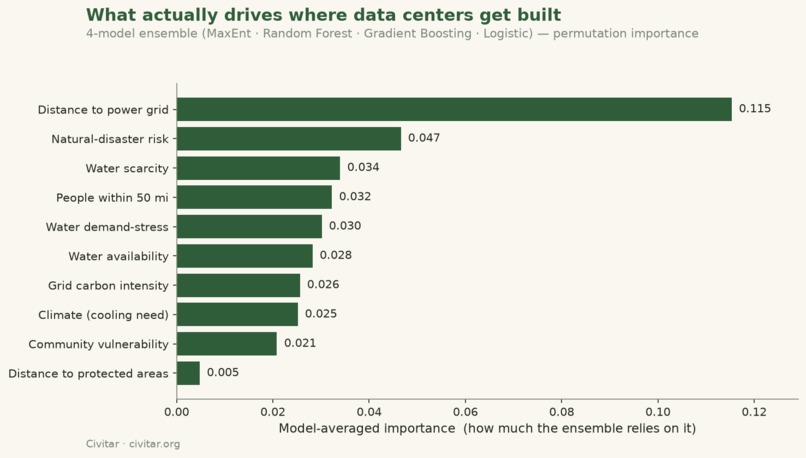
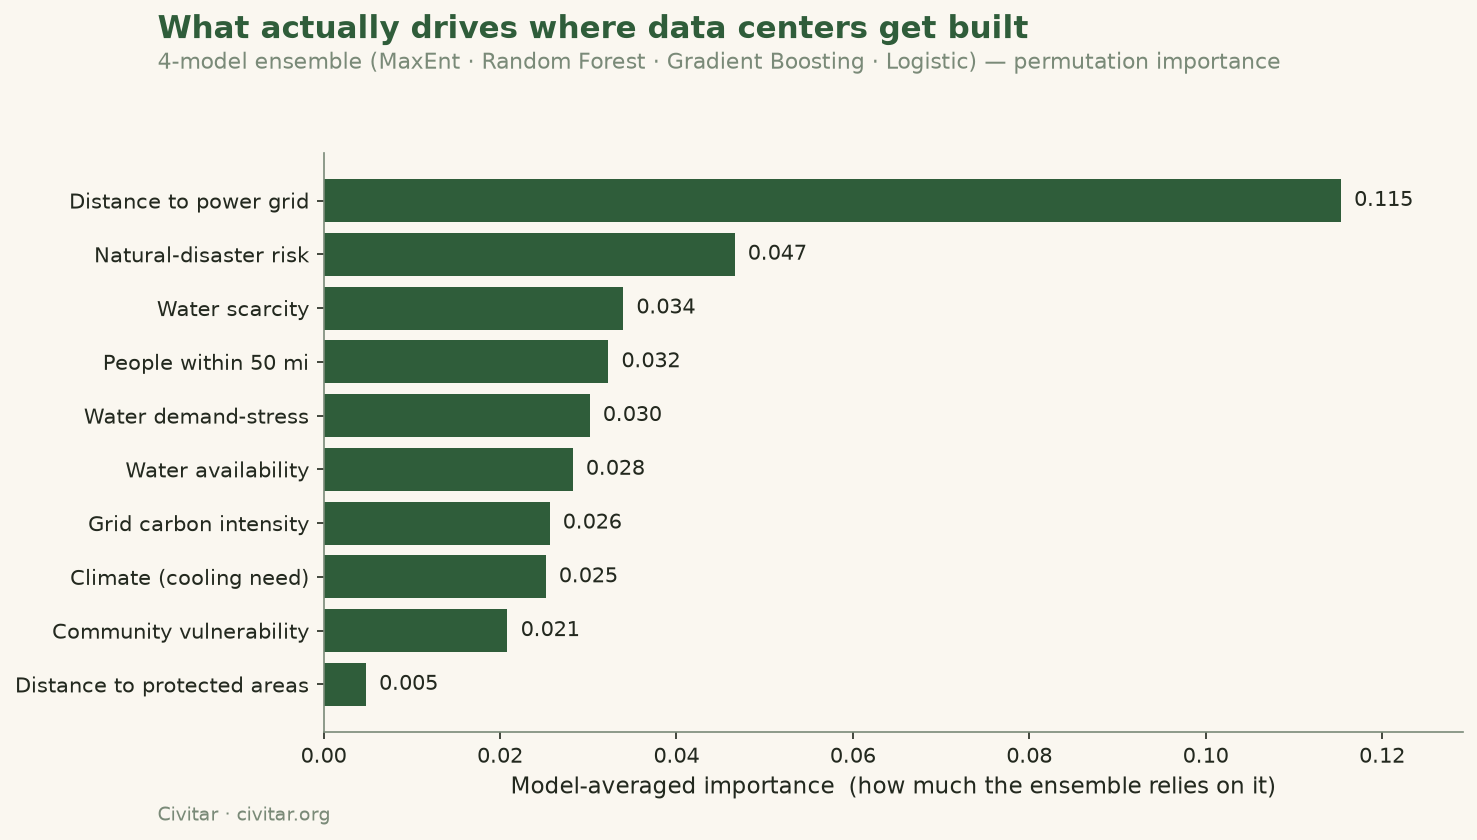
What actually predicts where data centers get built: grid access and nearby population dominate. Water stress is among the weakest signals.
-
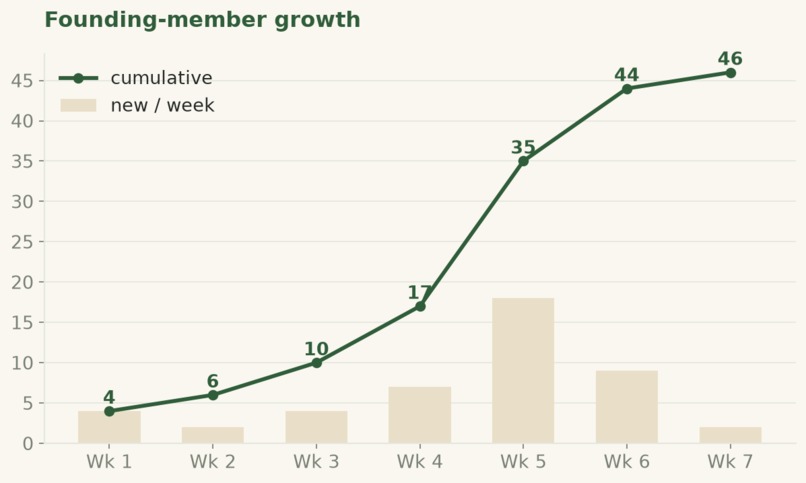
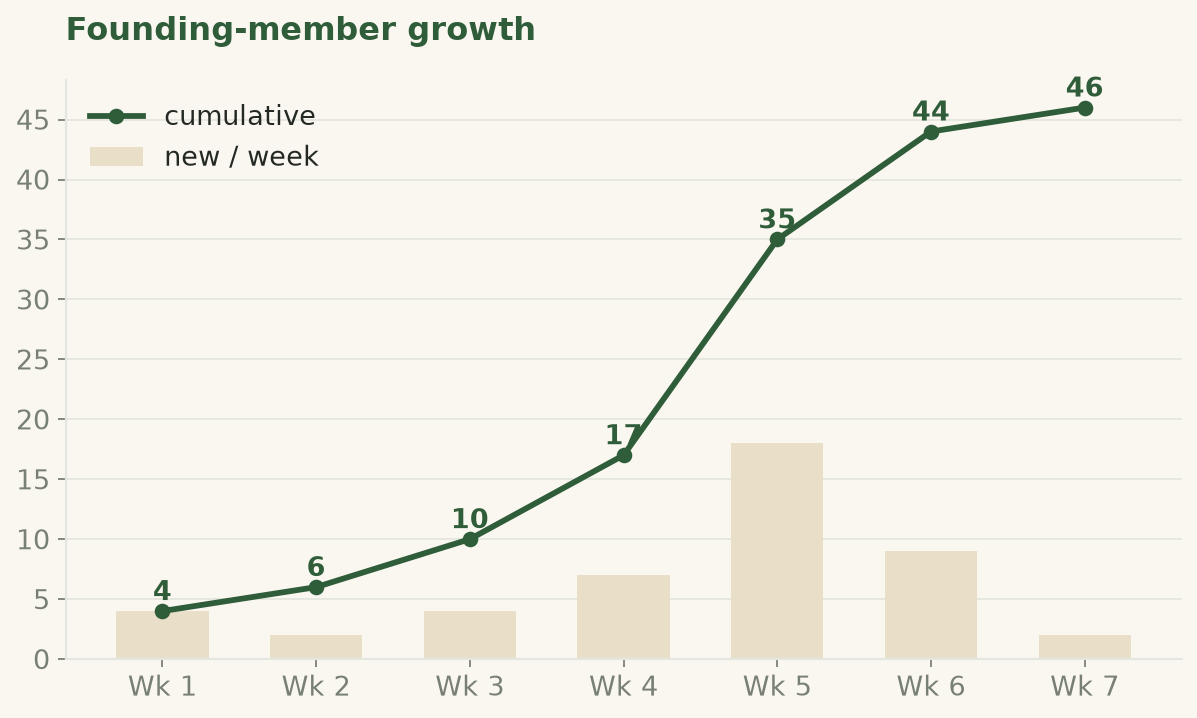
Organic growth with zero paid marketing — every user arrived through community sharing, not advertising.
-
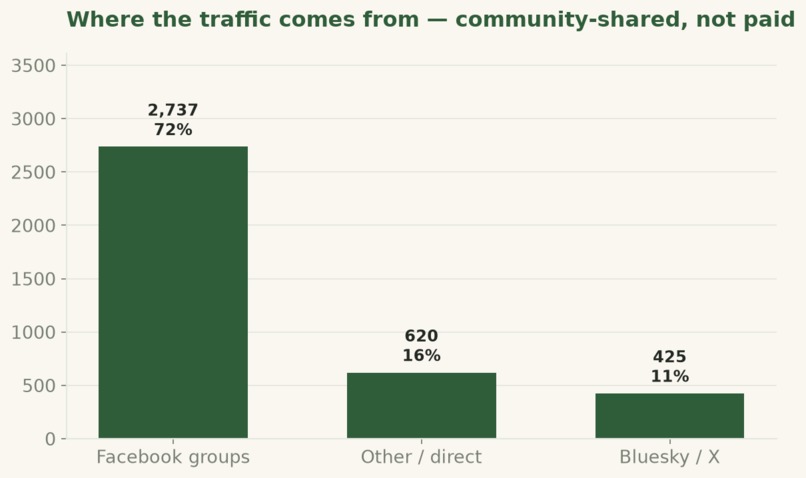
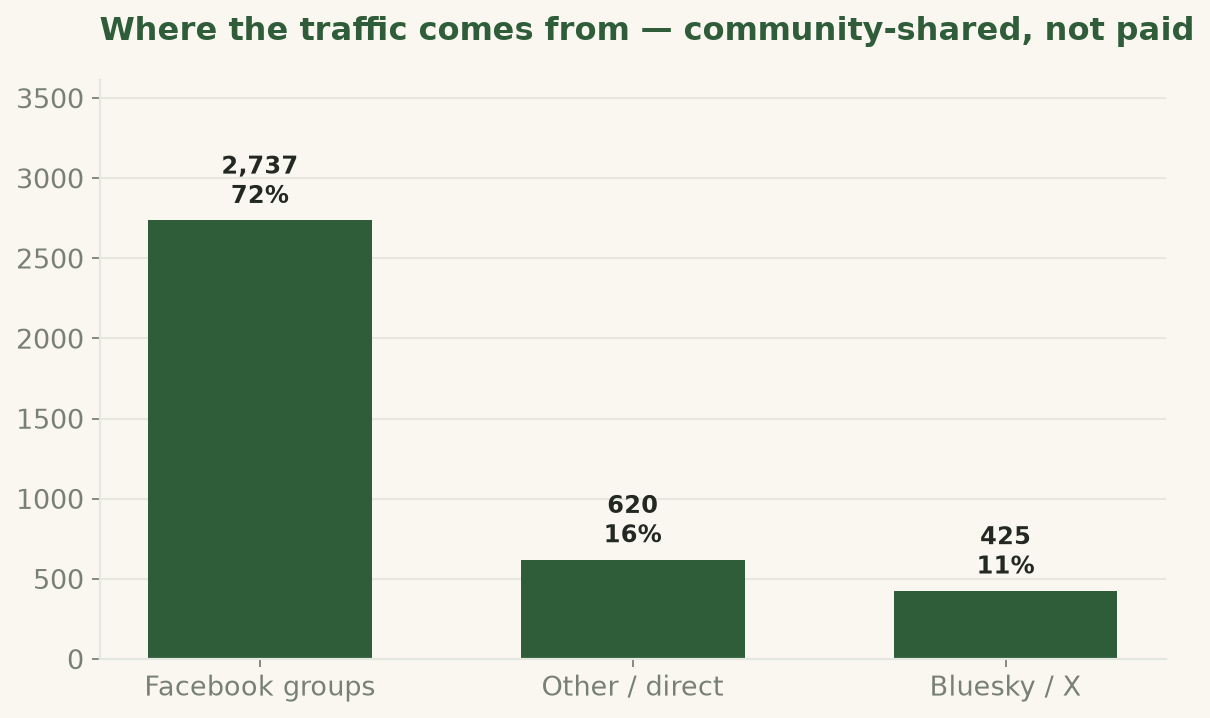
Where the traffic comes from: 72% via community-shared links into local Facebook groups. Zero paid marketing — residents do the sharing.
-
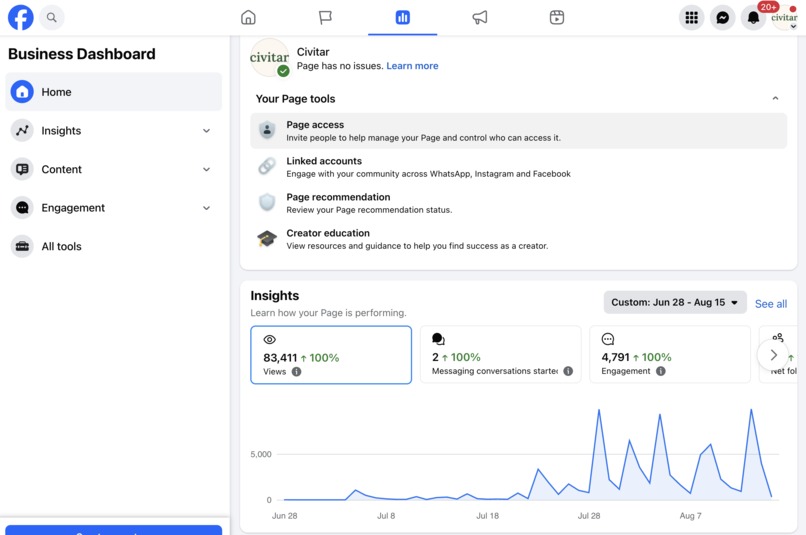
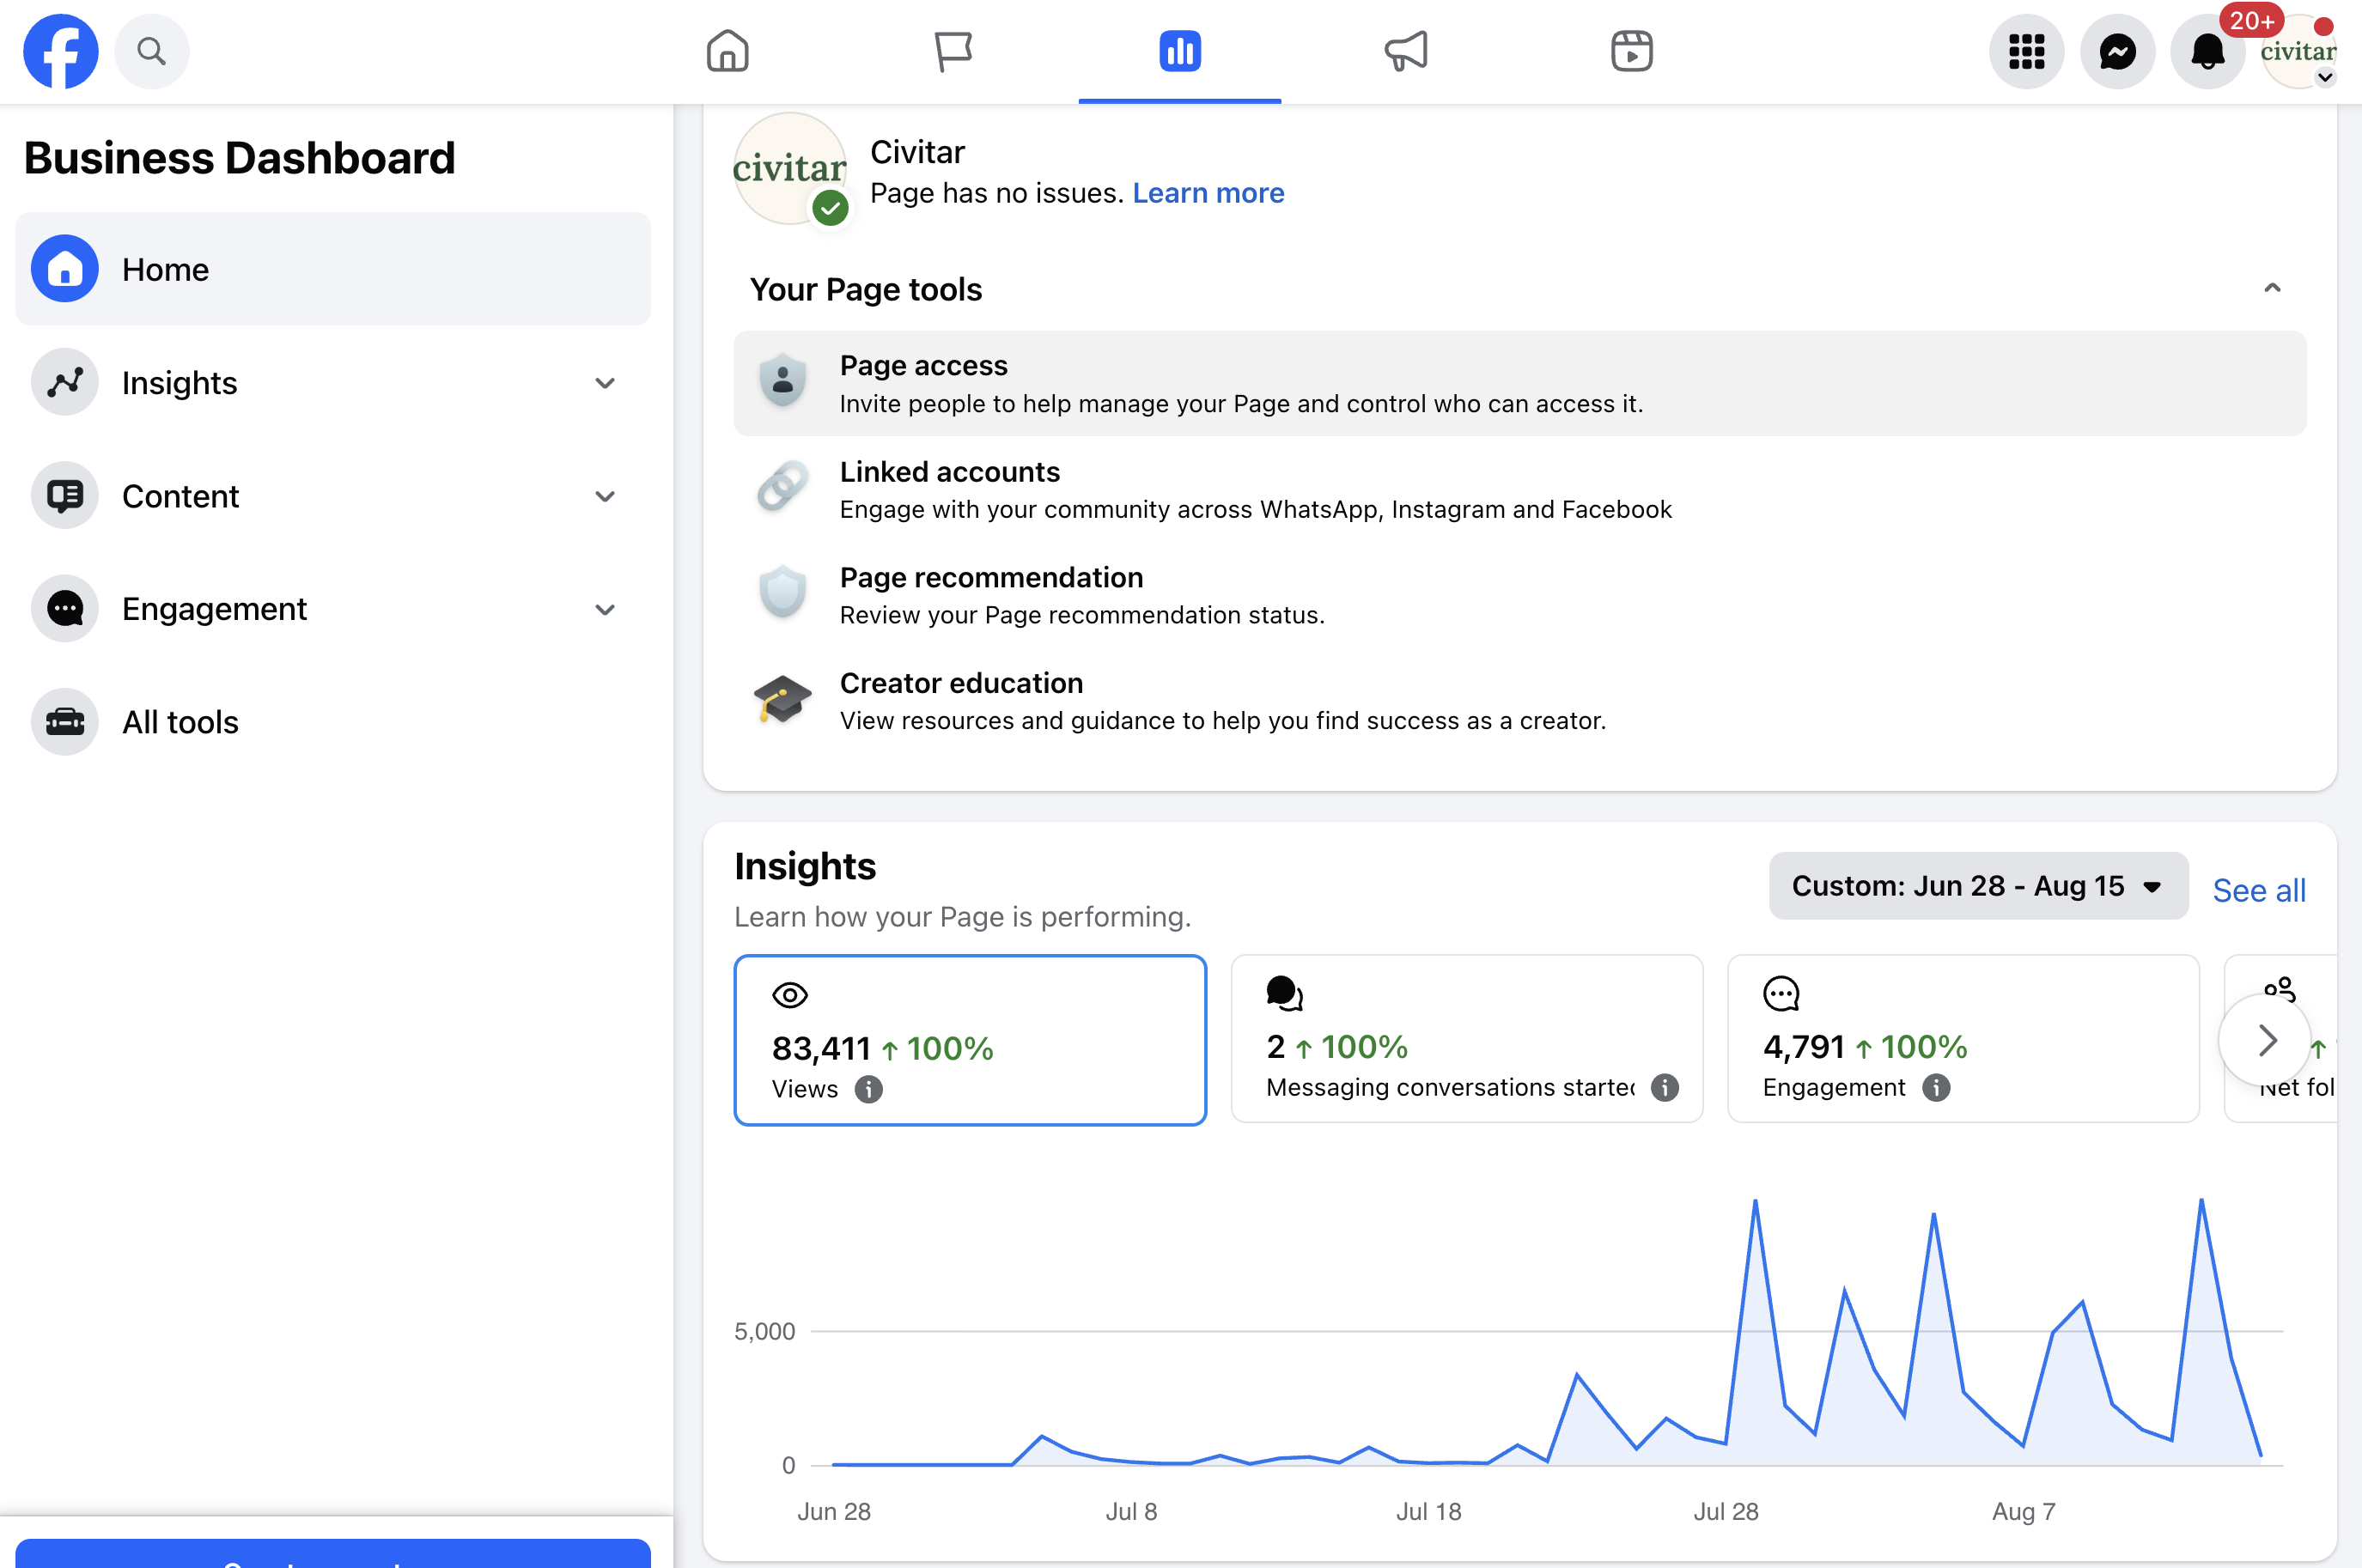
83,054 Facebook page views in seven weeks, from a page created June 28 with zero followers and $0 in advertising. All reach is organic.
-
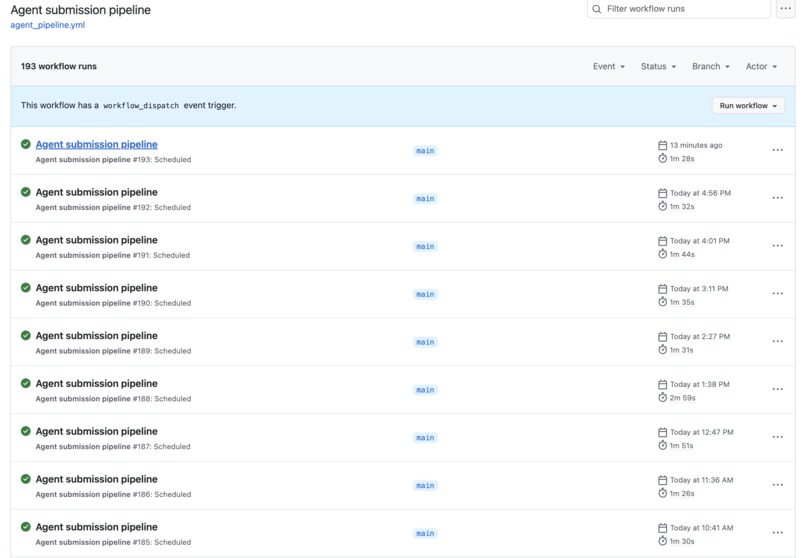
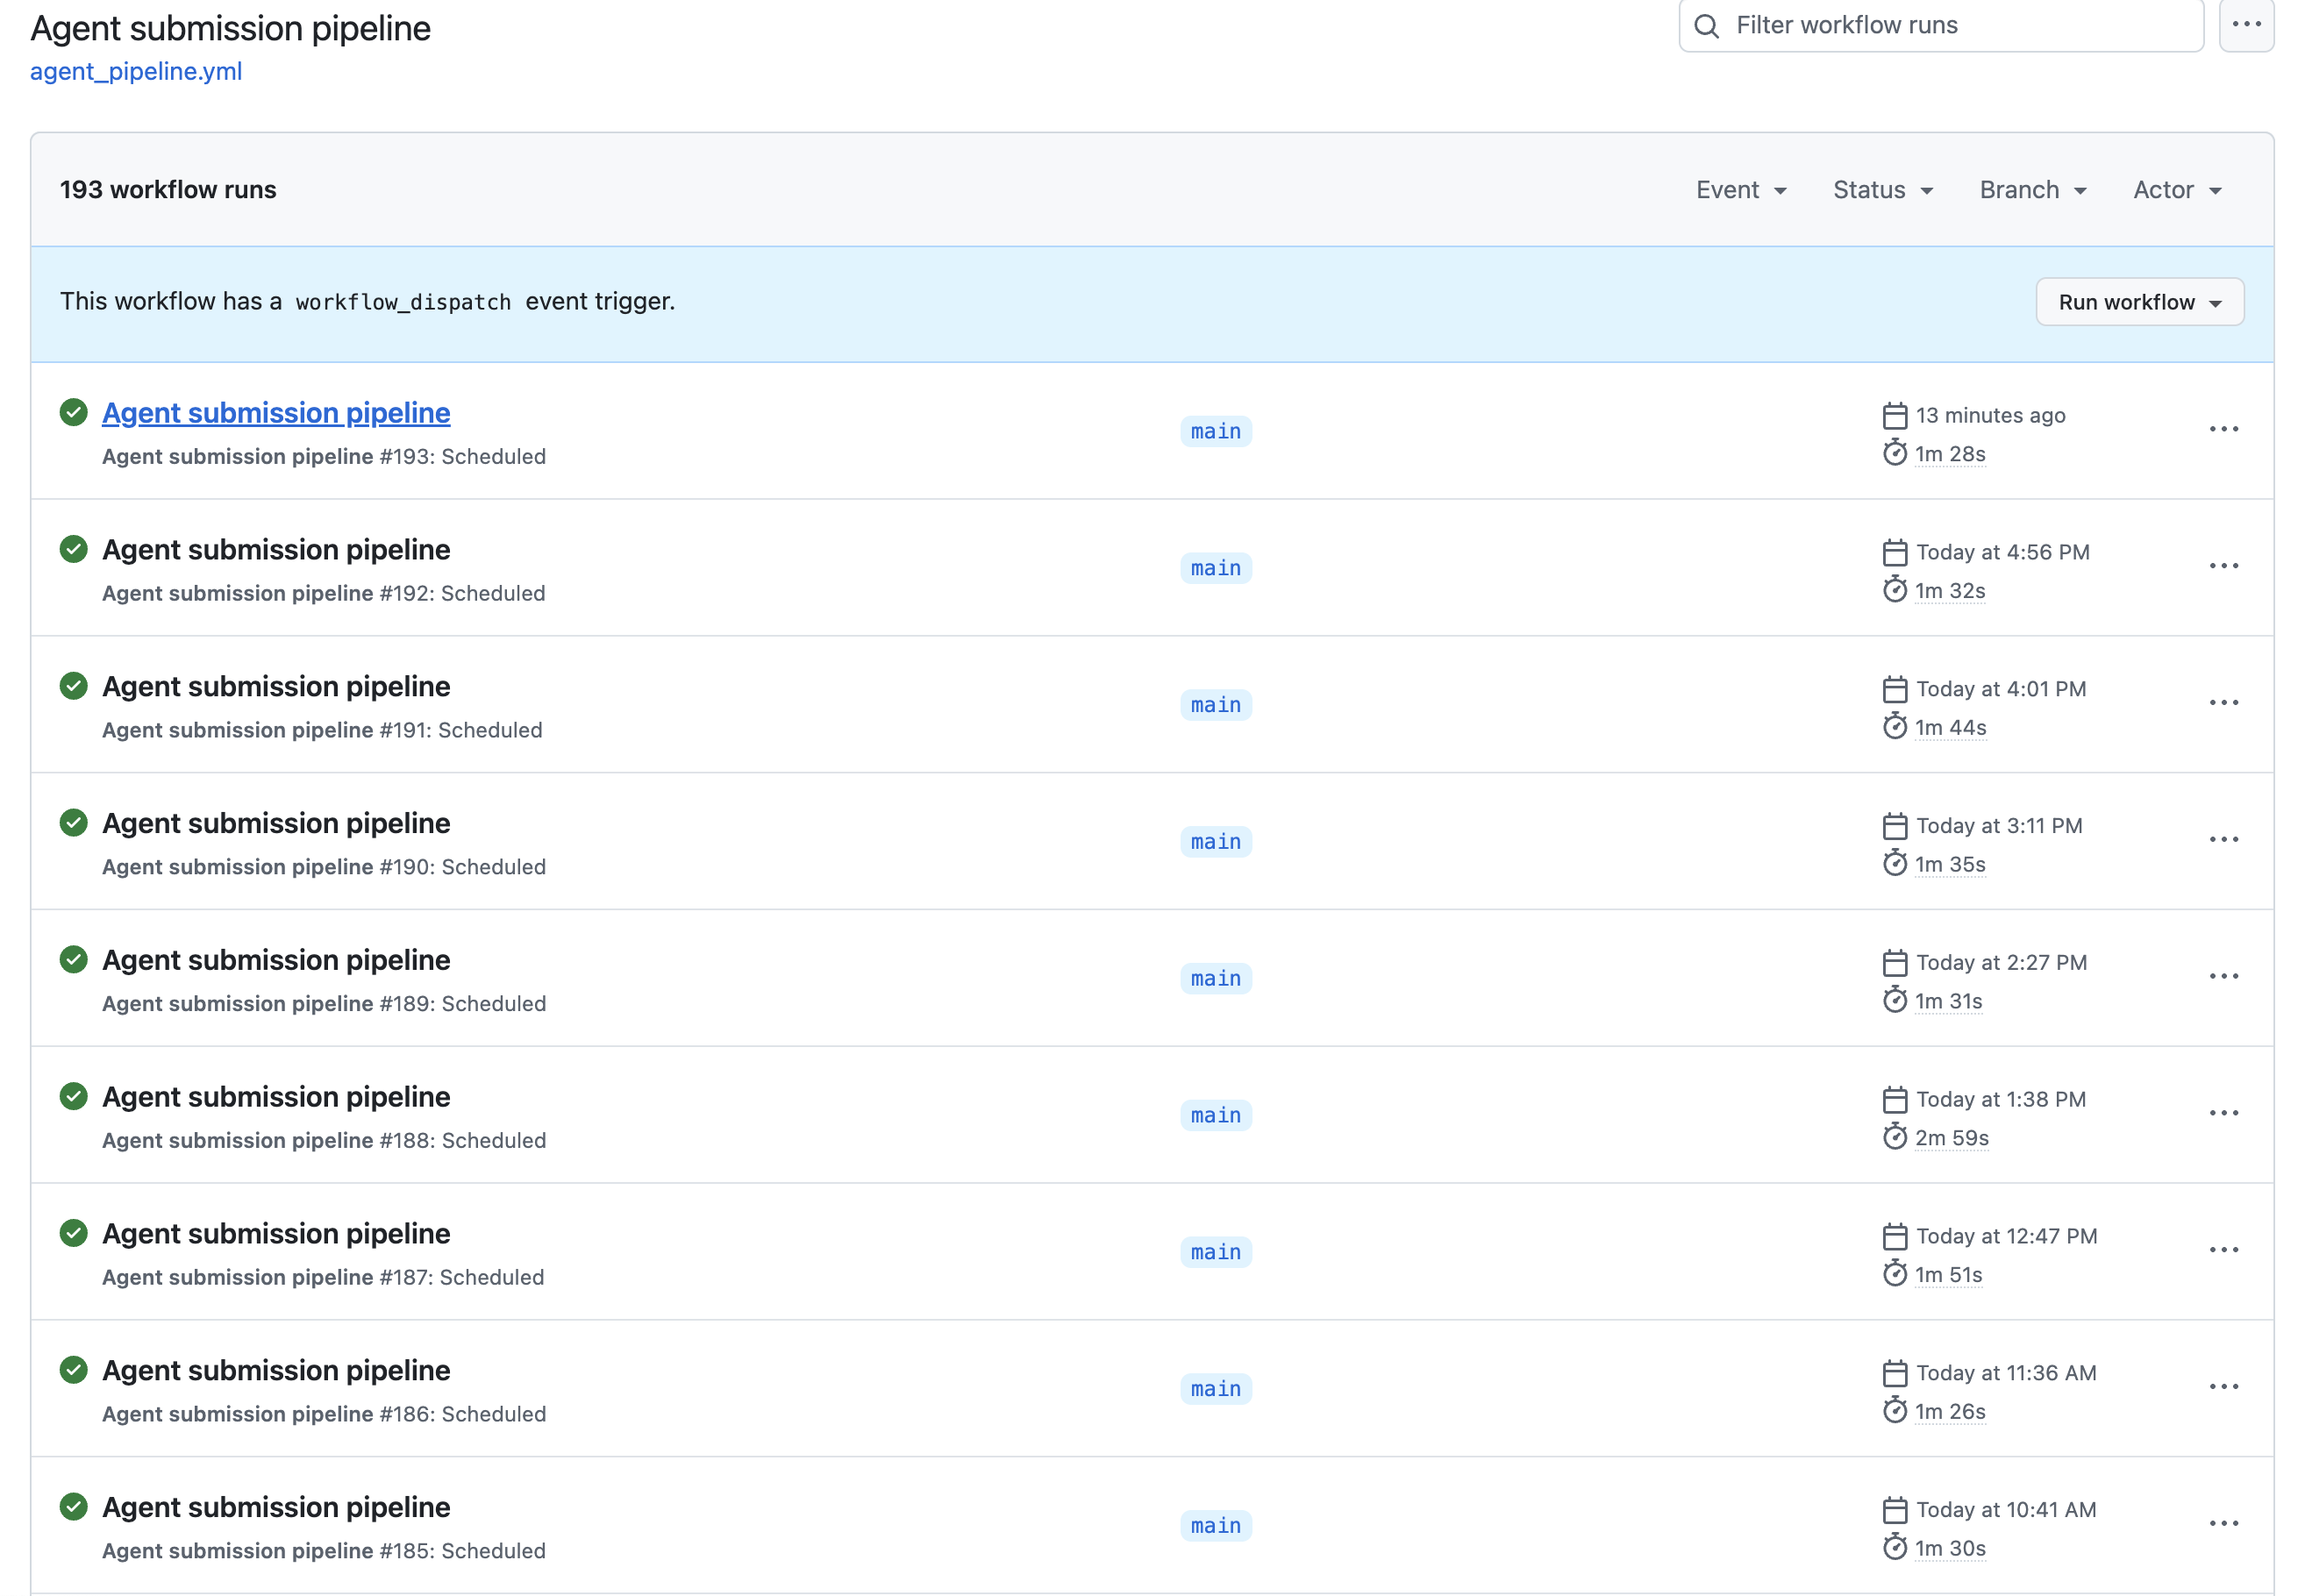
Agents run in production on a schedule: discovery, submission validation, dead-link refresh and moratorium checks, without a human trigger.
-
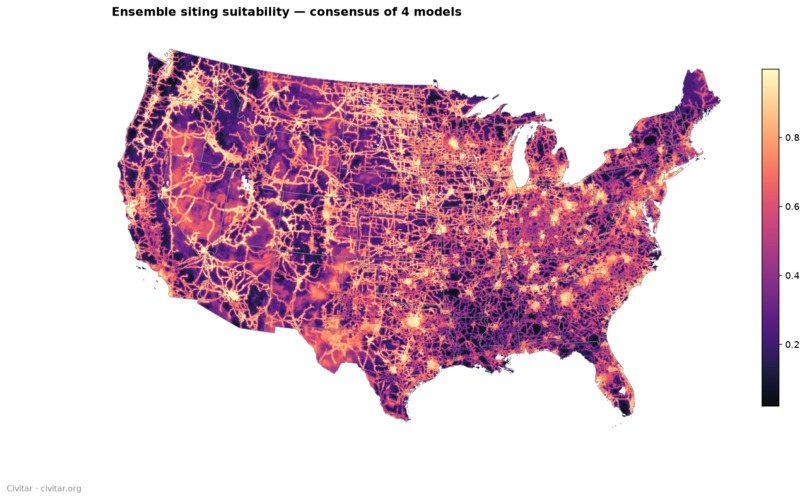
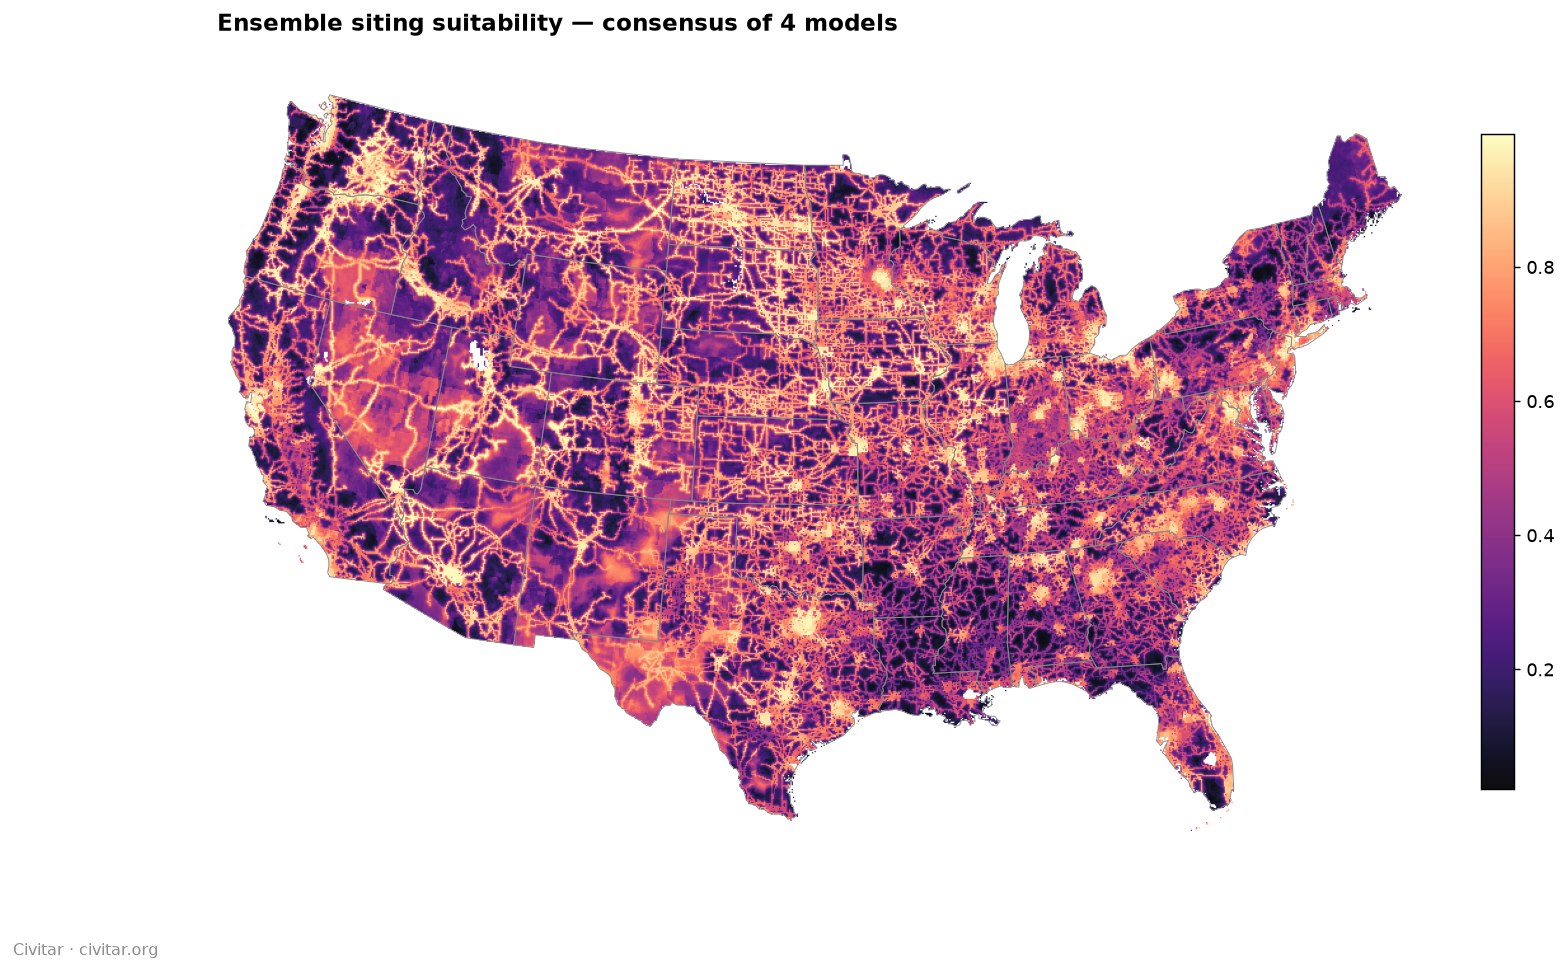
National model of where the buildout is heading from an ensemble suitability surface from the same public datasets behind every briefing.

What it does
Civitar is an informational platform showing what the public record says about the environmental context of any U.S. data center, existing or proposed, for the people who live next to them.
2,027 sites are live today: 1,543 existing and 484 proposed. Search a town, click a site, and get a plain-language briefing across eight categories: water, air quality, noise, endangered species and habitat, grid load and carbon, environmental justice, heat, and land cover or groundwater. Every number links to its primary public source, including USGS, EPA, U.S. Census ACS, U.S. Fish and Wildlife, NASA GRACE-FO, Sentinel, GBIF, and county permit dockets. Free to read, no account required.
What Civitar is not: an engineering consultancy, a permit-generation tool, or an advocacy organization. We take no position for or against any specific project and appear in no proceeding on either side. We surface the public record with citations, and we publish the same analysis to everyone. What a community — or a developer — does with it is theirs to decide. Neutrality is the product.
Inspiration
U.S. data-center electricity demand is projected to roughly triple by 2030. Every gigawatt becomes a physical compound on a real watershed, drawing cooling water, exhausting heat, generating low-frequency noise, and concentrating burdens on adjacent communities.
Those communities are usually the last to know and the first to feel it. The data exists across dozens of public databases, but assembling it parcel by parcel takes a research librarian or an environmental scientist most people don't have on retainer. The decisions happen locally, at county commissions and zoning boards, on compressed timelines.
Civitar exists because the same AI tooling powering the buildout can serve the communities affected by it, collapsing days of public-records research into a cited briefing anyone can read.
How we built it
- Frontend and API: a single Cloudflare Worker serving a static map and briefing app, backed by Cloudflare D1 for accounts, submissions and events, and R2 for per-site payloads.
- Gemini via Google Cloud Vertex AI runs the substance: grounded discovery of newly proposed projects, synthesis of every cited briefing, and validation and dedup of community submissions.
- Gemini API in the deployed Worker powers the on-demand Public-Record Briefing generator at
/api/report, a live LLM call per request. - Google Earth Engine supplies geospatial evidence: Sentinel-2 NDVI and NDWI, MODIS land-surface temperature, NASA GRACE-FO groundwater anomaly, JRC GHSL population bands.
- Continuous agent pipelines on GitHub Actions run in production on their own, roughly every fifteen minutes: discovery, briefing generation, submission validate, dedup, draft and human approve, weekly dead-link refresh, and monthly moratorium cross-referencing.
- A citation gate rejects any output containing an unsourced numeric claim.
How the business runs, and who it creates opportunity for
Civitar is one person and a fleet of agents. It tracks 2,027 U.S. data centers and publishes a cited environmental briefing for every one of them, free. The whole map cost $801 of Google Cloud compute to produce — roughly $0.30 per site, paid once — and nothing to serve, because every Cloudflare invoice for Workers, D1 and R2 came back at $0.00 inside free tier. A comparable due-diligence report on a single site runs $2,500 to $9,500. That ratio is the whole argument. AI does the analyst's, the researcher's and the content team's work. The human sets the standard for what is true enough to publish.
What runs without me. Discovery agents search county rezoning dockets, state environmental permits and USACE public notices for newly proposed data centers, returning structured candidates with docket IDs and source URLs. The analysis pipeline assembles evidence from USGS, EPA, Census ACS, USFWS, NASA GRACE-FO, MODIS, Sentinel and GBIF, and Gemini synthesizes it into a cited briefing, which a citation gate rejects and re-runs if it carries an unsourced numeric claim. Submission agents validate community tips, dedup them, and draft a provisional briefing. Dead-link refresh and moratorium cross-referencing run on schedule. Stripe handles checkout, renewals and dunning, and the webhook flips the tier.
Gemini decides, autonomously and in production, which data sources to query for a given site; how to reconcile conflicting evidence, such as regional groundwater recharge against a local monitoring well showing drawdown; whether a briefing clears the citation bar; what language describes each impact category under neutral journalistic constraints; and whether a community submission is a real, non-duplicate facility. This is not a demo path. On 2026-08-13, after this project was submitted, the pipeline took a resident's tip about a Pennsylvania project and validated, deduped, briefed, committed and deployed it with no human involved at any step. That is why the site count above carries a date.
What I actually do all day. I read what the agents produced overnight, work the submission queue, and approve or reject. I spot-check briefings against their sources, and when something looks wrong I do not fix that briefing — I write the gate that catches the whole class of it. That is the real division of labor. But the two places a human is genuinely required are not bug-catching, and neither delegates.
The first is neutrality. Our most engaged users are residents fighting a specific project, and they want the map to be an ally. A language model will match the register of whoever is prompting it, and ours is asked, constantly and sincerely, to put a thumb on the scale. Holding every briefing to what the public record actually says — including when the record is favorable to a developer — is a standard the model cannot set for itself, because it has no stake in whether Civitar is still trusted a year from now. That single constraint is why a county planner and a resident can read the same page.
The second is deciding what is not good enough to publish. We built a cumulative-impact model that overlays two independent siting methods and flags where they disagree. It found that 16% of proposed sites sit in high-disagreement zones against 2.9% of existing ones. The finding is real and it is interesting, and it is deliberately not on the live map — when two defensible models disagree that sharply, we do not yet know which is right, and a resident carrying our map into a zoning board should not be carrying our uncertainty as though it were a finding. Choosing to withhold a result the system was fully capable of producing is the judgment that does not delegate.
Jobs and economic opportunity beyond the founding team. Civitar's category is Professional Services Access, and the honest measure is the work it makes possible for other people rather than headcount inside it. Environmental due diligence on a single site runs $2,500 to $9,500 as a report, and the closest commercial platform tracking these projects charges $750 a month, serves developers only, and offers nothing to the communities on the other side of the decision. Publishing the impact side of that same public record for free changes who can afford to do this work at all: local journalists get cited context in seconds instead of weeks, intervenor counsel and conservation organizations face a lower pre-research cost so smaller communities can retain anyone at all, understaffed county planning departments get an independent starting point, and solo practitioners can serve community-side clients profitably.
That is already visible in the volunteer economy around the platform. Twenty-six sites on the map were submitted by residents — 16 identified people plus eight who left no contact details at all, none of them paid — and 19 were verified and added. One itemized 548 gas generators and 33 emissions points out of a permit. Another flagged a mapped site that looked like a house and set out to trace the records himself. That is real research labor, contributed because the resource matters to the people doing it.
Potential paid roles follow from where the human sits. The approval gate scales with site count and cannot be handed to the model, so growth in pay-what-you-can conversions and the Institutional tier converts first into part-time regional verifiers who own human review for their states, and then into a community liaison working with the newsrooms and local organizations that use the briefings.
Category impact. Reading permits, pulling USGS, EPA, Census, USFWS and NASA data and producing a sourced environmental assessment is a professional service. Civitar delivers the community-facing half of it free, with every figure traceable to its government source — making public data infrastructure that was already a public good finally legible to the people it was collected for.
Challenges we ran into
Selling to people who were right to be suspicious. The communities who need Civitar most are already exhausted by outside actors: developers running charm campaigns, consultants with a position to sell, and now a flood of AI-generated content they can't verify. Walking into a local group as "an AI tool about your data center" starts underwater. The only thing that worked was making every number clickable back to a government source, so nobody has to trust us. They can check. That constraint drove the entire architecture, including a citation gate that rejects any unsourced numeric claim even when the answer is probably right.
Distribution with no budget, into spaces built to repel marketing. We spent nothing on customer acquisition, so reach meant local Facebook groups organizing around specific proposals. Those groups are gatekept by admins, most ban promotional posting outright, and posting the same link across many of them is exactly the pattern spam classifiers exist to catch. Getting an account restricted would have cost the only distribution channel we had. So distribution became an engineering problem. We built tooling that tracks which groups have already seen a post, enforces a cooldown before any repeat, and rotates distinct copy per group. Slower by design, but 72% of all traffic now arrives through links shared by the community, and the sharing is done by residents rather than by us.
Staying neutral when your most enthusiastic users want an ally. The people most eager to share Civitar are usually fighting a specific project, and they want the map to say the project is bad. Civitar won't. We publish what the record shows and take no position on any specific project, and that costs real enthusiasm in the exact rooms where we get shared. It is still the right call. The moment Civitar becomes an advocacy tool it stops being usable by the county planner, the reporter, or the official on the other side of the table, and those are the readers who make it matter. The same logic is why we intend to sell the siting model to developers as well as to communities: refusing one side would be a position, and we are not against data centers being built. We are against them being built badly. Neutrality is a growth constraint we accepted deliberately, in both directions.
Charging for something we insist should be free. The core product has to be free. A resident shouldn't hit a paywall the week a rezoning notice lands. But free forever with no revenue isn't a business. We landed on pay-what-you-can, a $1 floor with $5 suggested and a $100 cap, with the entire core free, and we grandfathered all 42 founding members into the paid tier permanently rather than converting them. The honest consequence is that arms-length revenue is $0 in this window. We would rather show a validated payment mechanism and an intact distribution engine than a revenue number extracted from the first 42 people who believed in it.
Verifying AI output that is confidently, plausibly wrong. A briefing computes impacts in a 5 km buffer around a point, so a coordinate that is merely plausible produces a fully cited description of the wrong place. We built an independent check, reverse-geocoding the point, forward-geocoding the address the record itself claims, and comparing the two, then ran it over every newly added site. 23% failed. One sat 79 km from the facility it described. Thirteen sites were pulled and twelve were re-geocoded, each carrying a record of the prior point and the distance moved. A related discovery: AI-operated systems fail quietly. In one production run, three separate scripts reported success while producing nothing. Verifying outputs rather than exit codes is now the operating discipline.
Accomplishments
2,027 data-center locations tracked, each with a cited briefing, built and run by one person for $801 of Google Cloud compute — about $0.30 per site, paid once. Serving them costs nothing: every Cloudflare invoice for Workers, D1 and R2 returned $0.00 inside free tier, so the ten-thousandth reader of a briefing is free. The comparable professional report runs $2,500 to $9,500. Nineteen community-submitted sites were verified onto the map by neighbors who knew about a project before it appeared in any commercial directory.
What we learned
An AI-run business fails quietly, not loudly. Across one production run we found three separate scripts reporting success while producing nothing: a pipeline writing null-payload files, an upload leaving fourteen sites indexed with no data behind them, and a backfill that failed on all 146 inputs and exited zero. Every one would have shipped silently. Verifying outputs rather than exit codes is now the operating discipline, and the fixes are in the repository history.
What's next
Near term: deeper docket-level coverage of proposed projects, server-side PDF export, growing arms-length pay-what-you-can conversions, and an Institutional tier for newsrooms, libraries and conservation organizations.
The larger opportunity is predictive, and it is already built. Alongside the per-site briefings we run a national cumulative-impact model: a four-model ensemble — MaxEnt, random forest, gradient boosting and a logistic GLM — trained on every existing U.S. data center under 300-km spatially blocked cross-validation, crossed with a five-term harm surface spanning water scarcity, grid carbon, environmental justice, agricultural land and sensitive wetlands. Consensus and model-disagreement maps are on the analytics page. It already shows what the per-site record cannot: transmission access and flood hazard drive siting more than water does, and proposed sites carry measurably higher projected impact than existing ones.
As a product it serves both sides of the siting decision, which is what neutrality actually requires. A county, a state agency or a conservation group gets early warning — which corridors and watersheds are likeliest to see a proposal next, months before a rezoning notice, and the ability to test scenarios against their own weightings. A developer, utility or hyperscaler gets the same surface pointed forward: where a campus can go that will not draw down a stressed watershed over its operating life, will not take prime farmland or sensitive wetland, and will not concentrate load on an already burdened community. We are not an anti-data-center organization. The buildout is happening, the real question is where, and a project sited well is the largest single mitigation available — larger than anything achievable after the permit is granted.
What neutrality does require is independence, and that is the line we hold rather than a line about who is allowed to buy. There is one analysis and it is published. No customer gets a private version, a softened finding, or a delay on a result concerning a site they are involved with, and Civitar takes no position for or against any specific project in any proceeding, on either side. Refusing industry money would be the cheap version of integrity; publishing the same answer to the developer and to the neighbor is the real one.
Sequence matters. The disagreement layer stays off the public map until we can show which model to trust: validation first, then free publication, and only then paid depth tiers for organizations needing custom weightings and their own geographies. The core stays free, neutral and fully cited.
Built With
- cloudflare-d1
- cloudflare-r2
- cloudflare-workers
- epa
- gbif
- gemini
- github-actions
- google-cloud
- google-earth-engine
- javascript
- nasa
- openstreetmap
- python
- sentinel
- stripe
- us-census
- usgs
- vertex-ai


Log in or sign up for Devpost to join the conversation.