-
-
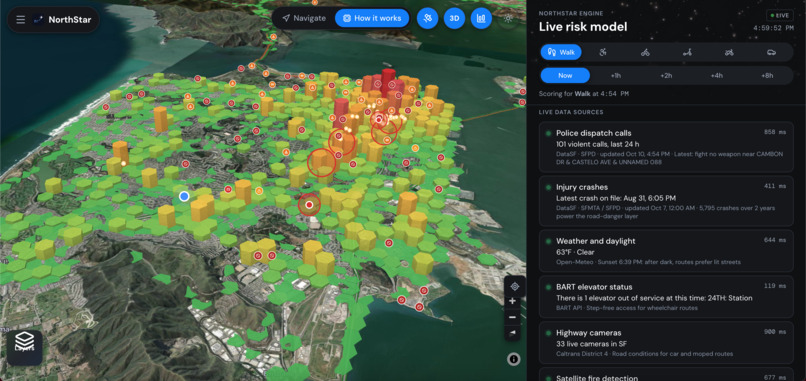
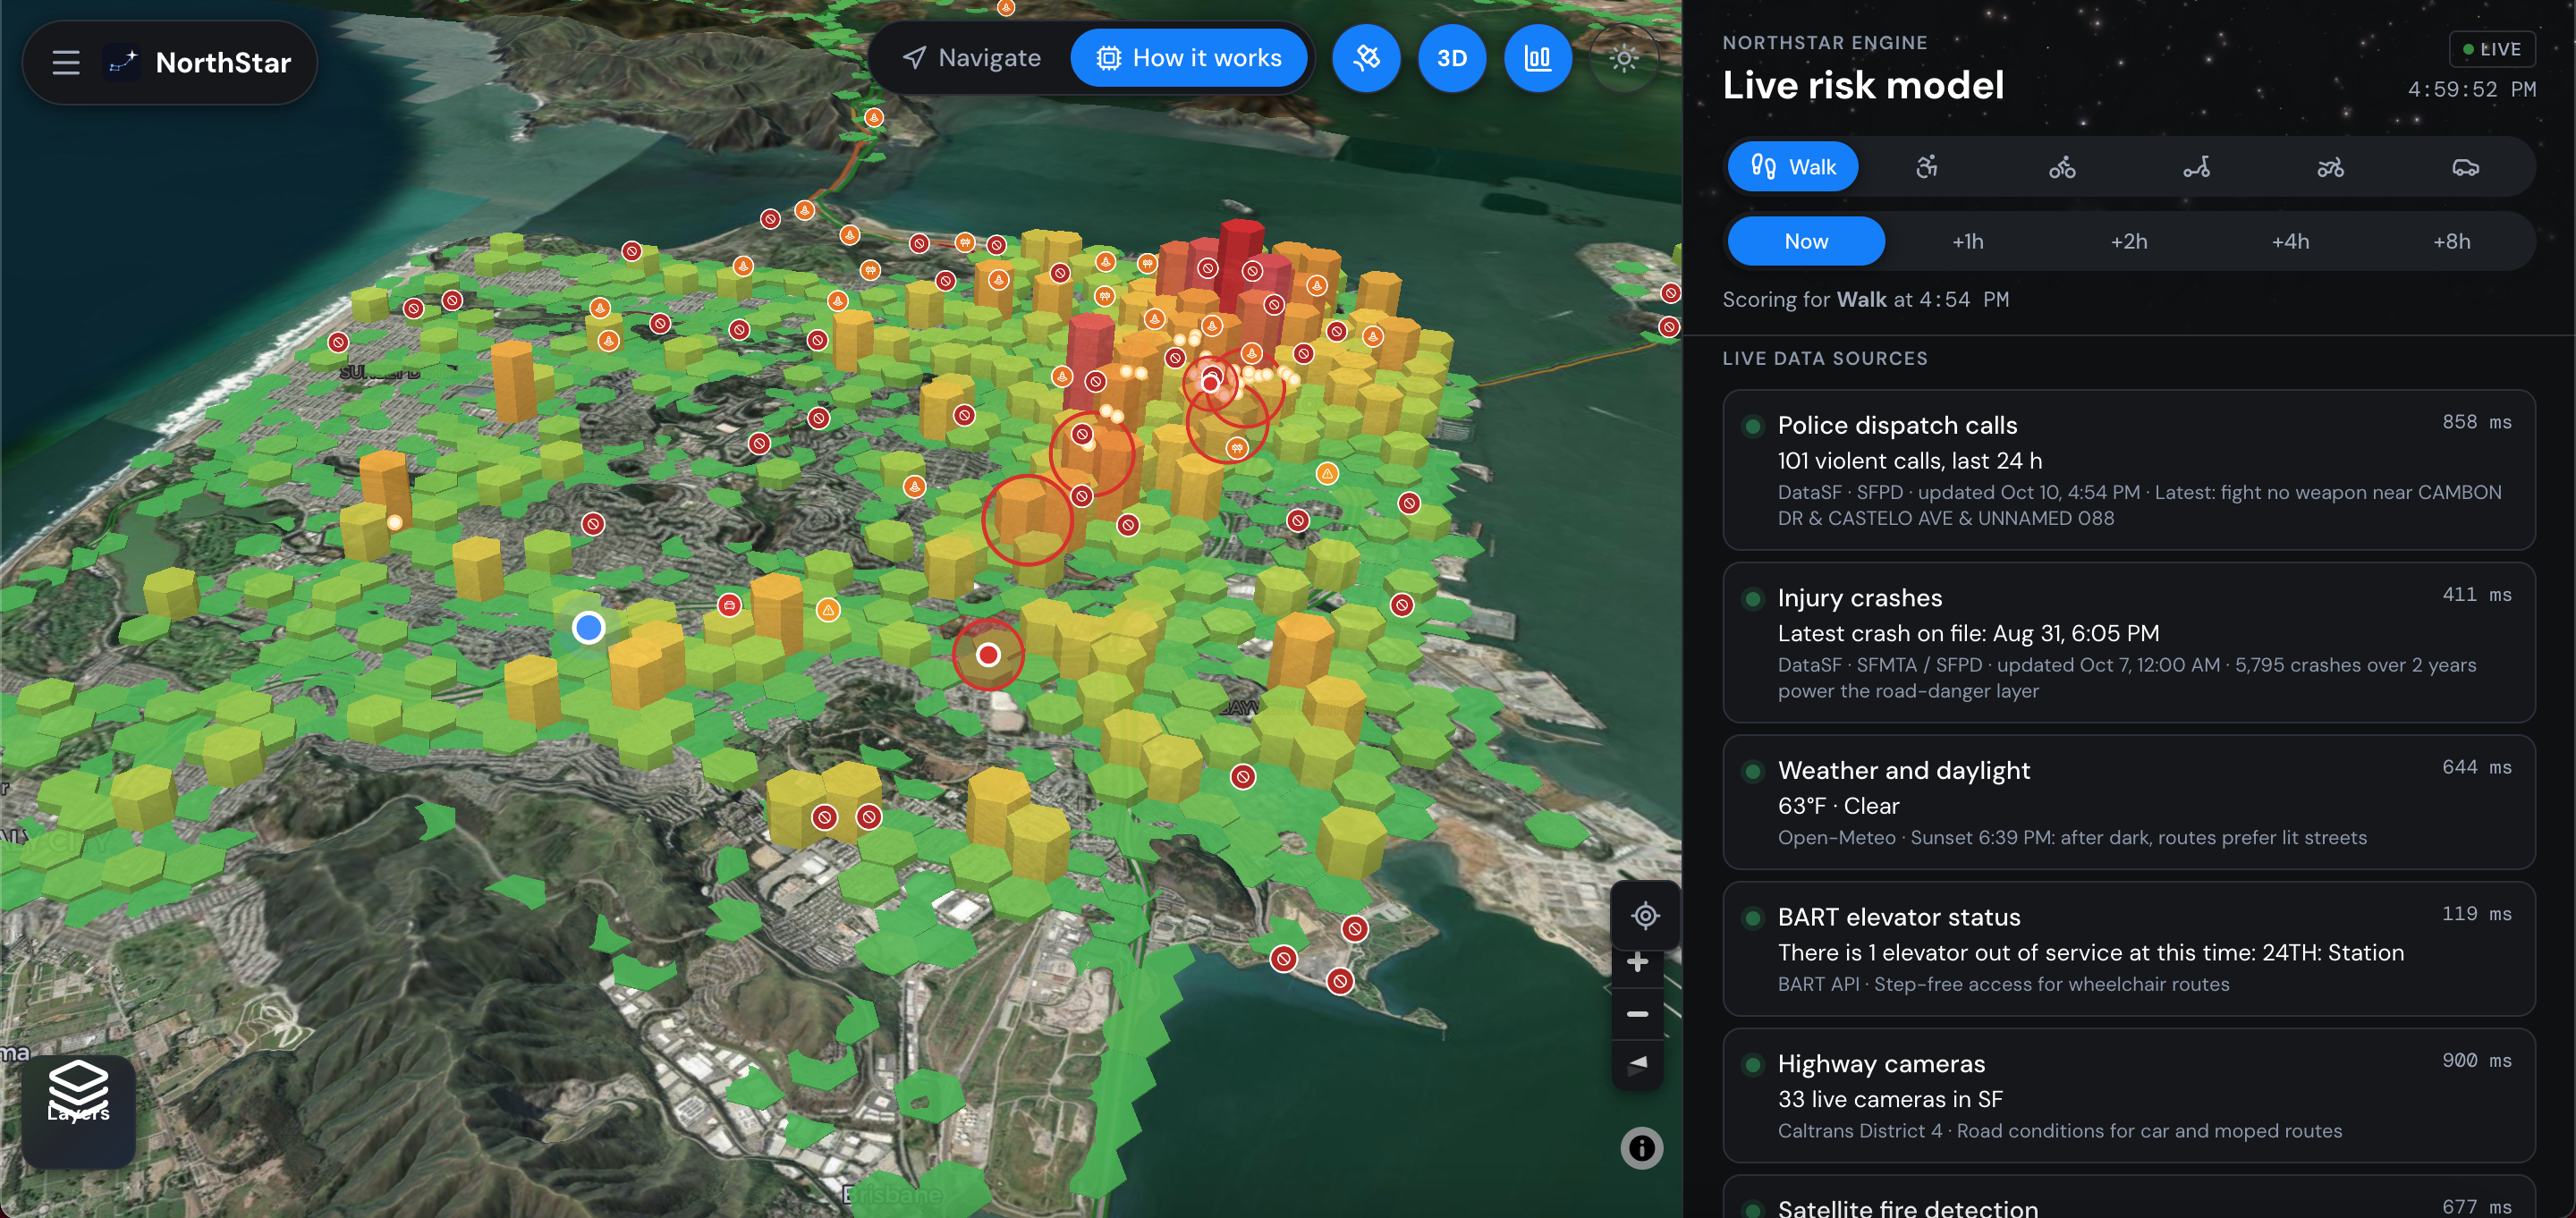
NorthStar offers a city-wide view of the risk valuation of every block. Each block is interactive and includes sourced risk calculation.
-
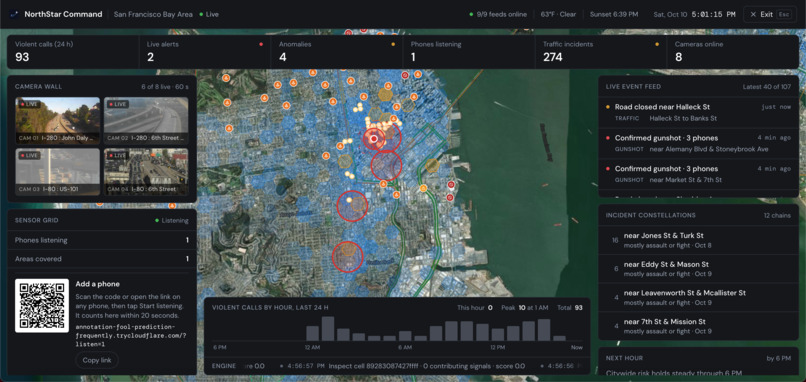
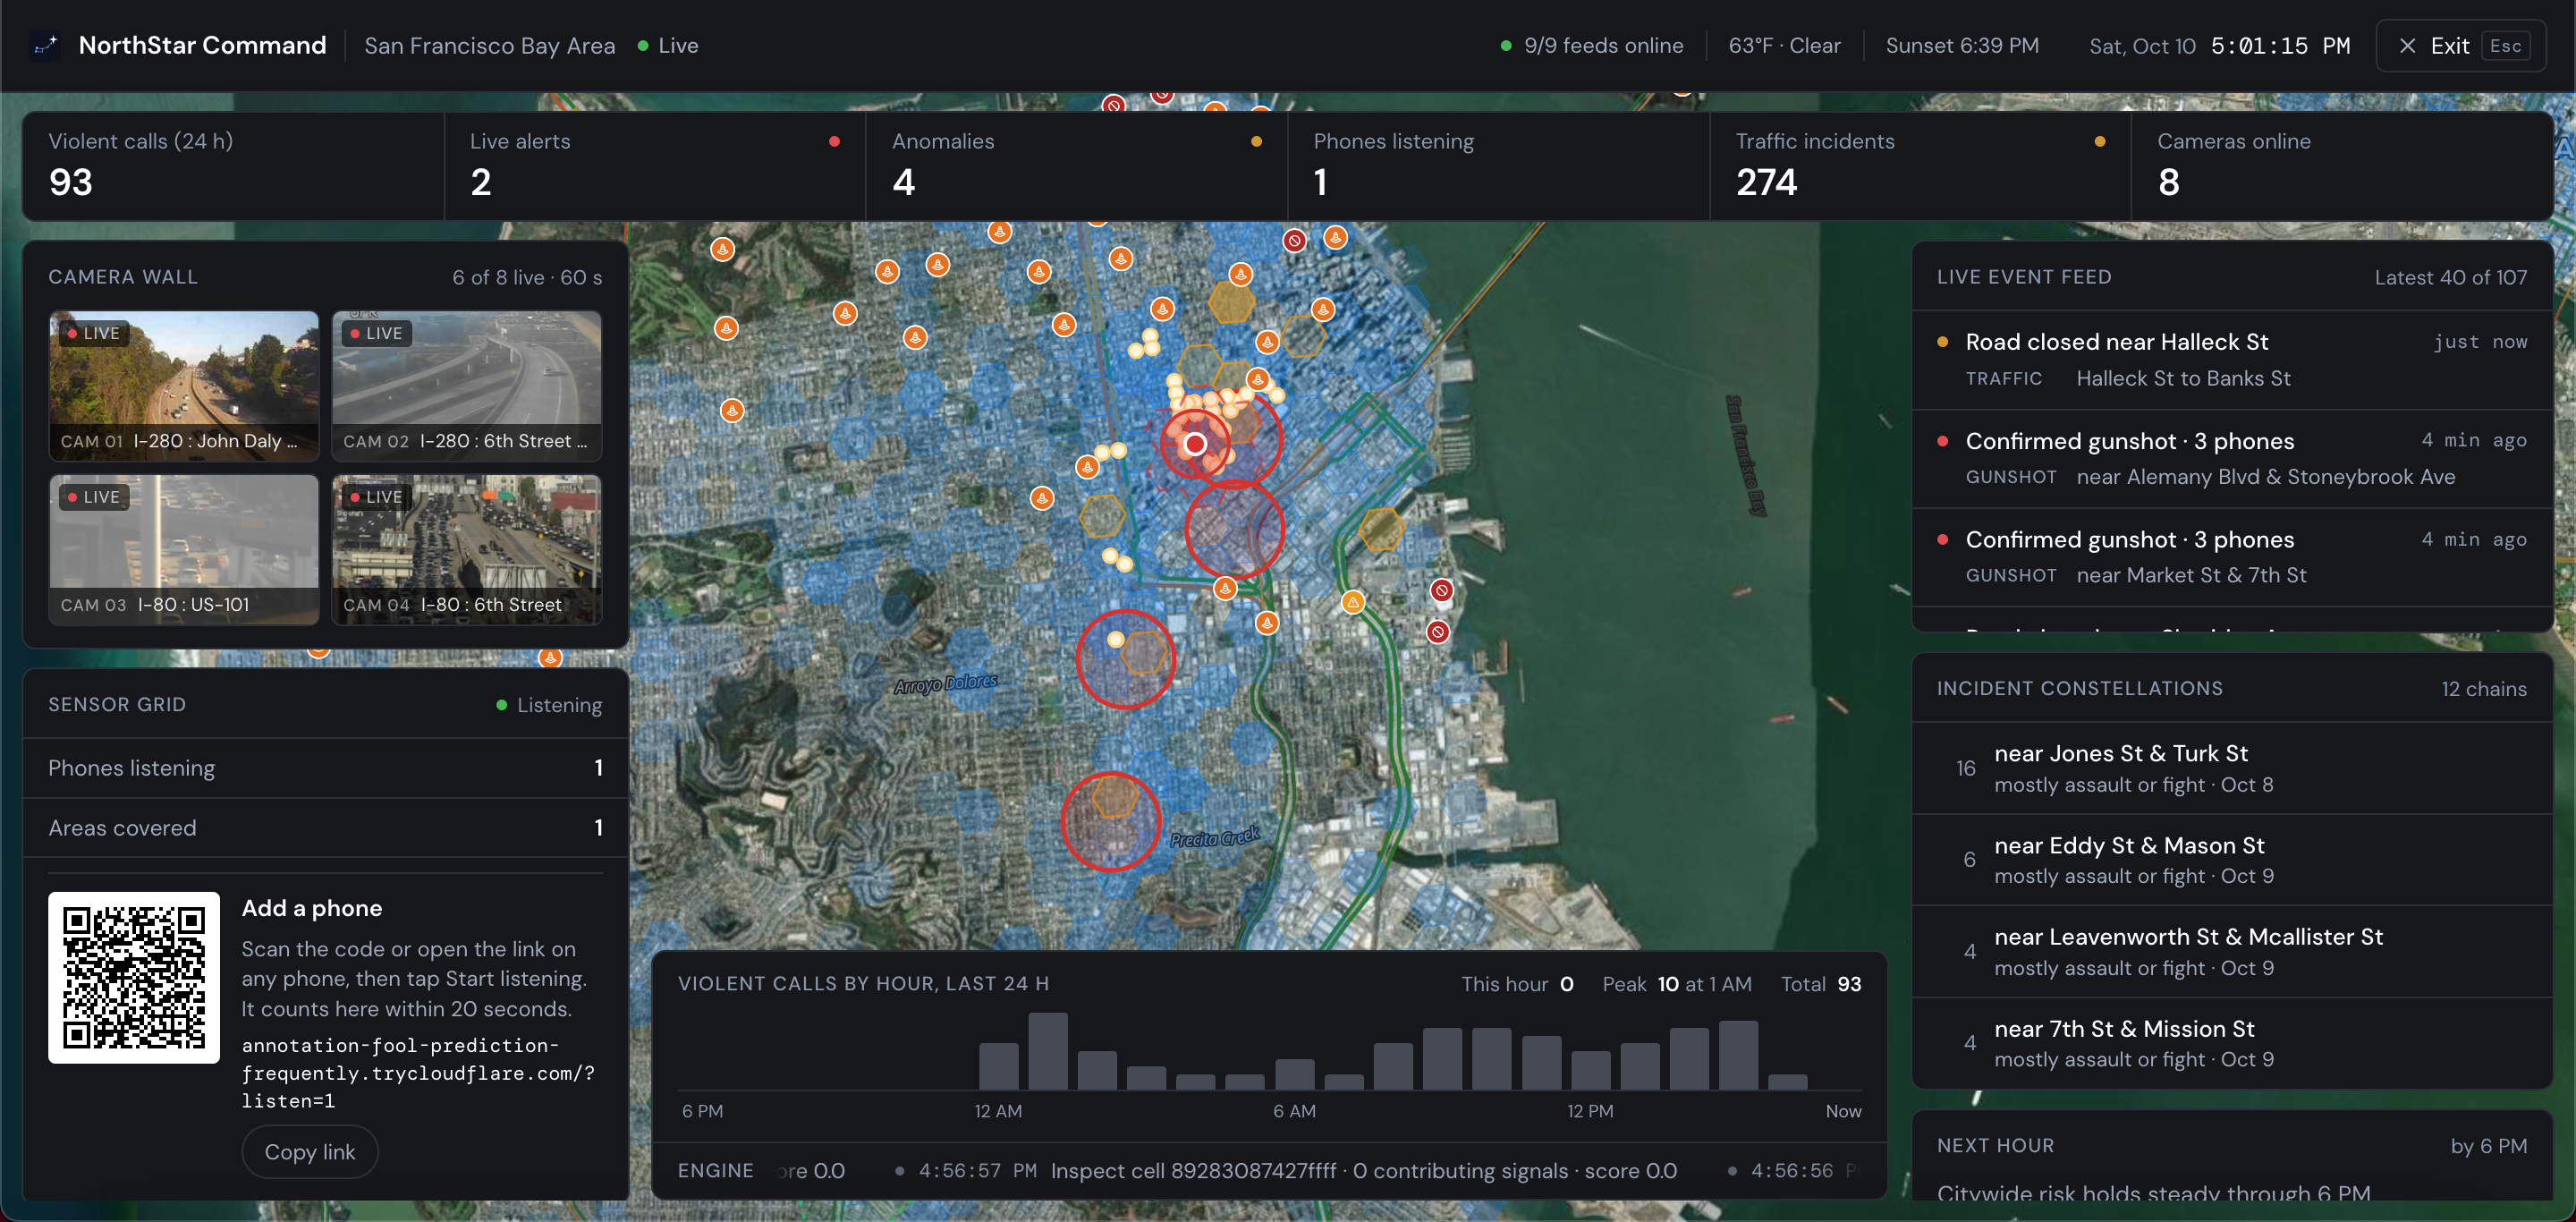
the NorthStar command center displays every live and historical source we use, including live police reports, cameras, satellite imagery etc
-
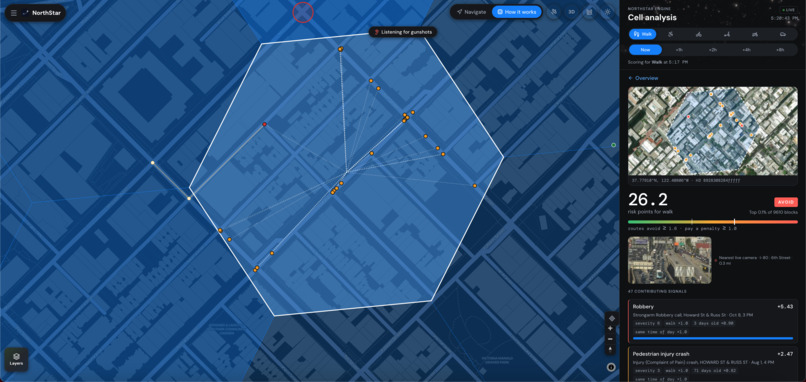
Our innovative risk calculation formula uses live and historical data to create an accurate risk calculation for every mode of transport.
-
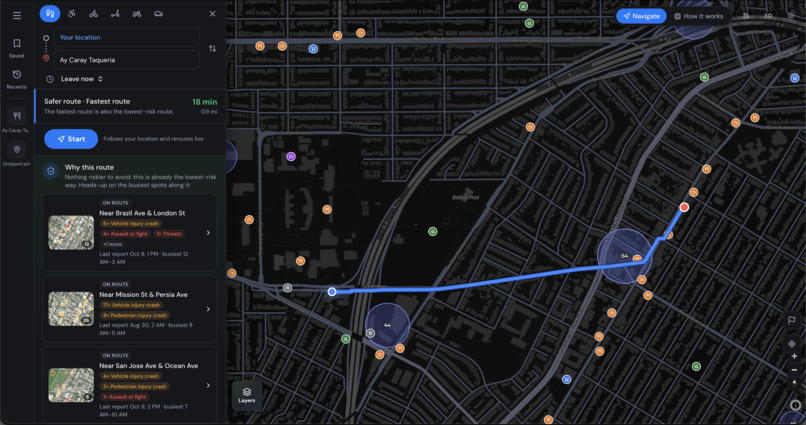
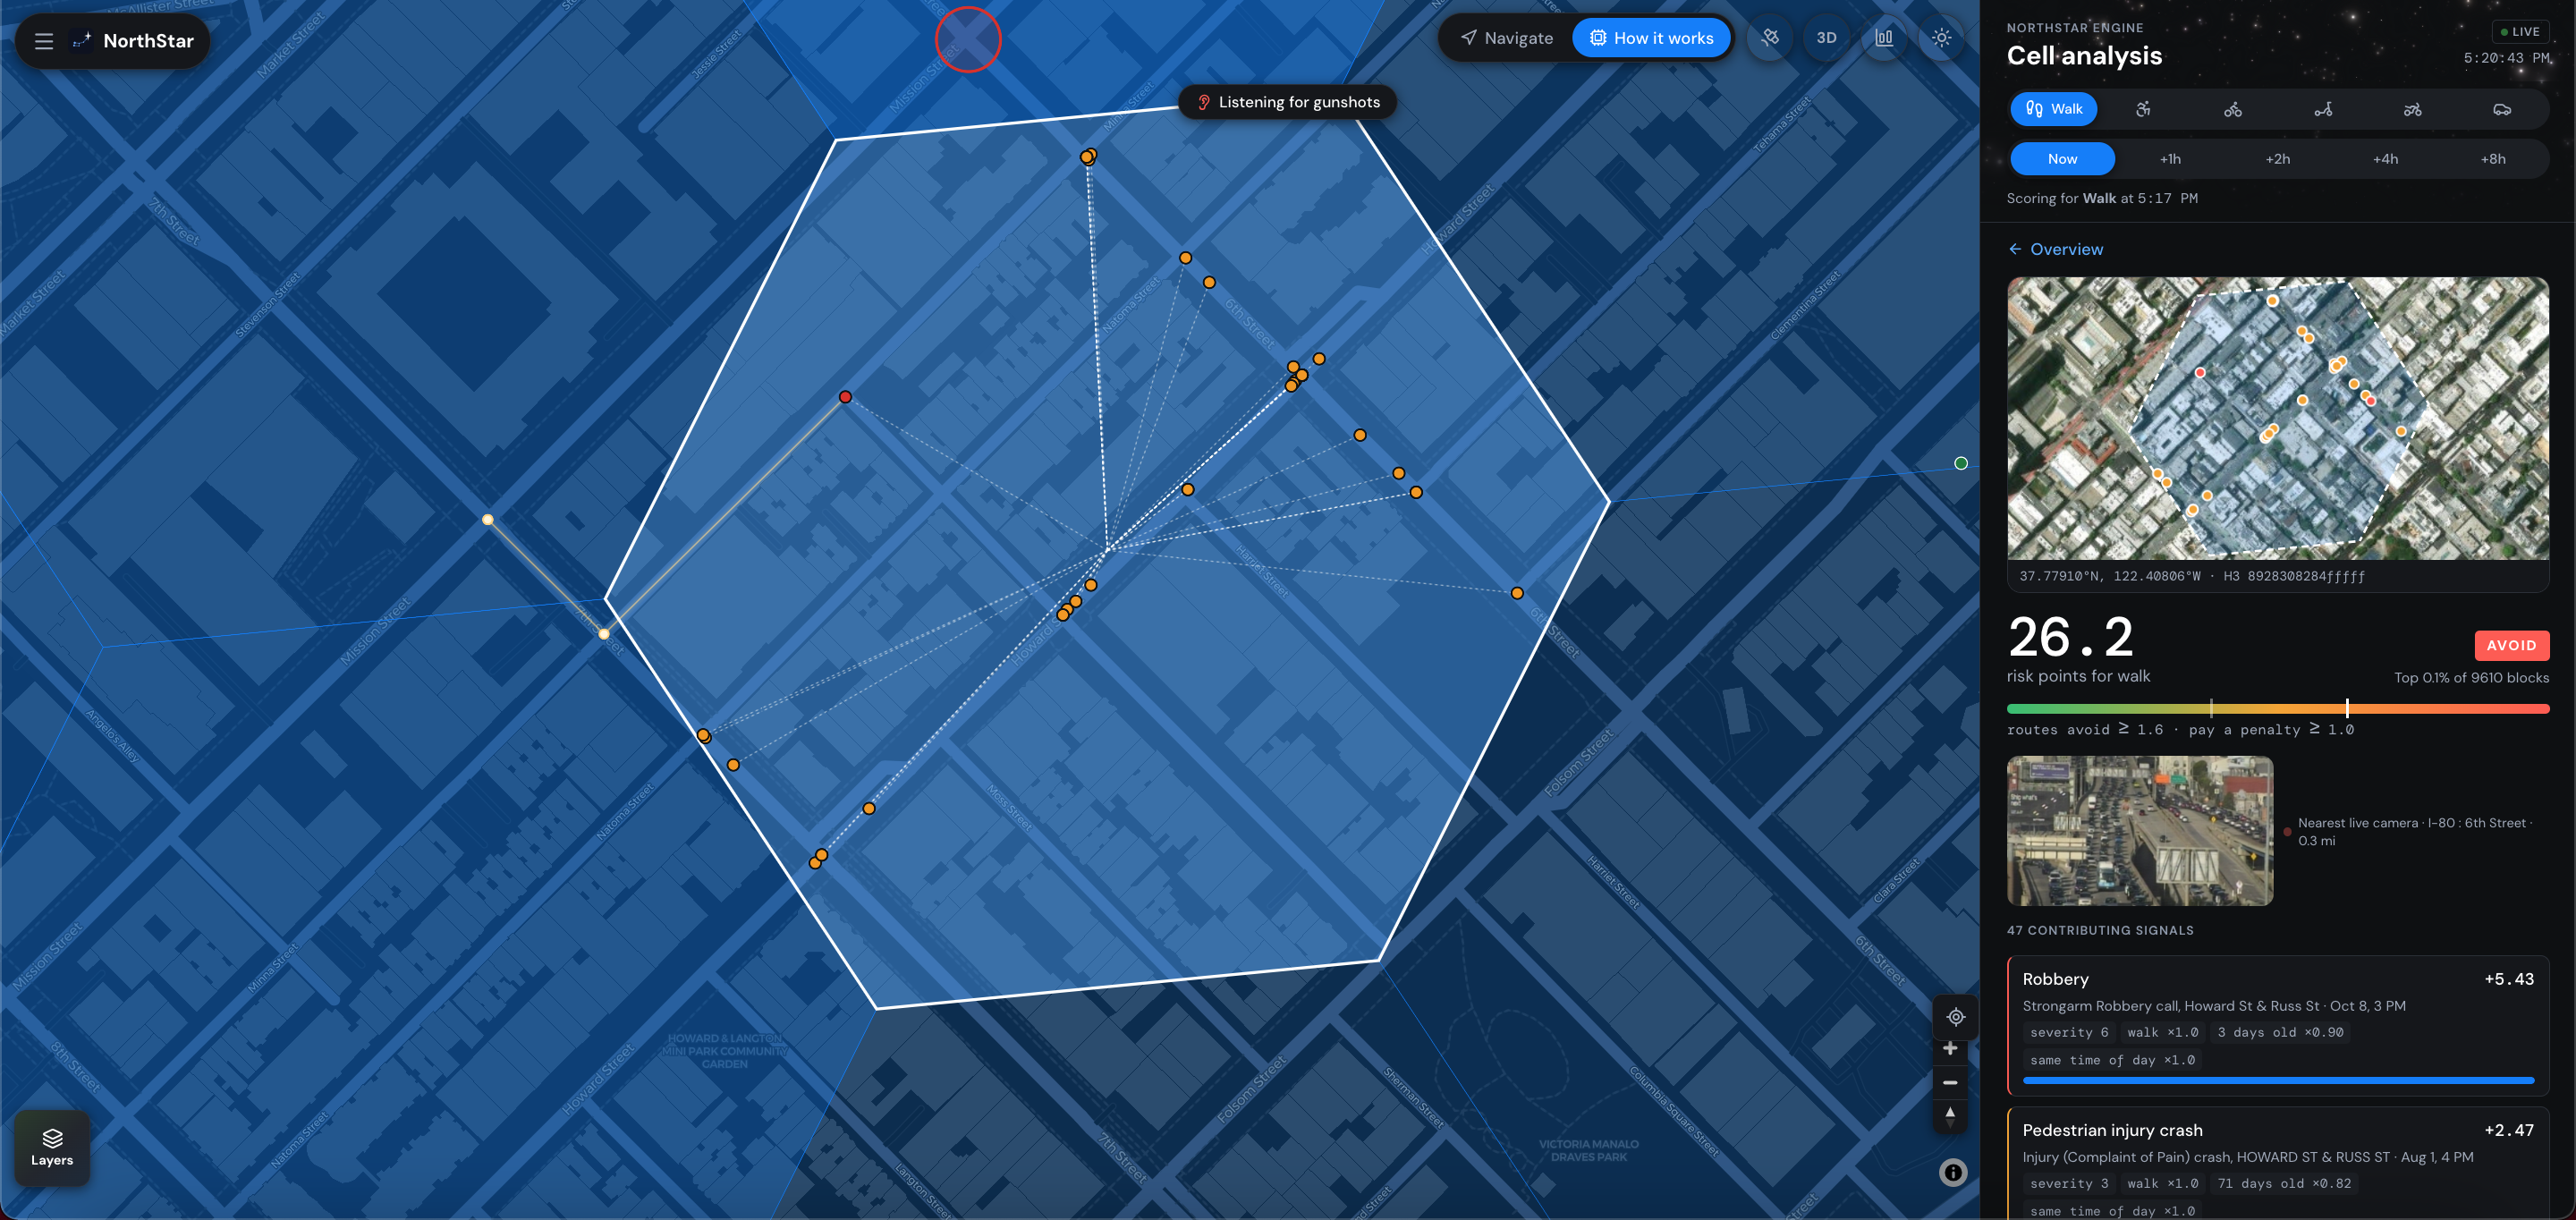
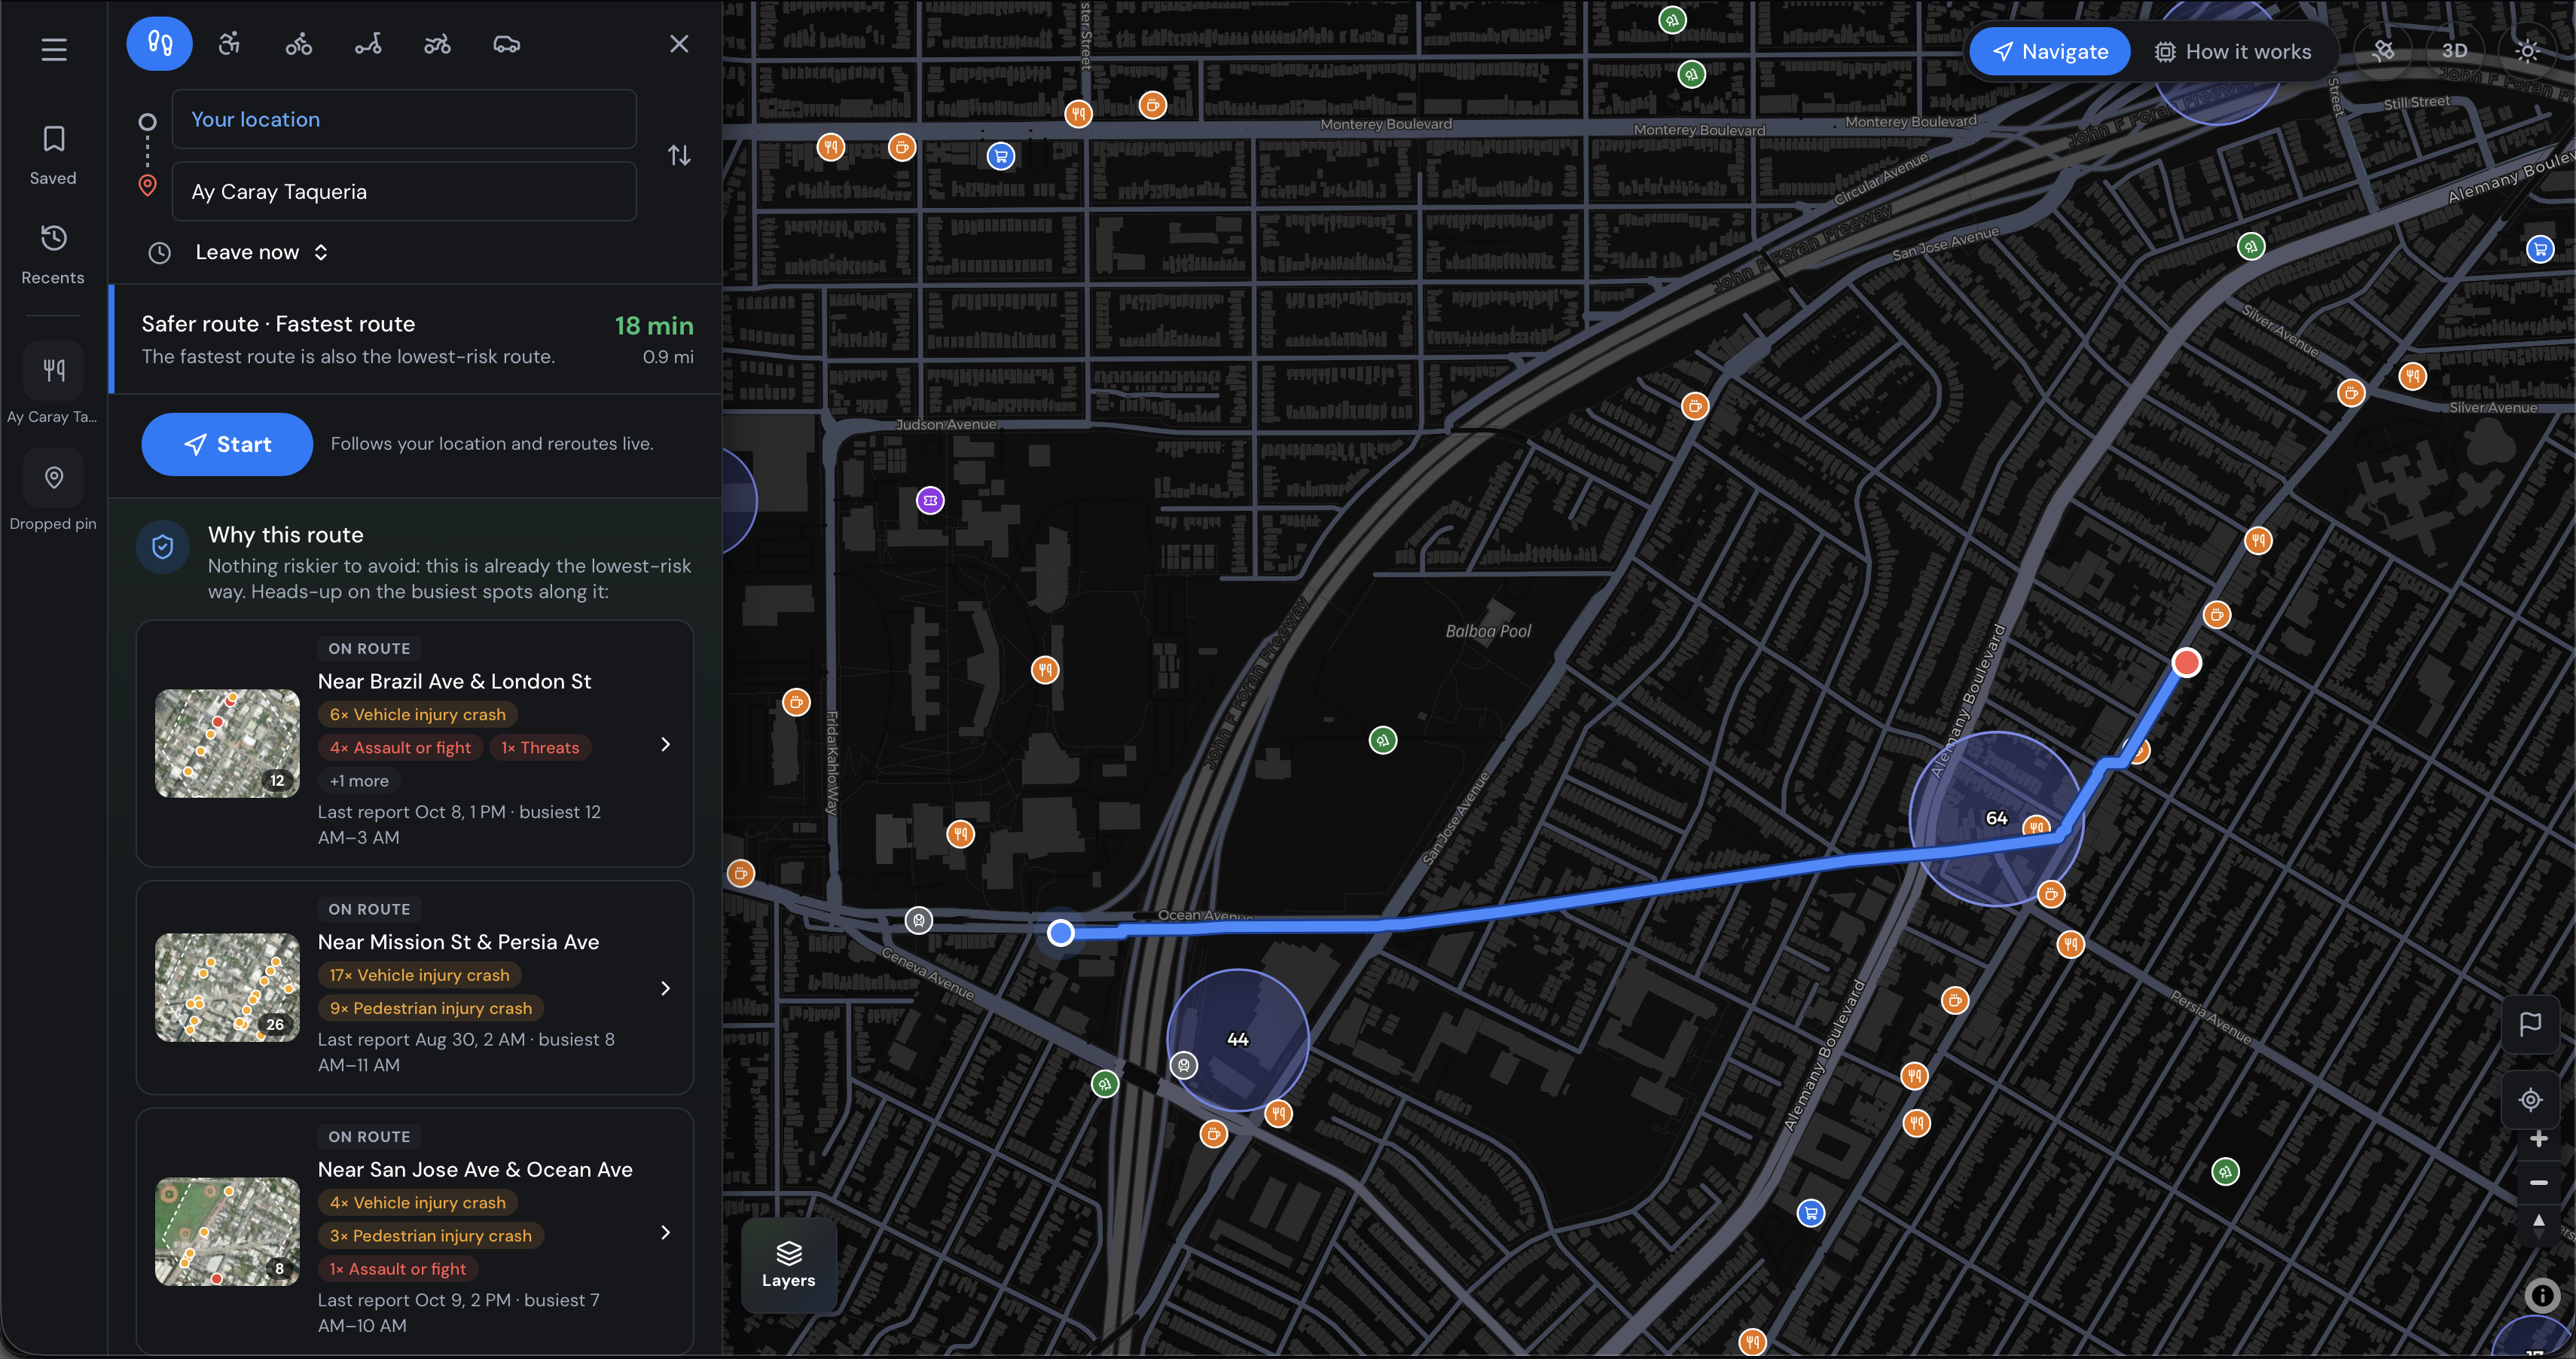
NorthStar shows the fastest and safest route calculation, showing you why it chose that route, sourcing live camera feeds, police, etc.
-
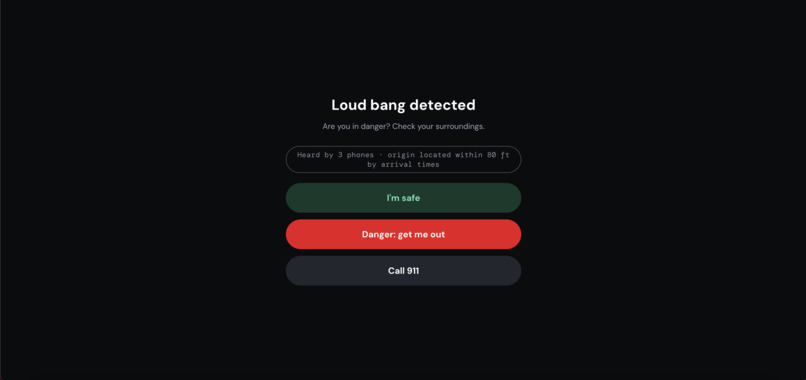
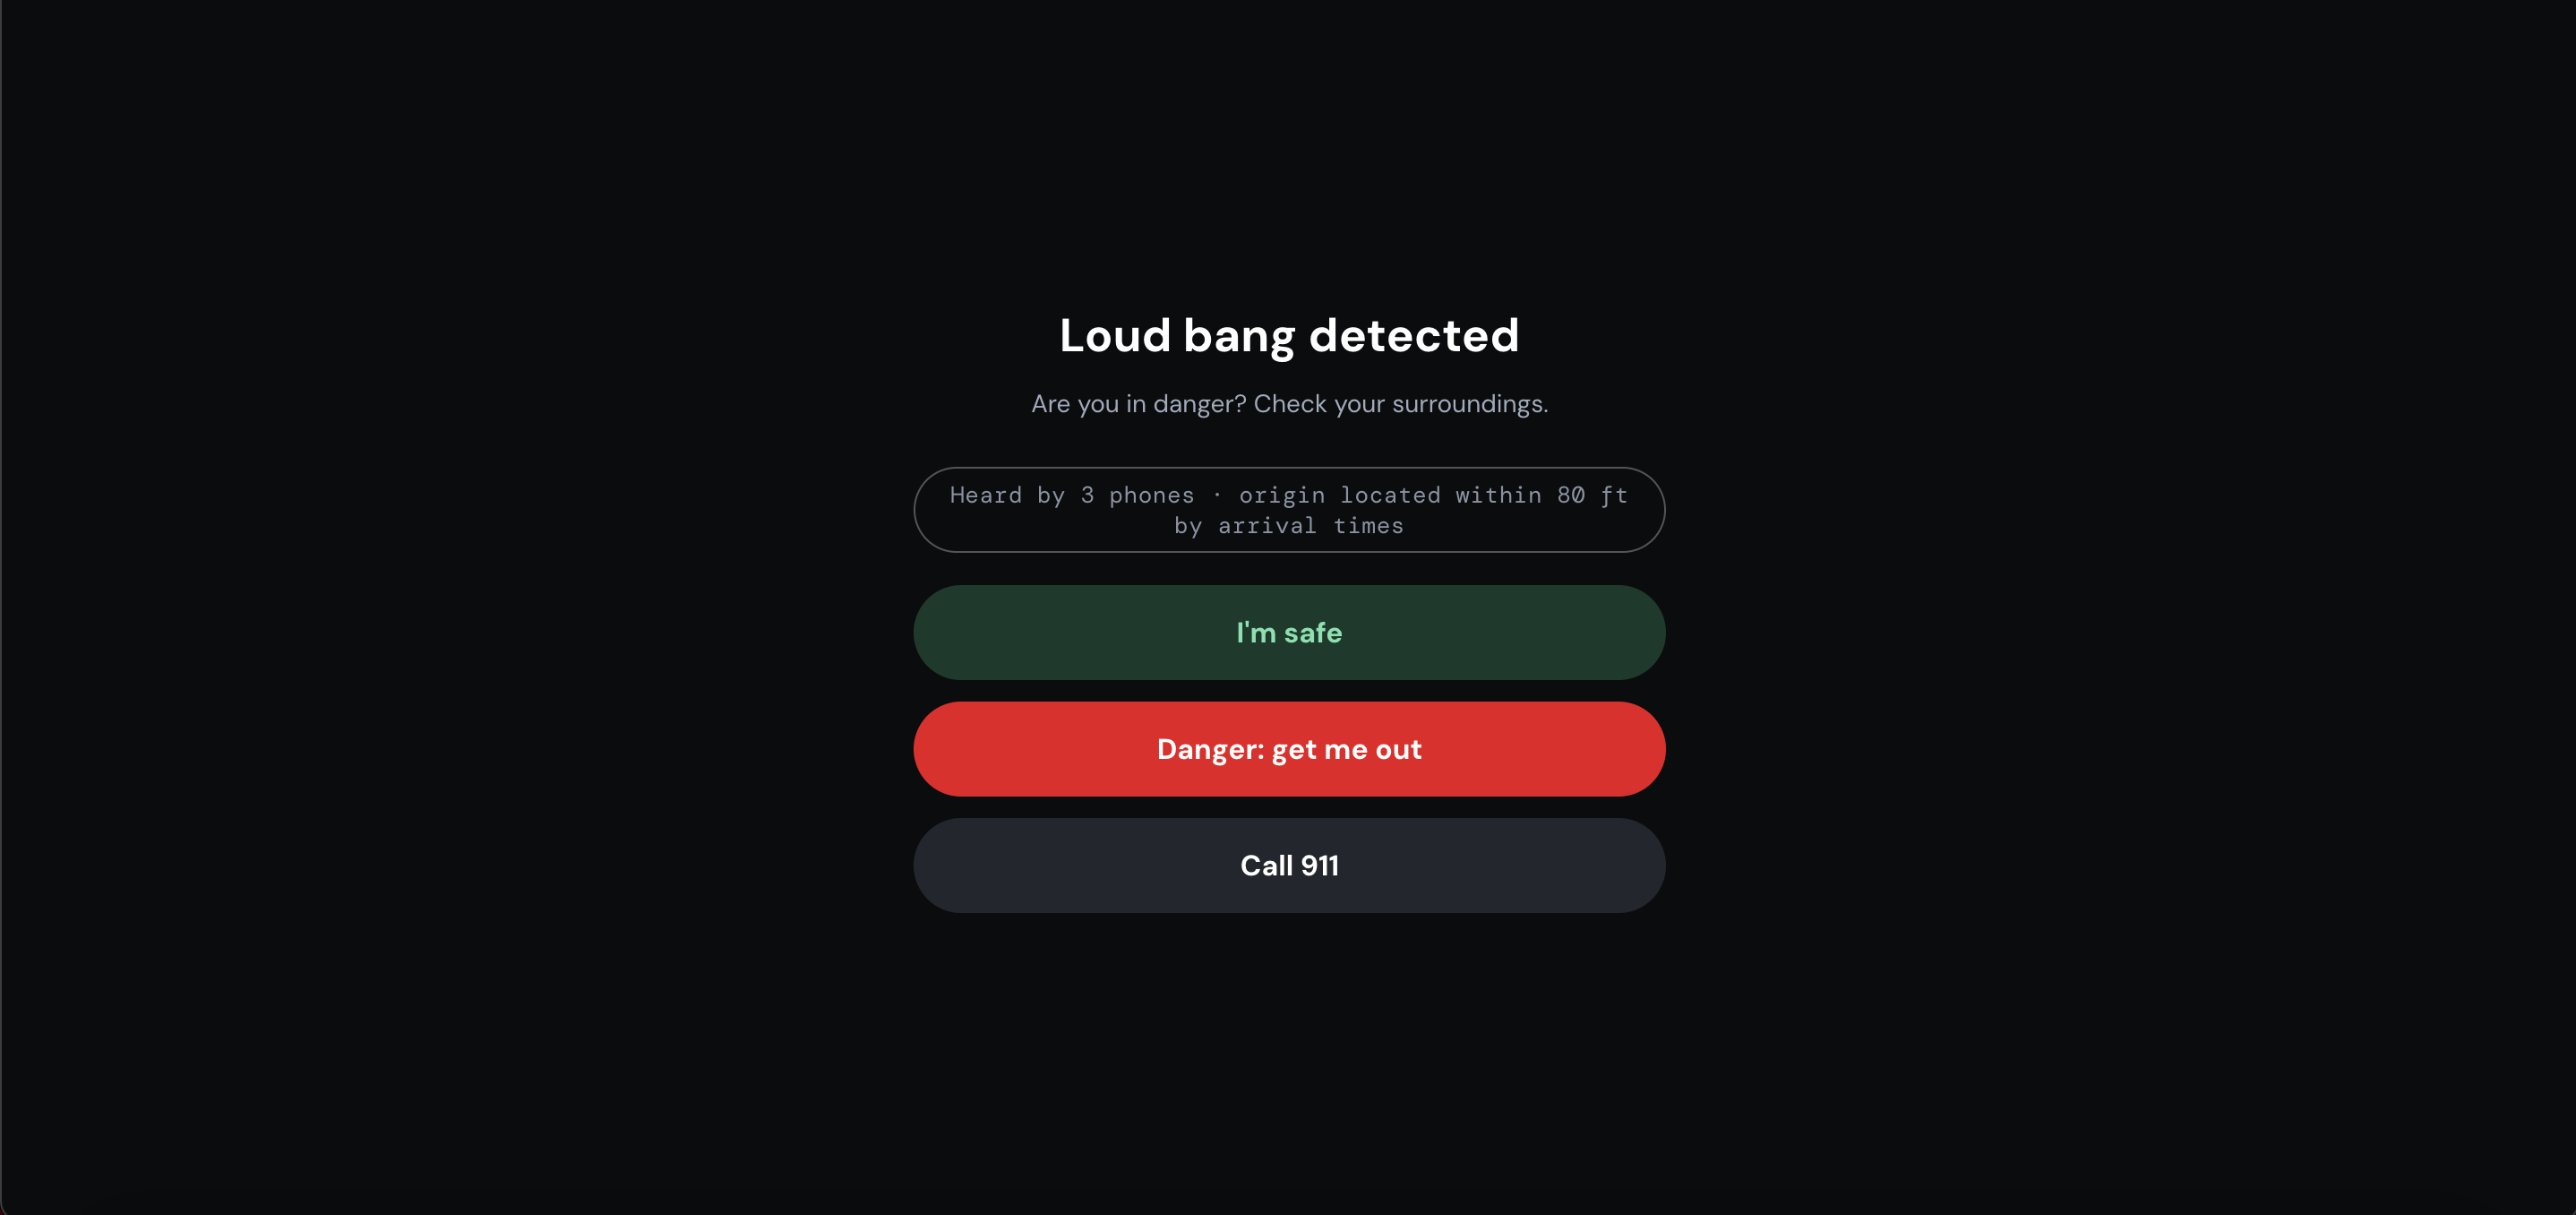
NorthStar uses acoustic triangulation and sound recognition to prompt the user on their status and reroute to avoid danger.
Inspiration
Most map apps pick the fastest route and ignore safety. But risk depends on how you travel and when. A block that's fine in a car at noon can be a bad choice on an e-scooter at night, and a wheelchair user faces different hazards than a driver. We wanted a navigation app that treats safety as part of the route for everyone, and explains why it chose what it did. We named it NorthStar: safer routes for every way you move.
What it does
NorthStar scores every block of the Bay Area for your travel mode and time of day, routes around the riskiest blocks, and tells you why. We started in San Francisco and expanded across the Bay Area.
Navigation:
- Six travel modes: walking, wheelchair, bike, e-scooter, moped/scooty and car, each with its own risk weighting
- A recommended safer route (with the % risk reduction) next to the fastest one, and you can switch between them
- "Why this route" cards that cite the real records behind each avoided spot
- A best time to leave chart for now through +3 hours, with the lowest-risk time highlighted
- Live TomTom traffic for car and moped drive times, and routes that skip roads closed right now
- After sunset, walking, wheelchair, bike and scooter routes treat blocks with broken streetlights as extra risk
- Live Caltrans cameras and lane closures for car and moped trips
Live gunshot alerts:
- Phones can listen for gunshot-like bangs during a route, and nearby routes bend around a confirmed event within seconds
- The area around a gunshot becomes a no-go zone, so routes go around it even when that takes much longer
- When two or more phones hear the same bang, we triangulate where it came from using the differences in arrival time and draw an error circle
The "How it works" tab, where the scoring engine runs live:
- Click any spot to see its score built event by event, with its rank and its AVOID, PENALIZE or CLEAR decision
- Incident constellations link violent incidents close together in space and time
- A next-hour forecast shows which blocks are getting riskier
- A live anomaly watch flags areas with 3 times their normal rate of violent calls
- A command center puts the whole city on one screen, with live stats, a camera wall, a merged event feed and a 24-hour call chart
- Replay 7 days plays back a week of incidents hour by hour
- A 3D skyline turns every block's risk into a column
Everywhere:
- A 3D mode with real terrain, lit buildings and sky, which also works on satellite imagery
- Light and dark mode, multiple languages, large text, high contrast, and offline support
How we built it
NorthStar is built with Next.js, React and TypeScript, with MapLibre GL for the map and 3D terrain from AWS Terrain Tiles.
Risk model: we divide the map into H3 hexagons. The risk of each hexagon adds up every event inside it:
risk = sum of (event weight × travel-mode multiplier × age decay × time-of-day factor)
A route's total risk then weights each hexagon by the minutes you spend in it:
route risk = sum of (hexagon risk × minutes in hexagon)
Data: police dispatch calls (violent types only) and injury crash records feed the scores, along with San Francisco 311 streetlight outage reports. We began with San Francisco's public data and expanded to the wider Bay Area.
Routing: a Next.js API route calls a public Valhalla server running on OpenStreetMap data, with one costing model per travel mode. The riskiest hexagons are sent as avoid polygons.
Traffic: TomTom live speeds and incidents power car and moped drive times, and the server keeps our API key private.
Live alerts: two phones within 3 seconds and half a mile confirm an alert, and community reports count once 3 people agree. Each phone times the sound's arrival to the millisecond on a server-synced clock, so the server can locate the bang from the time differences, since sound travels about 343 meters per second.
Sound detection: it runs entirely on the phone. A loudness spike triggers Google's YAMNet classifier in TensorFlow.js, and gunfire has to beat fireworks to count. Audio is never recorded or uploaded.
Privacy: everything works on events and places, never on people. There are no faces, plates, identities or individual tracks, and phone locations are only shared rounded to a small area.
Offline: a service worker caches the app, the risk data and the map tiles you've seen.
Challenges we ran into
Our directions didn't work well at first, because they didn't use real traffic data. Our estimated travel times came out much shorter than the real ones on Google Maps. We fixed it by adding TomTom live traffic, so car and moped drive times now reflect current congestion and closed roads.
We also ran into a few others:
- Sparse, delayed data: public feeds like San Francisco's have only about 300 located dispatch calls a month, so the data is recent, not live.
- Scaling to the Bay Area: every city publishes data differently, so expanding meant pulling in and cleaning more sources.
- Fireworks vs. gunfire: a loudness trigger alone would fire constantly, so a classifier separates them and multiple phones must agree before anyone is alerted.
- Clock sync for triangulation: locating a bang depends on every phone's clock and GPS being accurate, so we show an error circle instead of a single pin.
- Phones need HTTPS: the microphone and location only work over HTTPS, so we tunneled our server for demos.
Accomplishments that we're proud of
We're very proud of the UI of the app and of how well the How it works tab turned out. That tab is the scoring engine, running live, so nothing about the safety score is a black box:
- Click anywhere on the map to see that spot's score built up event by event: weight × mode × age × hour.
- Rank: see how that spot compares with every other block.
- The decision: each spot is labeled AVOID, PENALIZE or CLEAR, and you can see why.
- A live event log: every route request, avoid zone and live alert shows up as it happens, so you can watch the system react in real time.
- The command center and 7-day replay turn the same data into a city-wide picture, and the 3D skyline makes risk easy to see at a glance.
We're also proud that we grew from one city to the whole Bay Area during the hackathon, and that we built real acoustic triangulation with on-device privacy. The safer route isn't just a claim. You can open it up and check the math behind every choice.
What we learned
We learned how to work with advanced datasets, including live traffic, satellite imagery and terrain, and how to build in 3D. We also learned that safety depends on the mode of travel and the time of day, that showing the records behind a recommendation makes it far more trustworthy, and that on-device machine learning can be accurate and private at the same time.
What's next for NorthStar
- Secure access to private satellites. We want to partner for access to commercial satellite imagery, so we can spot incidents and changing conditions from above and keep our safety picture fresh.
- Expand our database for better information. Today we rely on public feeds that are recent but not live. We want to pull in more and fresher sources so every block's score is more accurate.
- Expand into more dangerous countries. The Bay Area is our proving ground, but NorthStar could matter far more in places where travelers face greater risk and good safety information is hard to find. There, a route that avoids danger and explains why could be genuinely life-changing.
- Grow the community reporting layer and the network of listening phones, and add more languages and accessibility profiles, which matter most when we reach new countries.
Built With
- caltrans
- cloudflare-tunnel
- datasf
- h3
- lucide
- maplibre-gl
- next.js
- node.js
- openstreetmap
- react
- service-workers
- tensorflow.js
- typescript
- valhalla
- webgl
- yamnet


Log in or sign up for Devpost to join the conversation.