-
-
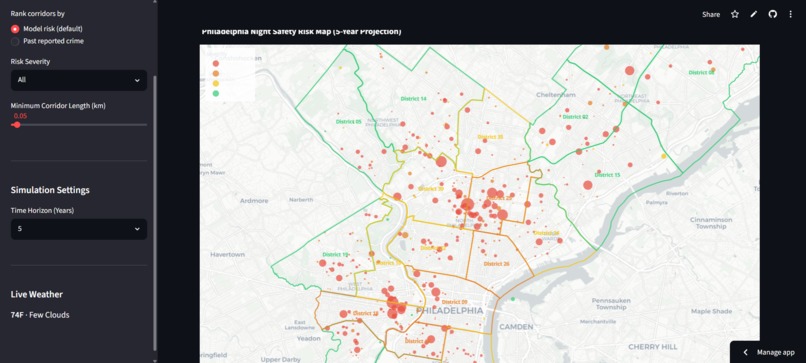
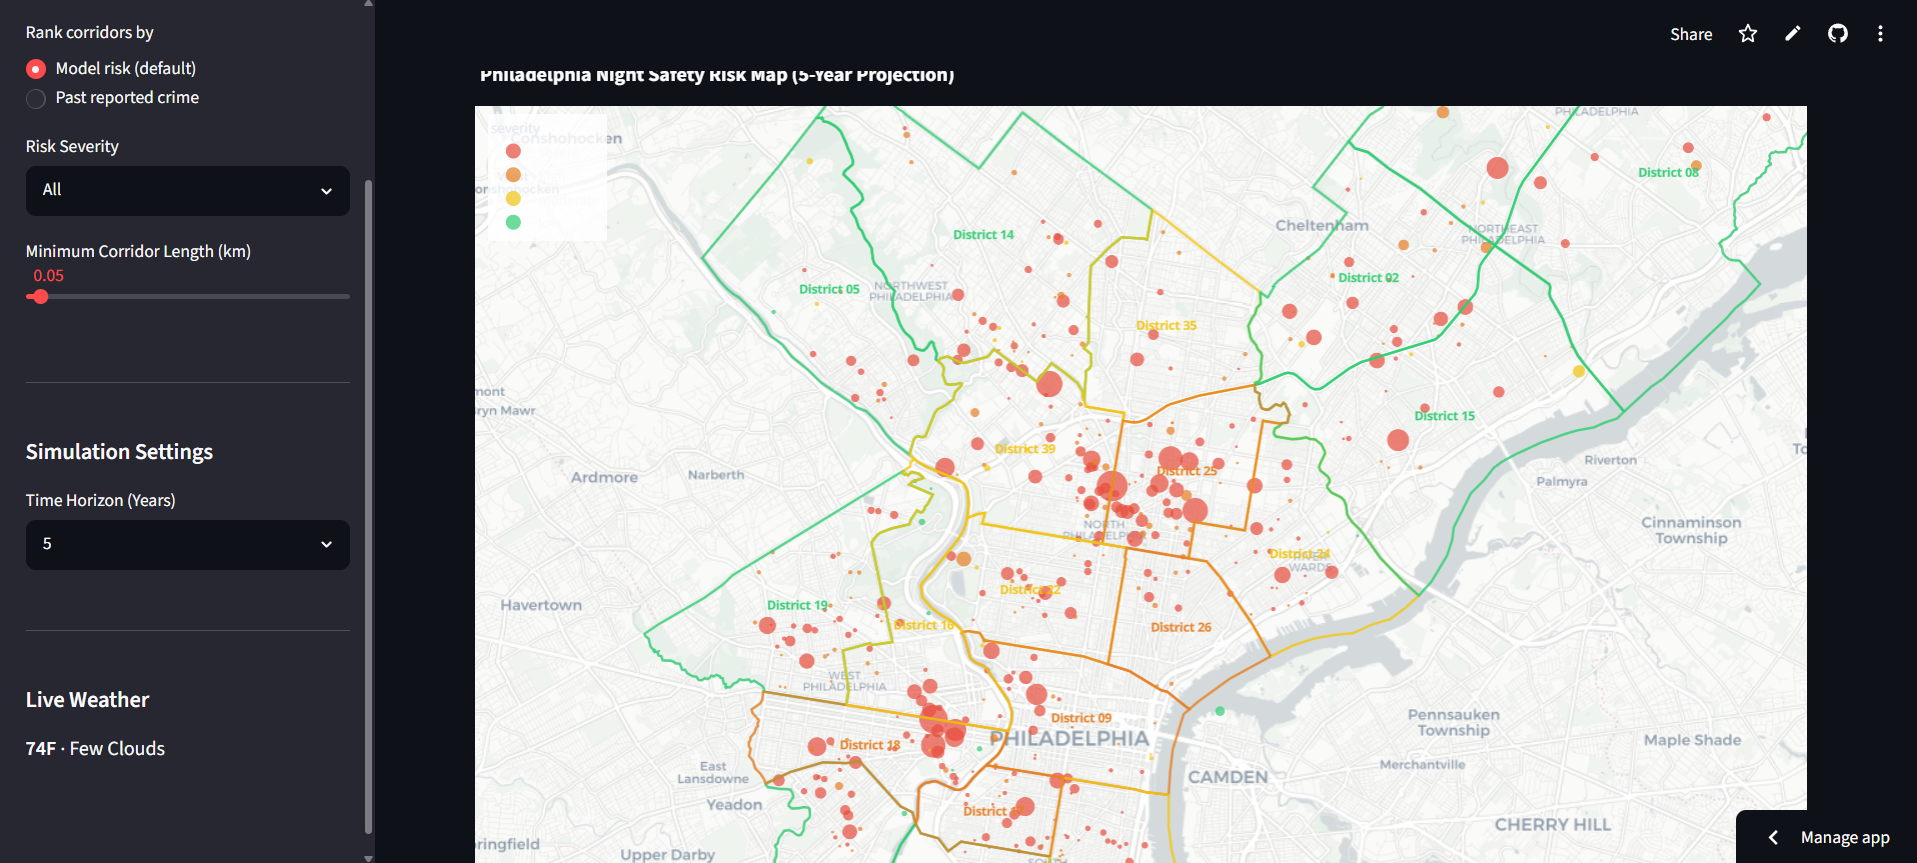
The interactive map
-
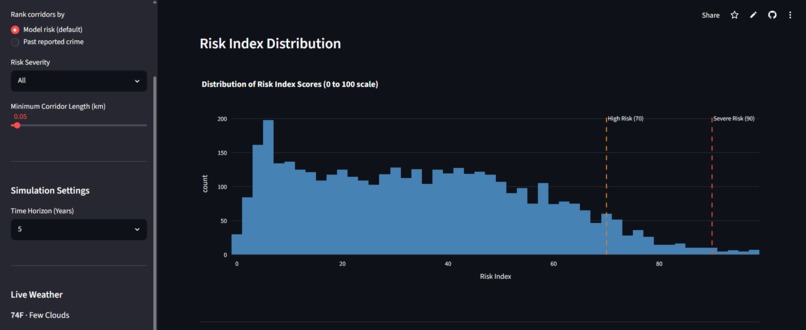
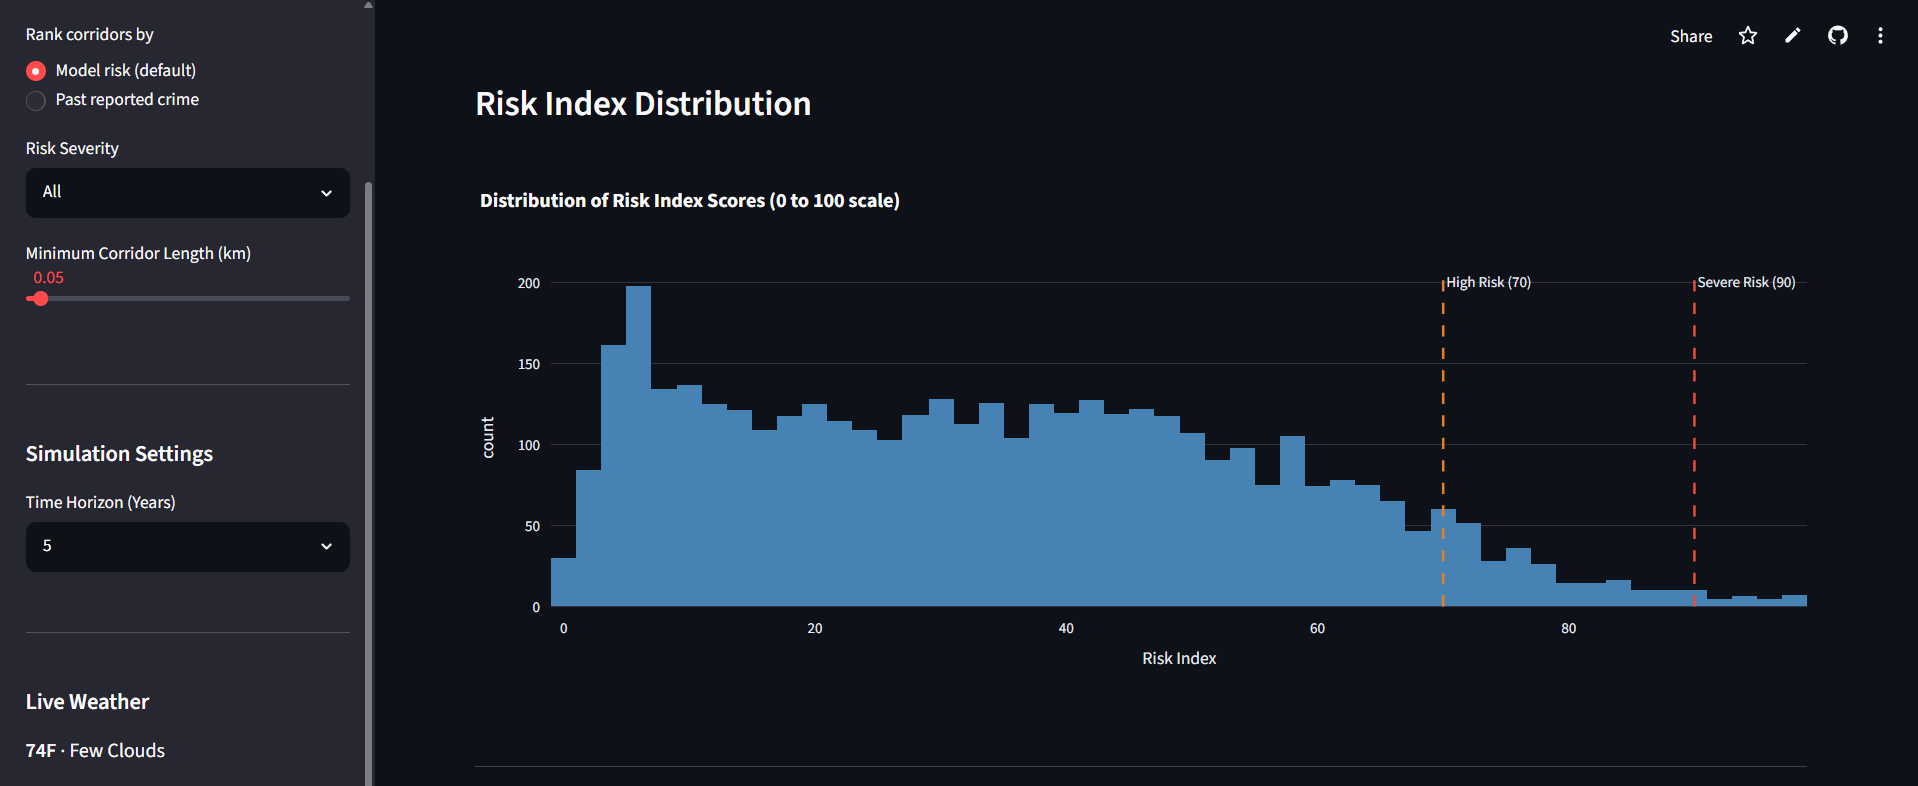
Risk Index Distribution
-
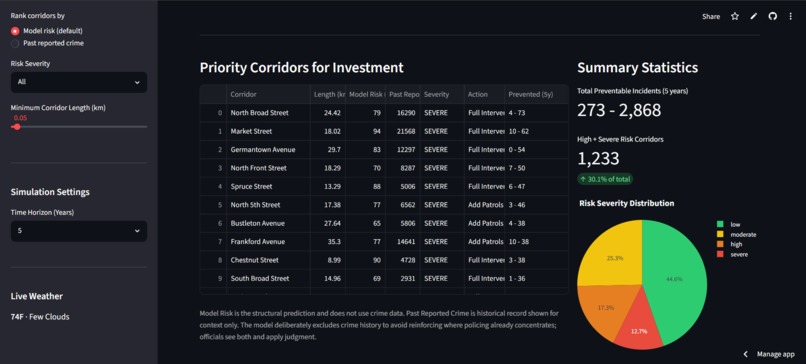
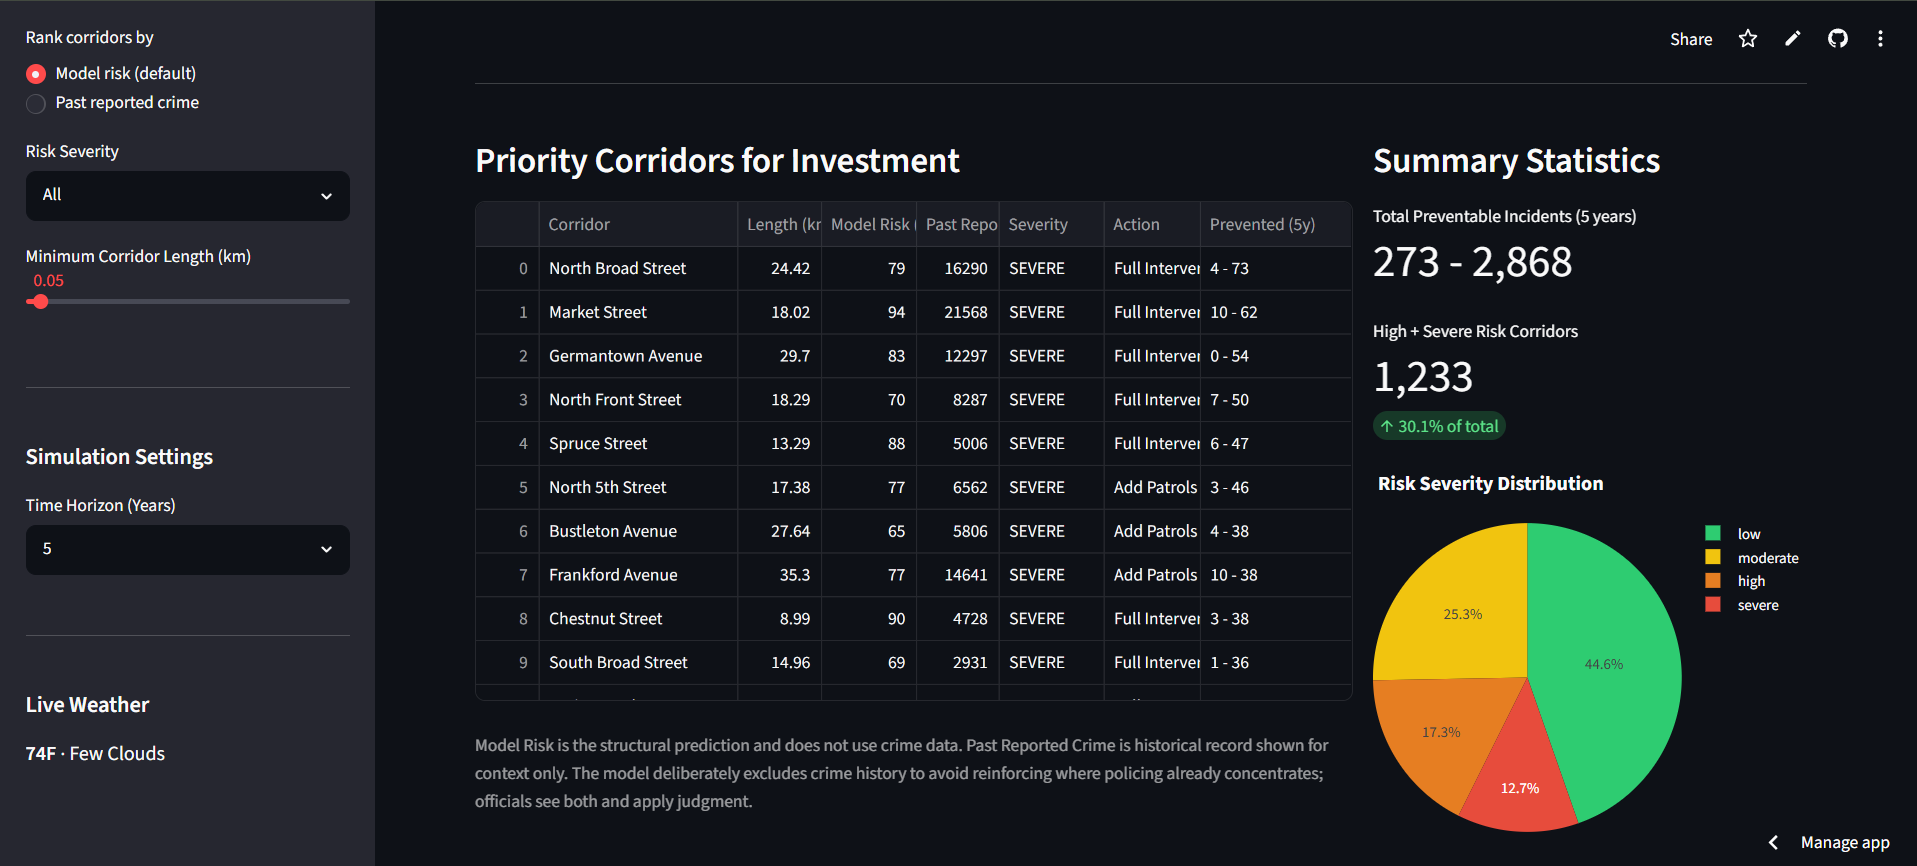
Priority Corridors for Investment
-
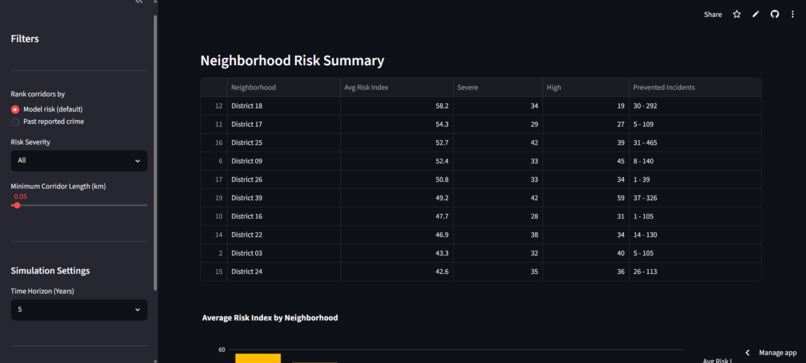
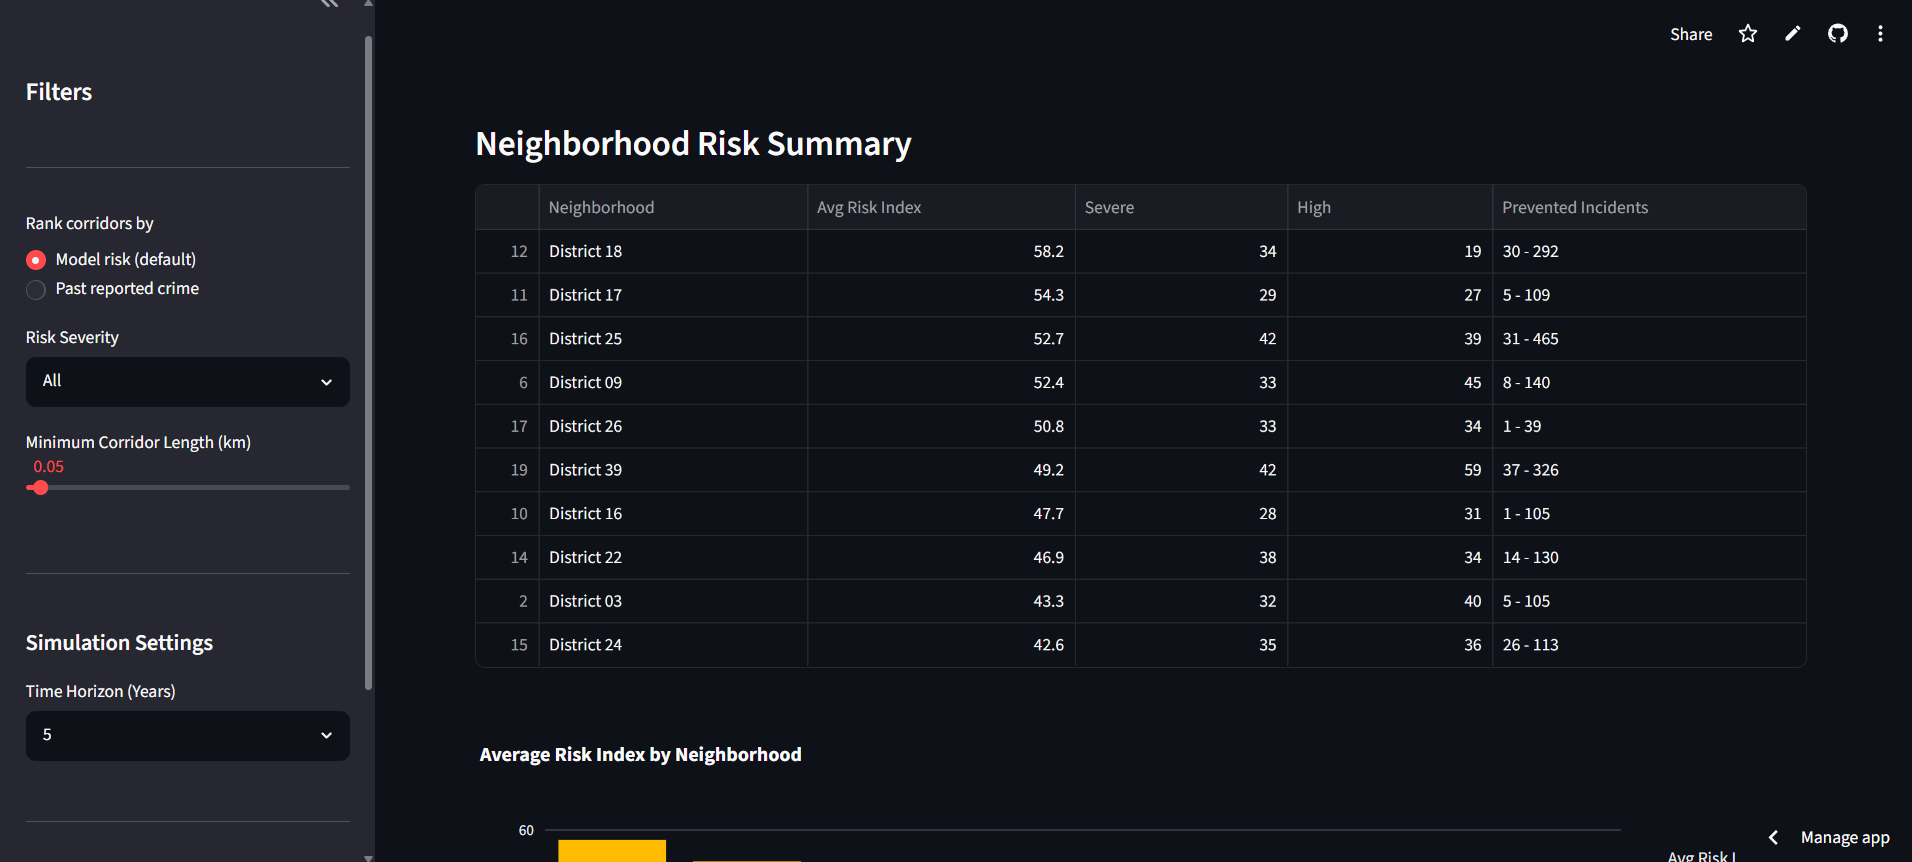
Neighborhood Risk Summary
-

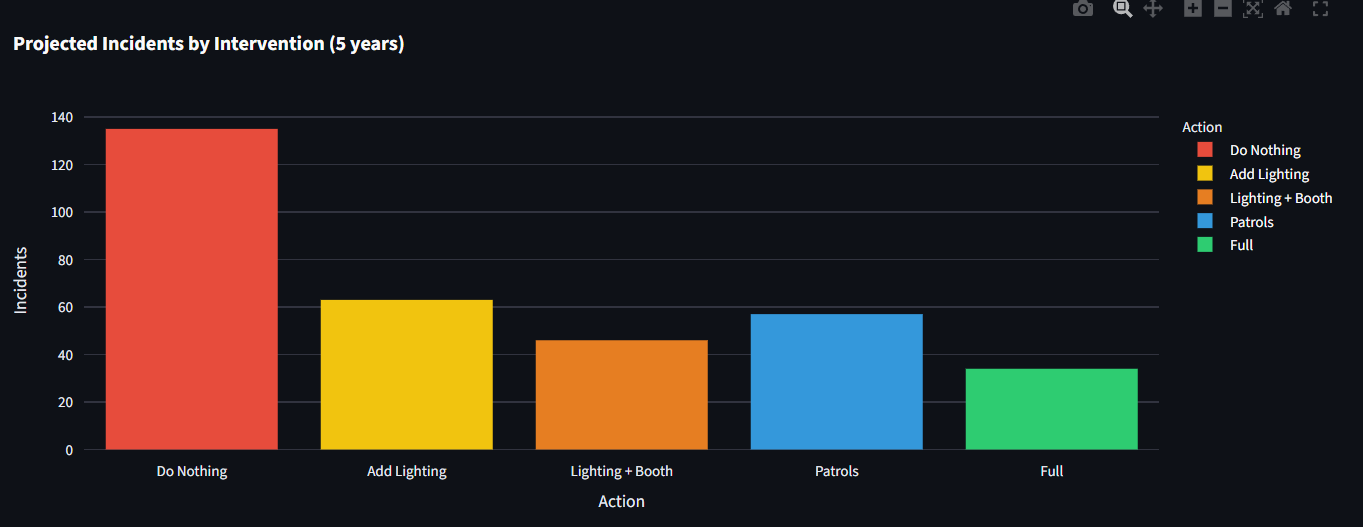
Projected Incidents by Intervention
-
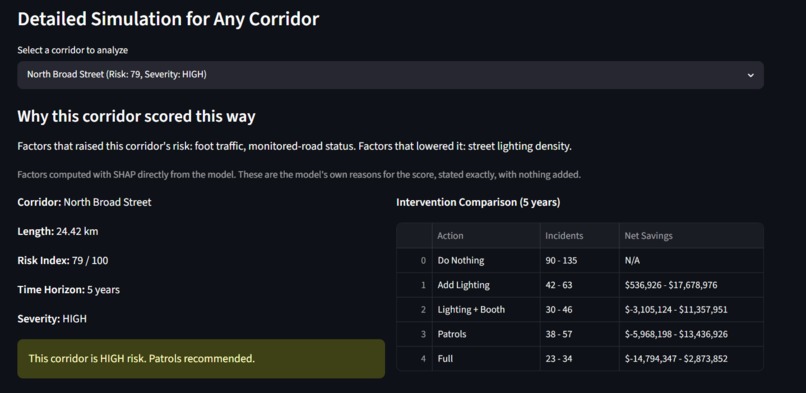
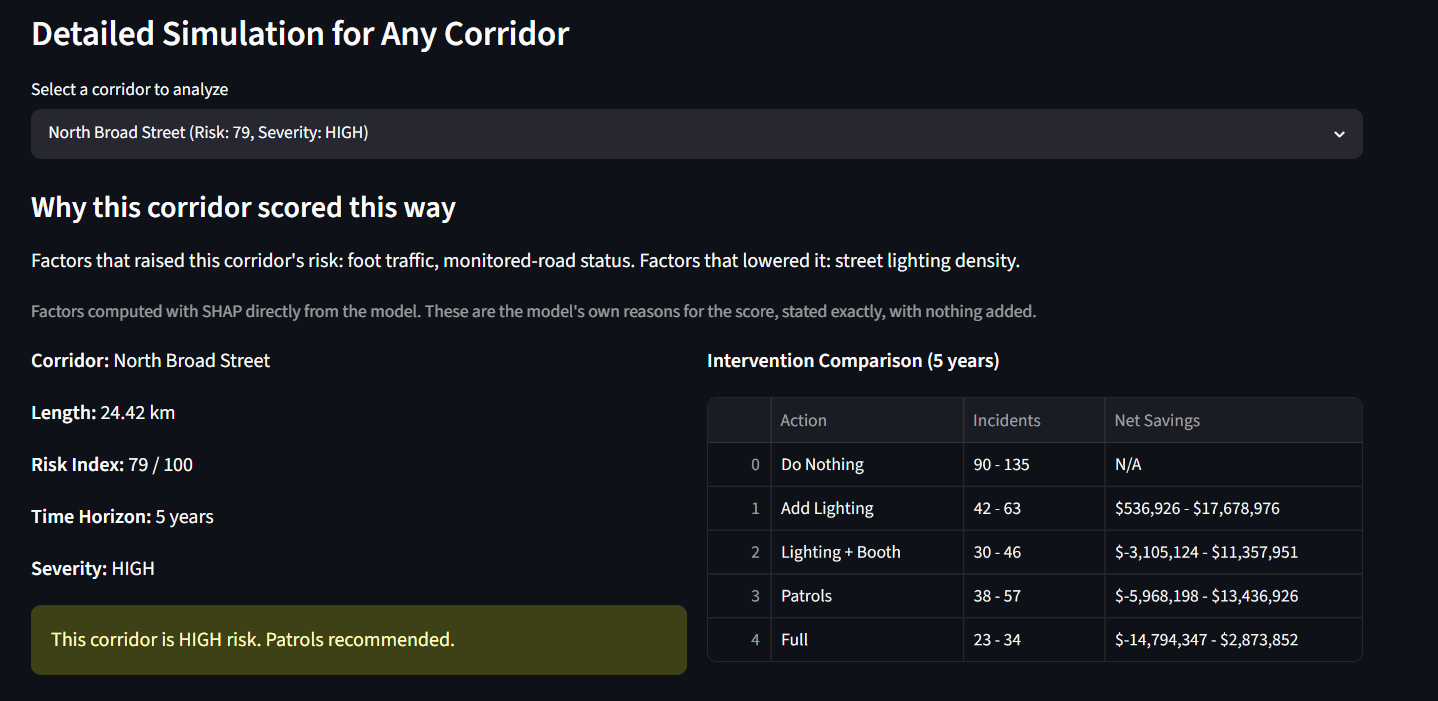
the SHAP explanation panel per corridor
Inspiration
Cities have so much money for night safety, and lighting, patrols, and call boxes all cost more than any budget can cover everywhere. So how does a city decide which streets to fix first? The usual approach is to look at where crime has already been reported and send resources there, but that mostly directs help back to wherever police were already watching, and it doesn't say much about where the next problem will be. We wanted to help a city planner answer a better question: given a fixed budget, which streets are actually worth investing in, and what does it cost to keep waiting? That question became NightSafe.
What it does
NightSafe scores every street corridor in Philadelphia for night-safety risk, around 4,100 of them, on a scale from 0 to 100. What makes it different is where the score comes from. It rates risk from the street itself, things like how long it is, how well-lit it is, how many poles it has, how far it sits from the nearest police station or hospital, how many controlled intersections it has, and its real traffic volume. It never uses past crime to build the score, which is a deliberate choice so that it doesn't simply point back to where police already were. It then runs a "cost of doing nothing" simulator. For each street, it projects the incidents and dollar costs of five choices, ranging from doing nothing to adding lighting, a call box, patrols, or the full package, across one, three, and five years. Every figure is given as a range rather than a falsely precise number, so a planner can see what waiting will cost and what each fix would save. Each score also comes with a plain-language explanation of why that street rated the way it did, and everything lives in a dashboard with an interactive map, side-by-side comparisons, and cost-benefit charts.
How we built it
We brought together ten public datasets, including Philadelphia crime records from 2022 to 2026, OpenStreetMap roads, street poles, police stations, hospitals, intersection controls, PennDOT traffic counts, and Census income, and joined them onto roughly 61,000 road segments that we then grouped into corridors. The model is an ensemble that combines a Random Forest, XGBoost, LightGBM, and a neural network. We trained it on crime from 2022 to 2024 and asked it to predict 2025 to 2026, a period we already have data for, so that we could honestly measure whether it works. It lands at an R² of 0.26 and a recall of 0.33. On top of the model, SHAP explains why each street scored as it did, and a Streamlit dashboard ties the scoring, the simulator, and the explanations together into one tool.
Challenges we ran into
Our hardest challenge was data leakage, and we ran into it three separate times. Our very first model scored much higher than it should have, and that high score turned out to be a lie, because one of our features had been built from the exact thing we were trying to predict, so the model was effectively peeking at the answer. We caught it and removed it, and then found two more of the same kind. One was income, which meant the model had quietly learned to treat "poor" as "dangerous," and the other was a weather feature that was also derived from the days crimes occurred. After the first leak, we made a rule for ourselves: test every new feature against crime before trusting it, and we ran that check on everything from then on. Patchy data was another challenge. PennDOT only measures traffic on about 60% of streets, mostly the larger ones, so rather than pretend the rest were real measurements, we added a flag that tells the model which numbers are measured and which are filled in. We also had to be honest about what the tool can't do. When we tested whether the model could predict risk in entirely unseen neighborhoods, it couldn't do it well, so we were clear about that limit instead of overselling the tool.
Accomplishments that we're proud of
We're proudest of the fact that our model is honest. Every time we found a leak, removing it lowered our score, and we removed it anyway. Our final R² of 0.26 is lower than it could have been, but it is real, and we can defend every part of it. We're also proud of how we handled fairness, because we measured it rather than just claiming to care about it. When we tried using real income as a predictor, the bias gap jumped to 0.62, revealing that the model had learned to equate low income with danger. We took income out of the model entirely, the gap fell to about 0.25, and we kept income only for auditing fairness and flagging cases for a human to review. In the end we chose a fairer model over a more accurate one. We even caught ourselves mid-build when we tried a language model to make our explanations sound nicer and noticed it inventing reasons the model never actually used, so we cut it and kept the honest explanations.
What we learned
The biggest lesson was a counterintuitive one: on a problem like this, a very high R² is not a victory but a warning, because it usually means the answer has leaked into the inputs. Chasing the number would have made our model look better while making it worse, so we had to learn to distrust our own good results and to test for leakage every single time. We also learned that fairness and explainability only mean something when you actually measure them and act on what you find, even when that means accepting a lower score or cutting a feature you were attached to.
What's next for NightSafe
Next, we want to calibrate the simulator's effect sizes against real studies of what lighting and patrols actually achieve, add a few more honest structural features such as transit stops, and ideally run a pilot with a single police district so we can test how the tool holds up against the real outcomes a planner cares about.
Built With
- census-api
- geopandas
- lightgbm
- opendataphilly
- openstreetmap
- osmnx
- pandas
- penndot
- plotly
- python
- scikit-learn
- shap
- streamlit
- xgboost


Log in or sign up for Devpost to join the conversation.