-
-
Nexxo: where two utilities' planned work meets, and which meetings will really happen.
-
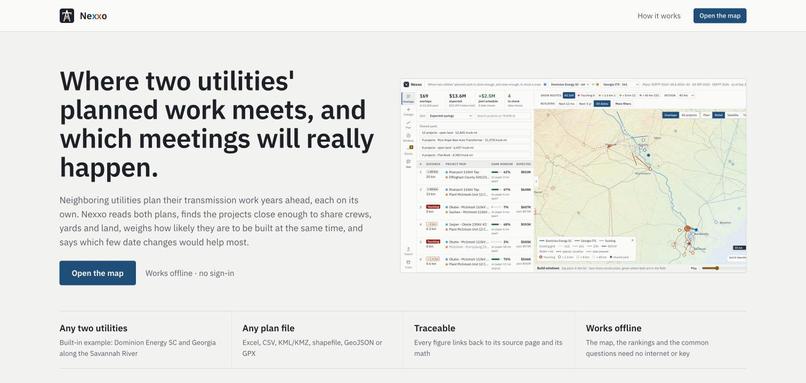
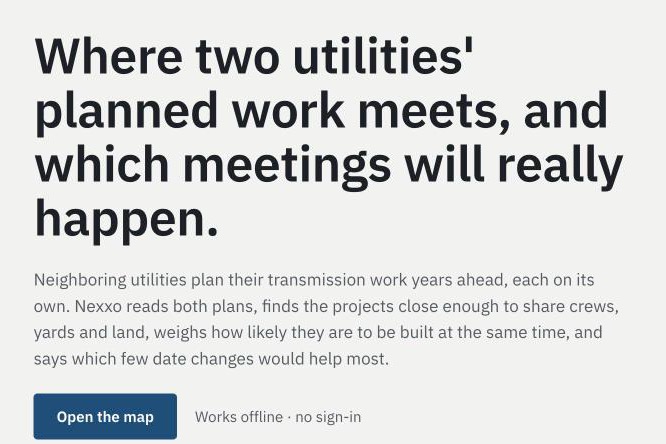
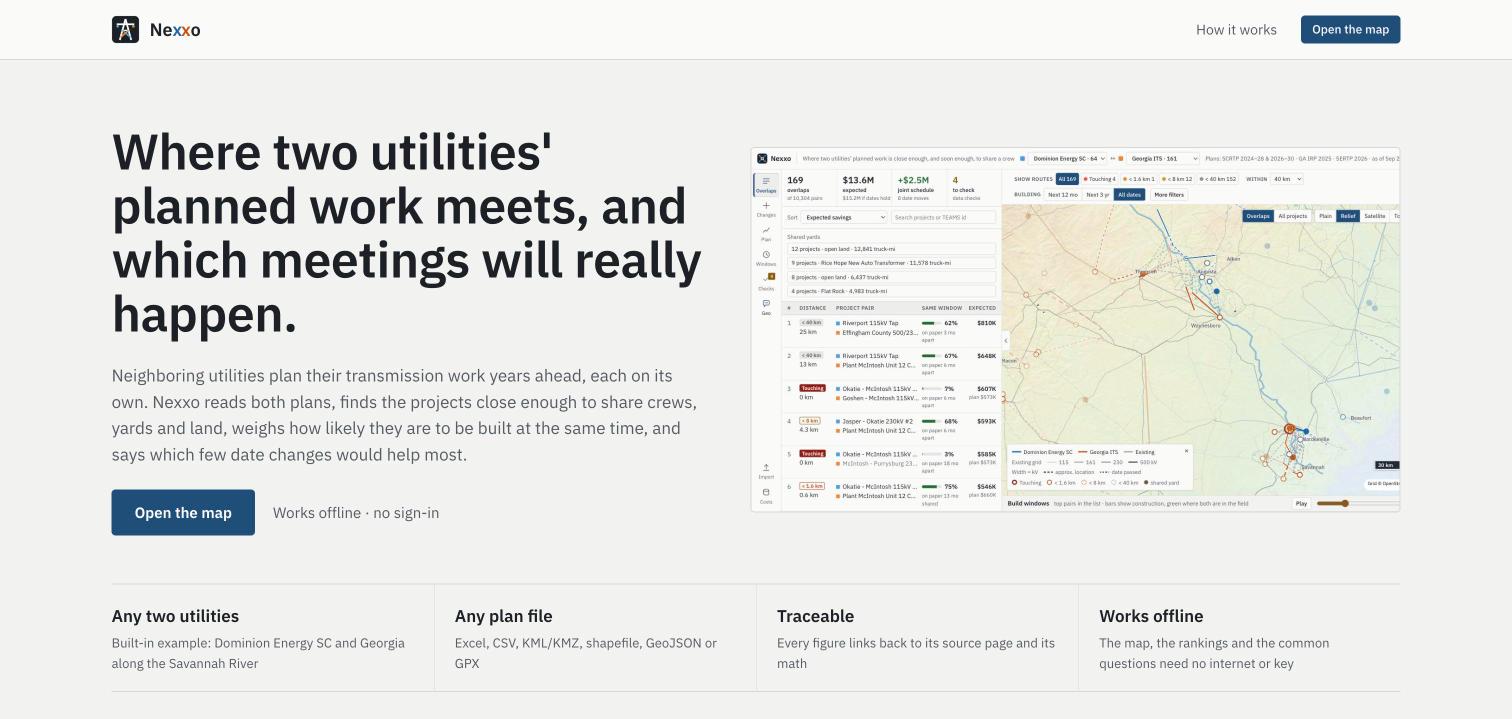
The intro: what Nexxo does for any two utilities, and one click into the map.
-
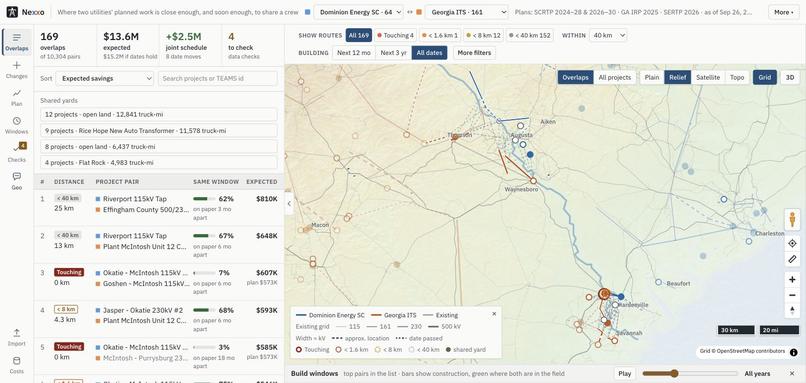
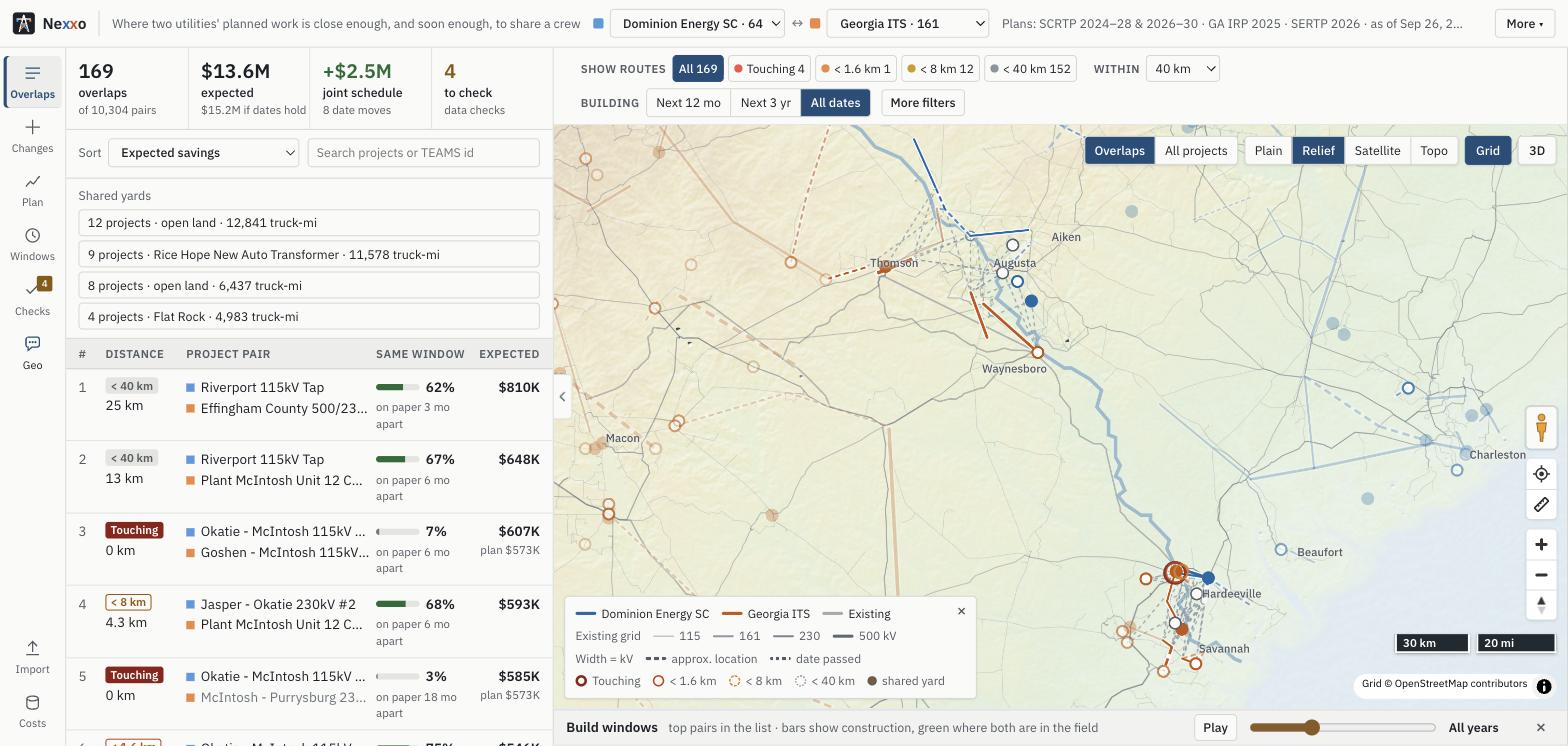
169 overlaps out of 10,304 pairs, ranked by expected savings, next to the map and today's grid.
-
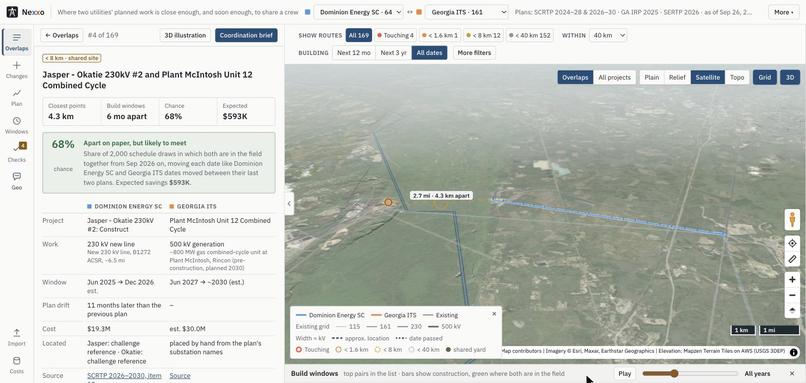
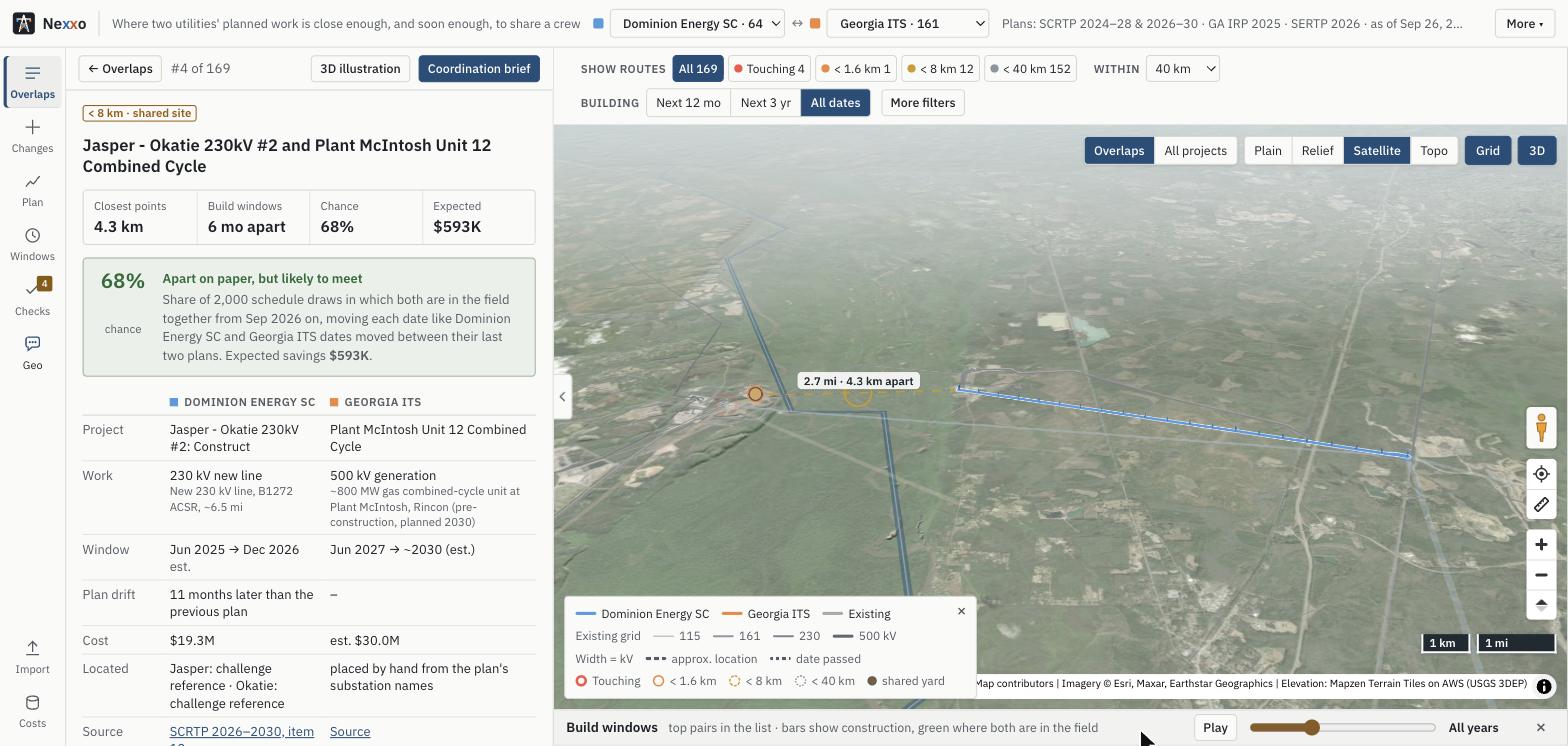
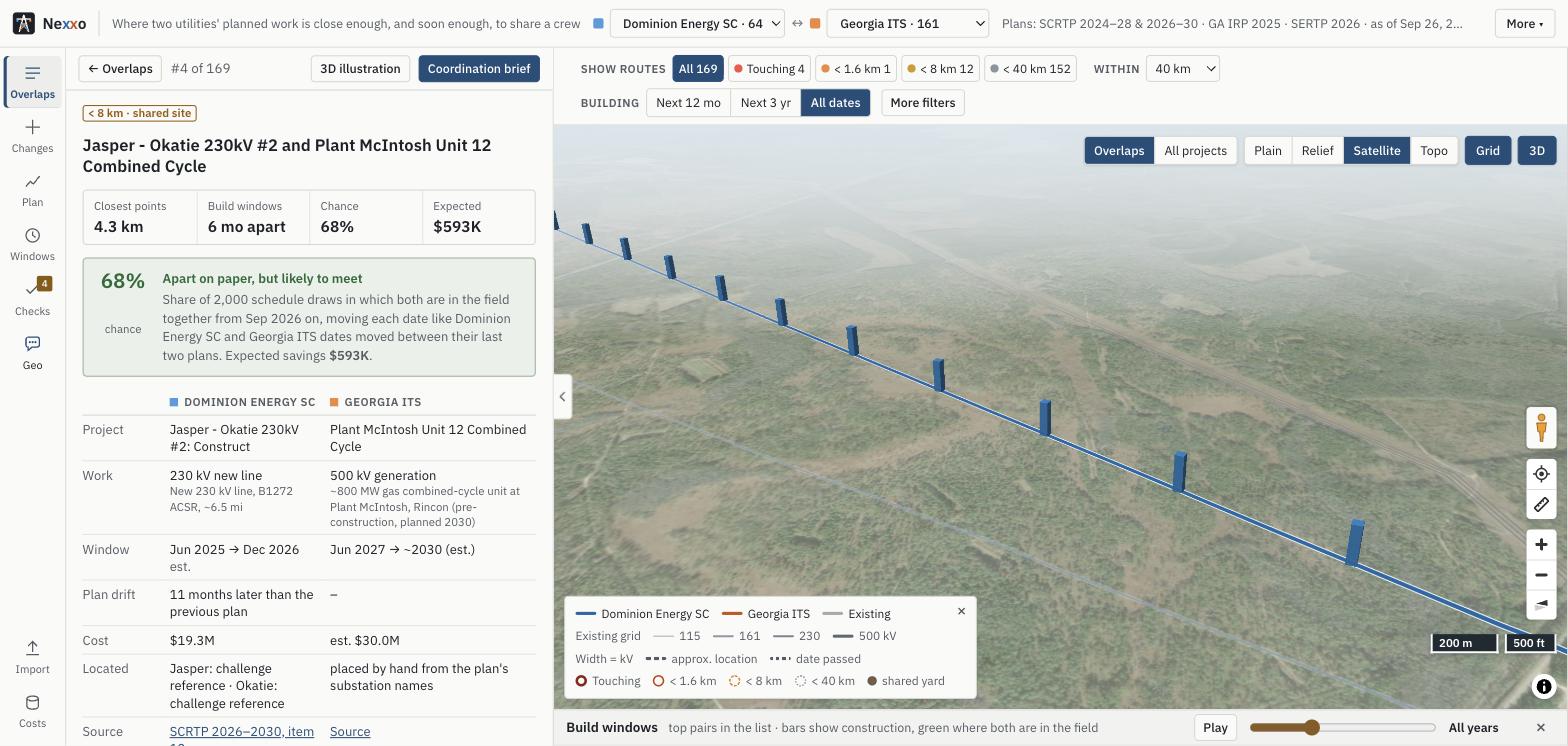
A pair up close: 4.3 km apart, six months apart on paper, 68% likely to be built together.
-
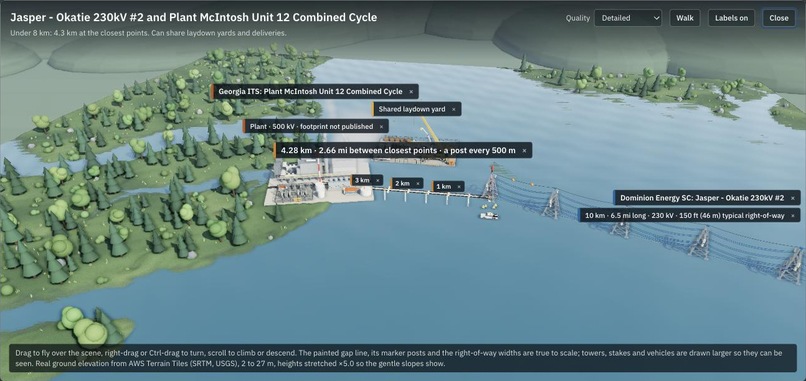
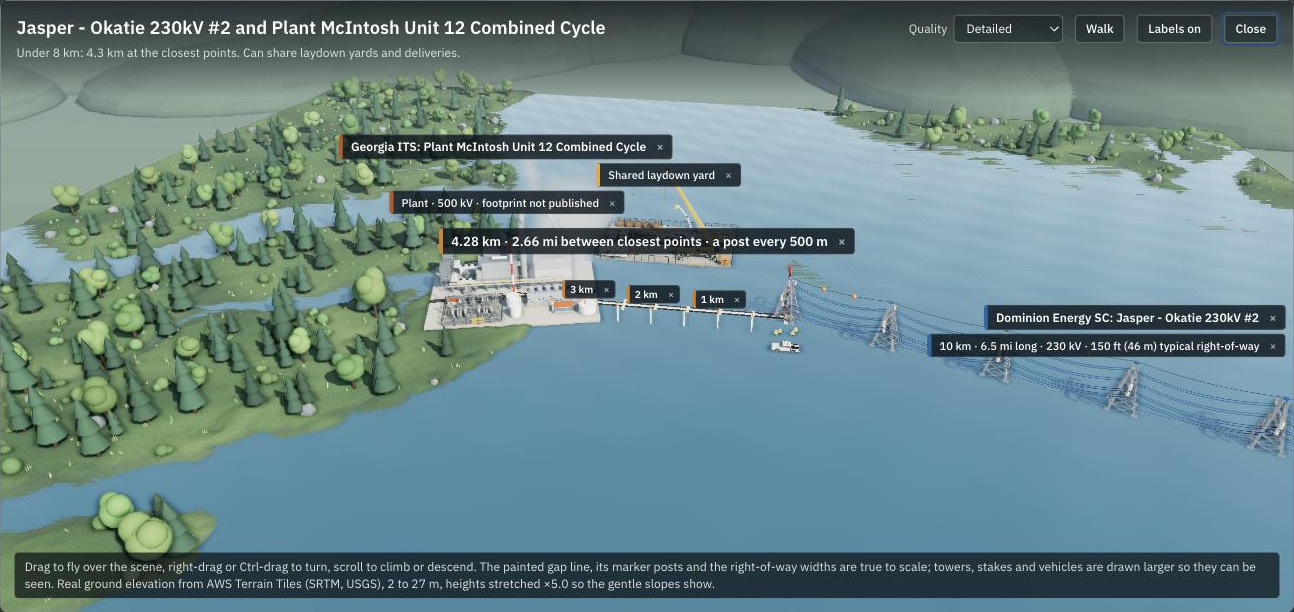
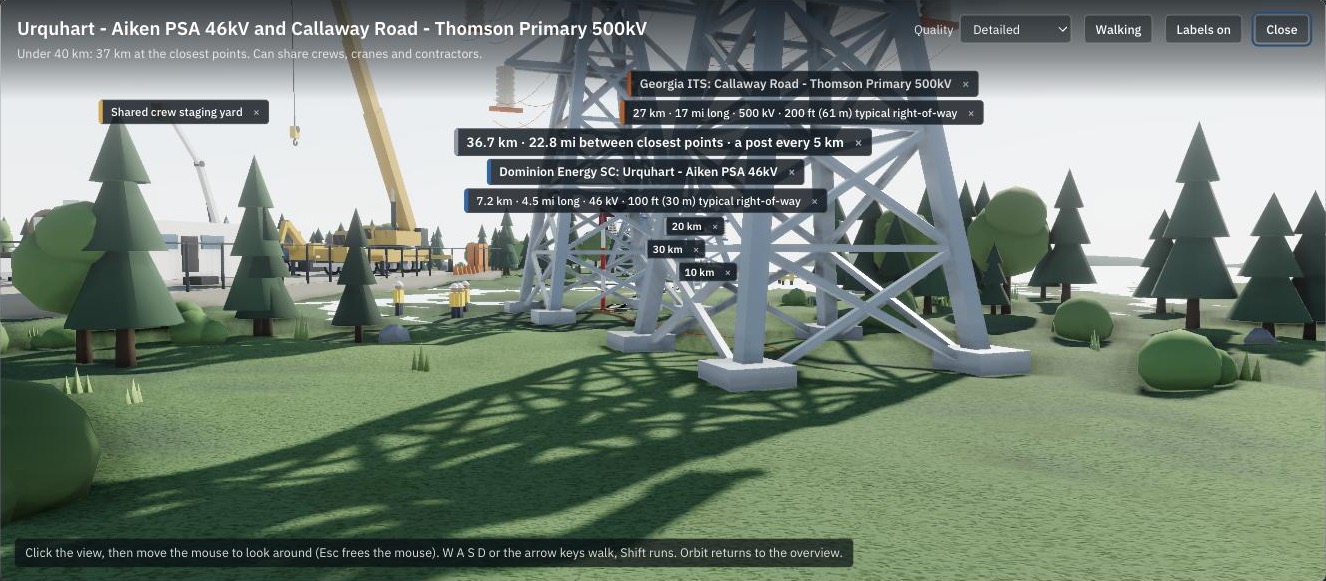
The pair as a 3D site you can walk: the new line, the plant across the river, the shared yard.
-
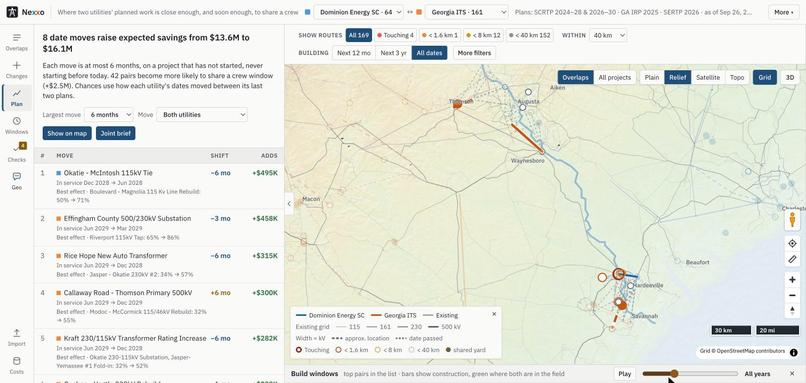
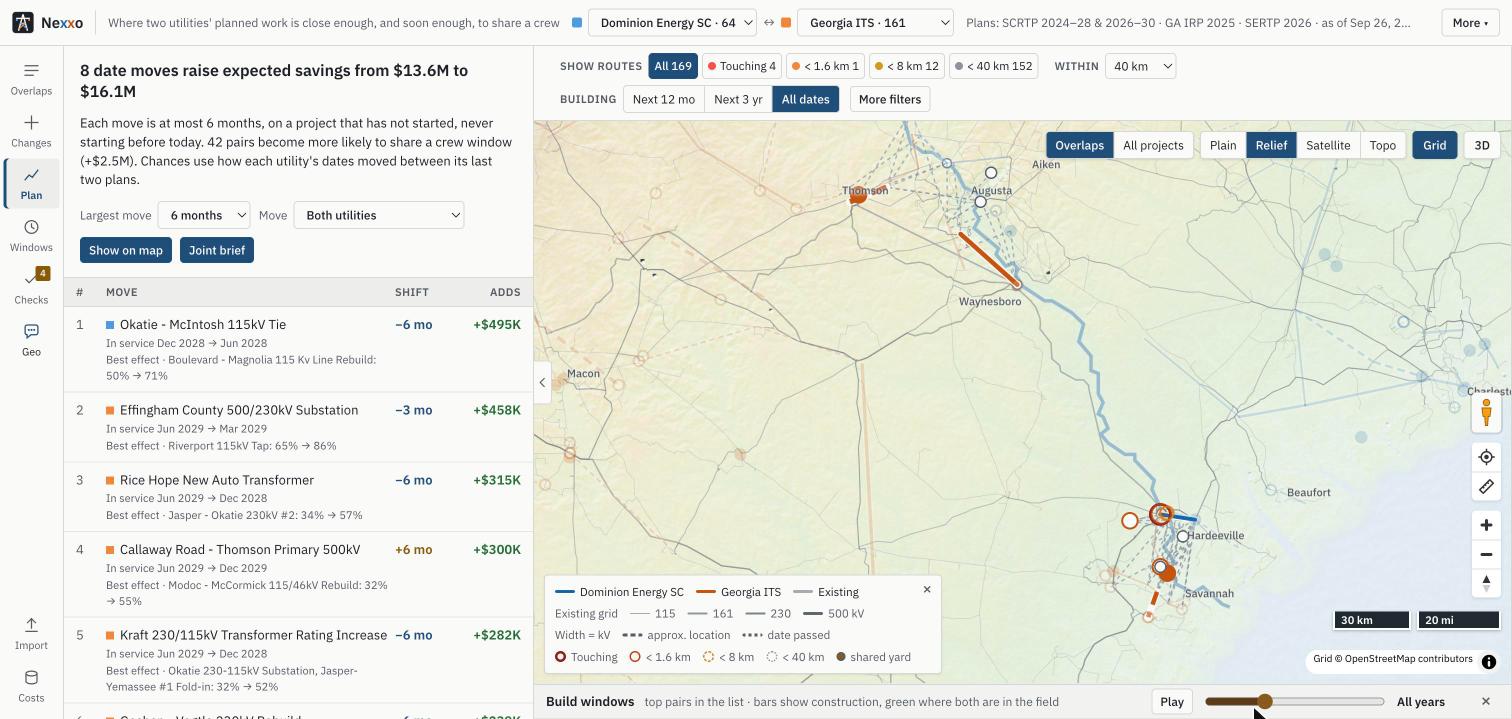
8 date moves (at most 6 months, only on work not yet started) take expected savings from $13.6M to $16.1M.
-
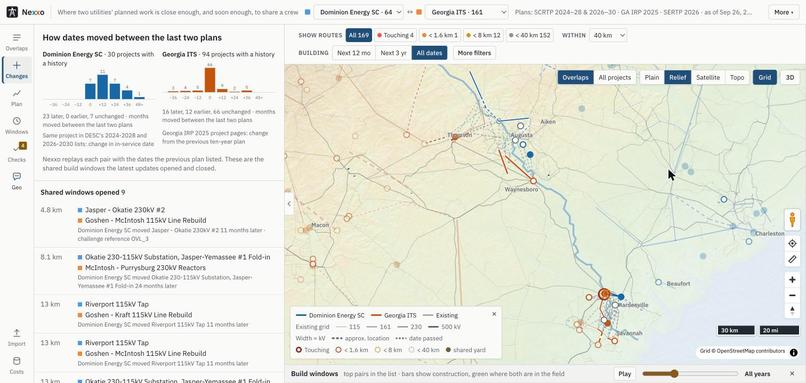
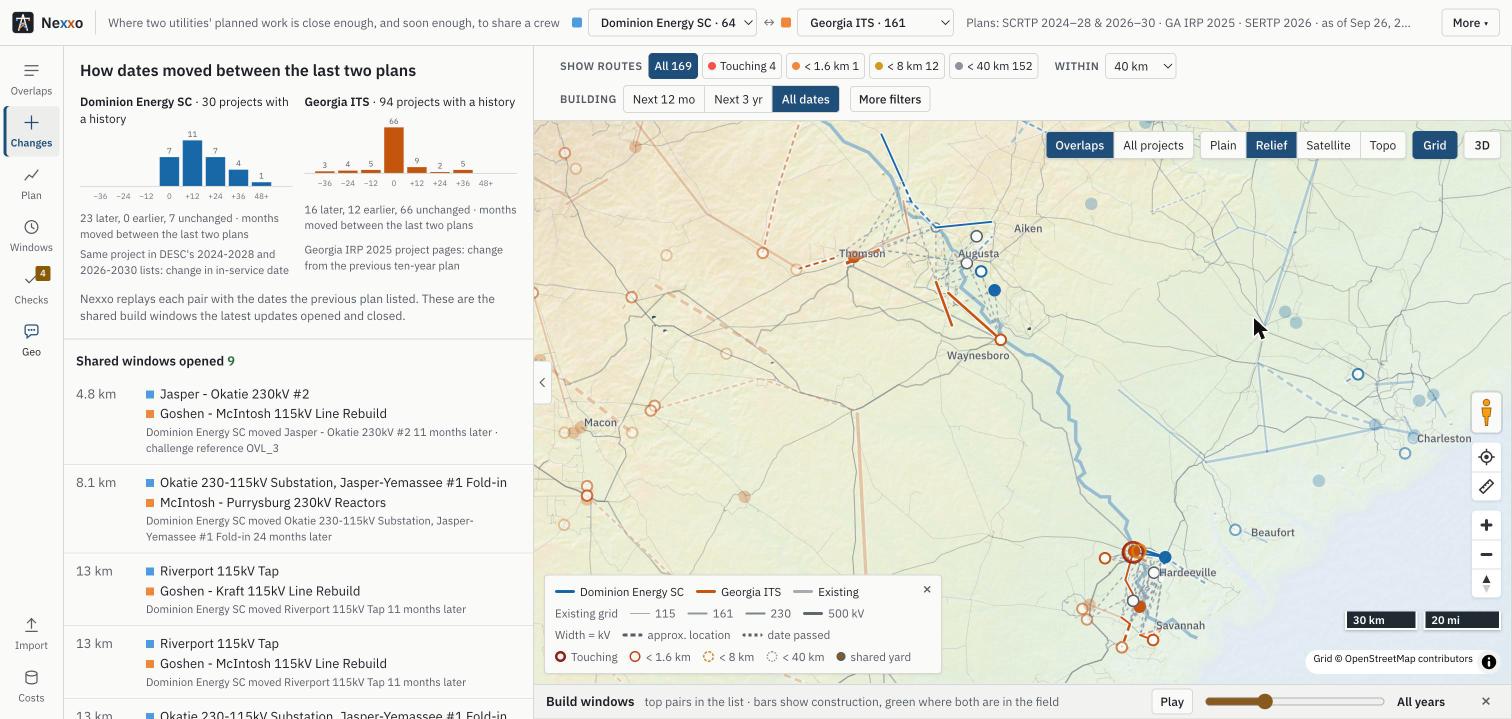
How each utility's dates moved between its last two plans, and the shared windows that opened.
-
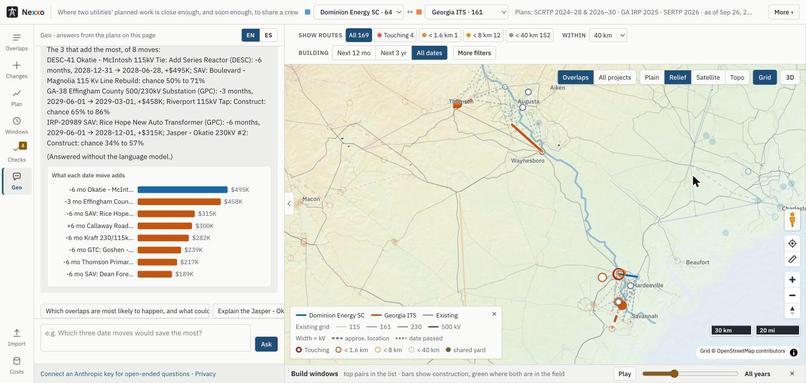
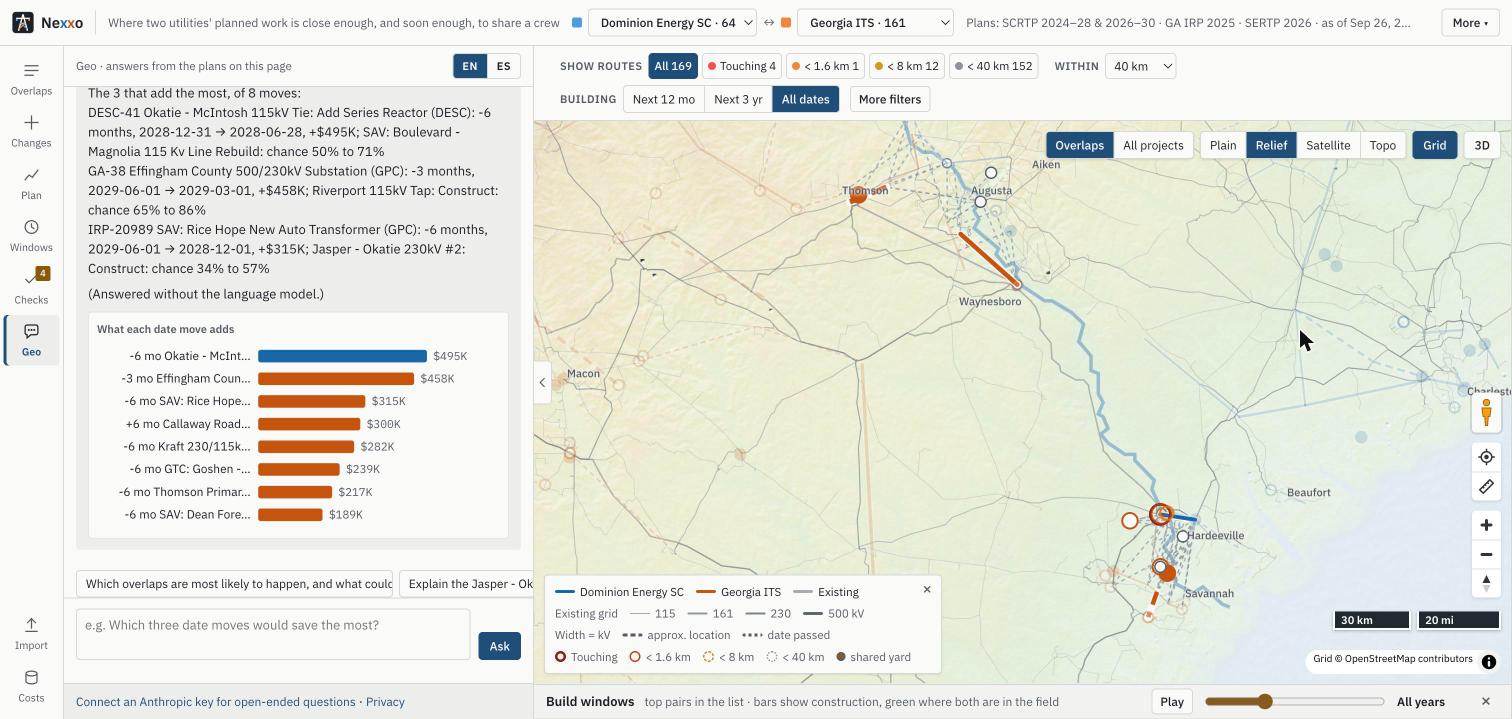
Geo answers from the plans, with a chart, even with no API key.
-
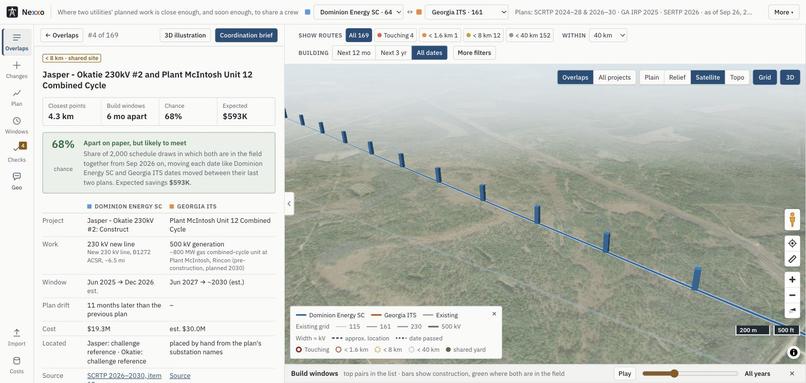
Satellite imagery over real terrain, with a tower along each planned line.
-
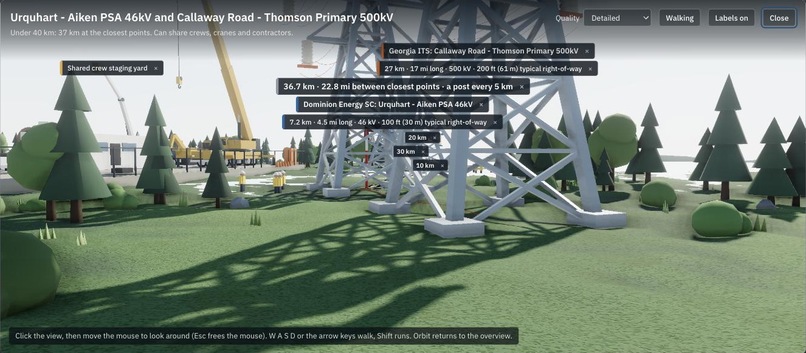
Drop the walker on any line and you're standing on the site: the 500 kV tower, the shared crew staging yard and the crew, at ground level.
Inspiration
Neighboring utilities plan transmission work years ahead, each on its own. Dominion Energy South Carolina and Georgia's power companies build on opposite banks of the Savannah River, and nobody lines up their crews, laydown yards or outages. We wanted to find where their plans meet, and which of those meetings will really happen.
What it does
Nexxo reads both utilities' published plans, places every project it can on real substations, and checks 10,304 project pairs. 169 come within 40 km, measured between closest points, not centers. It found all 6 overlaps in the challenge's reference table.
- It knows plans move. Comparing two editions of each plan, 23 of 30 DESC projects slipped (median 12 months). Nexxo turns that history into a chance that both crews are really in the field together, and ranks pairs by expected savings: $13.6M across the 169.
- It prices every pair item by item, with the math on screen: shared right-of-way, access road, permits, one laydown yard, deliveries, crew, crane and contractor.
- It says what to do. A schedule optimizer finds 8 date moves (at most 6 months, only on work not yet started) that raise expected savings to $16.1M, and prints a joint proposal for both planning teams.
- It shows the real place: satellite imagery over 3D terrain, today's grid underneath, and a walker you can drop onto any line to stand on the site.
- It works for any utility. Import Excel, CSV, KML/KMZ, shapefiles, GeoJSON or GPX.
Meet Geo: ask the plans in plain language
What sets Nexxo apart is Geo, a built-in assistant. Planners don't need to learn the tool; they ask it questions in plain English or Spanish:
- "Which overlaps near Augusta are most likely to happen?" ranks them by chance, with a bar chart.
- "Why isn't DESCP-10 paired with IRP-19523?" explains a rejection: 40.4 km apart, just past the 40 km screen.
- "Which three date moves would save the most?" runs the optimizer.
- "¿Qué cambió entre los dos últimos planes de DESC?" is answered in Spanish.
Geo is grounded in the engine, not the model. It runs Claude with 14 tools over Nexxo's own data: search, overlaps, comparisons, plan changes, the optimizer, the data checks, and tools that act on the page (fly the map, open a brief). The model frames the answer and the engine calculates every number. Each answer comes with a diagram drawn from the tool results (a distance mini map, timing windows, a cost breakdown, ranked bars), so the picture and the numbers cannot disagree. Without an API key, or with no internet, a pattern layer still answers the common questions from the same tools, and says so.
How we built it
A Python pipeline (pypdf) extracts 262 official records from the challenge PDFs, places them from OpenStreetMap substation names, and runs 10 validation checks on every rebuild. The app is a static page in plain JavaScript: MapLibre GL for the map and terrain, three.js for the 3D site, d3 for charts, and the Claude API for Geo. It has no server and no account, and imported files never leave the browser.
Challenges we ran into
Public plans name substations but give no coordinates, and Georgia's plans give years without costs. Dates slip constantly, so a pair that overlaps on paper often won't in the field. Keeping Geo honest meant forcing every number through the engine's tools.
Accomplishments that we're proud of
Every figure traces back to a PDF page and a TEAMS number, the tests confirm all six reference overlaps, and Geo answers useful questions even with no key and no network.
What we learned
Distance alone is a weak signal. The history of how plans move is what separates a real coordination opportunity from a coincidence on paper.
What's next
More utility pairs, live plan updates, and a shared coordination status both utilities can see.
What we built and what we used
All code in src/, scripts/ and tests/ was written during ShellHacks 2026, with help from AI coding tools. Third-party libraries, data and services (MapLibre GL, three.js, d3, SheetJS, JSZip, togeojson, shpjs, pypdf, OpenStreetMap, Esri imagery, AWS terrain tiles, the Claude API) are listed with versions and licenses in the README.
Built With
- anthropic-api
- claude
- css3
- d3.js
- html5
- javascript
- maplibre-gl
- openstreetmap
- overpass-api
- pypdf
- python
- sheetjs
- three.js


Log in or sign up for Devpost to join the conversation.