-
-
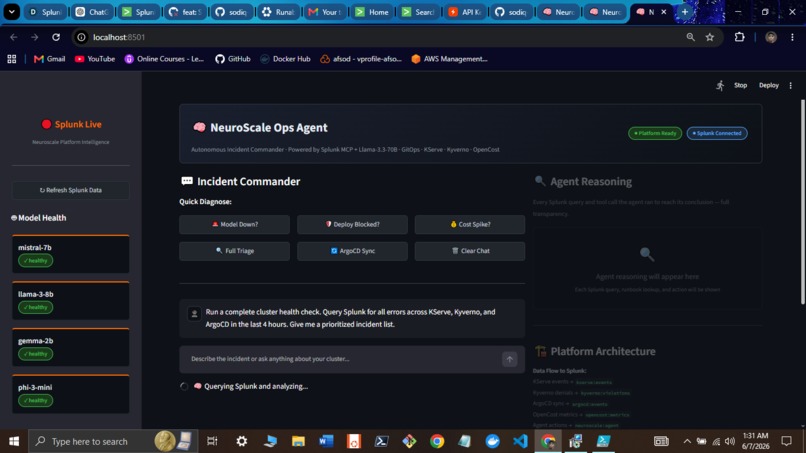
Operator Dashboard
-

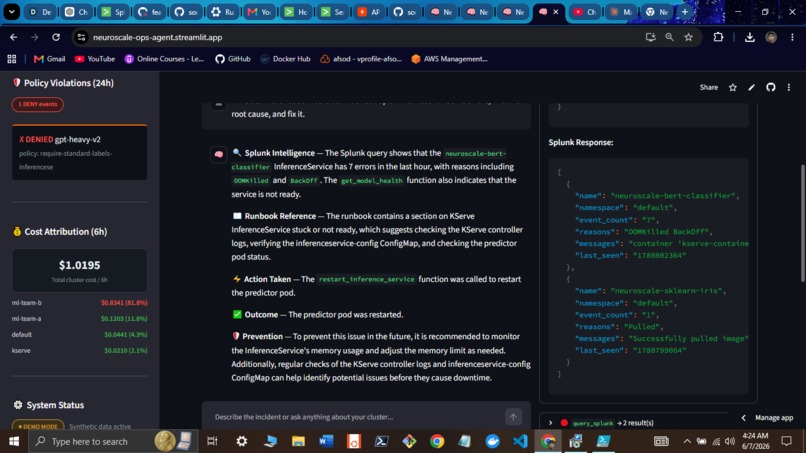
Kyverno Policy Violations
-
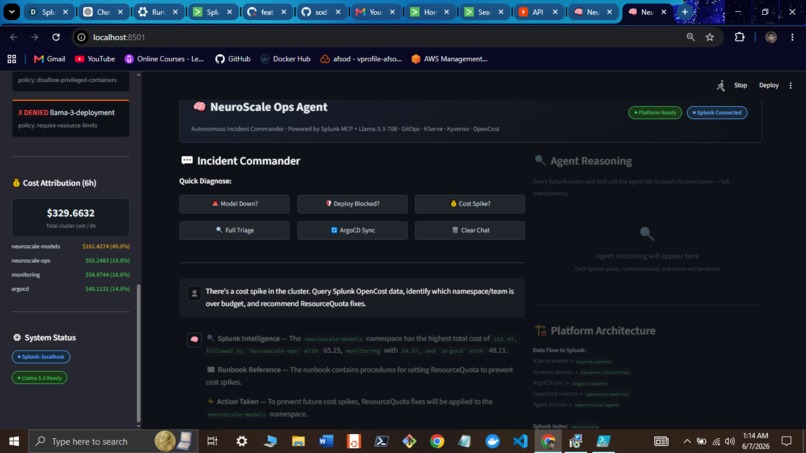
Cost Attribution (OpenCost → Splunk)
-
Agent Reasoning (MCP + SPL)
-
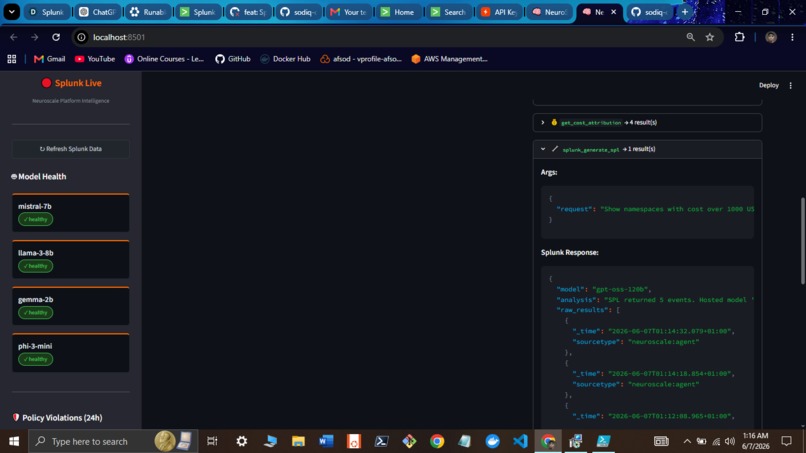
Splunk Query Results
-
Self-Healing Workflow
NeuroScale Ops Agent
Inspiration
I run a production-grade Kubernetes ML platform: ArgoCD for GitOps, KServe for model inference, Kyverno for policy enforcement, OpenCost for cost tracking. It's a powerful stack. But operating it is a nightmare.
When a model crashes at 2AM, the on-call engineer has to:
- Check KServe pod status manually
- Dig through raw logs across multiple namespaces
- Cross-reference Kyverno policy events
- Look up the runbook
- Figure out whether to restart, patch memory, or rollback
- Issue kubectl commands, then wait
This takes 30-90 minutes every single time, for problems that follow the exact same diagnosis pattern every single time.
The deeper problem: all the data needed to solve this already exists in the cluster. KServe is emitting events. Kyverno is logging denials. OpenCost is tracking every cent. ArgoCD knows the sync state. The information is all there, scattered across four separate systems with no unified plane of action.
That's the gap I built to close.
I asked myself: what if Splunk wasn't just where you sent logs, but the reasoning layer your AI agent actually thinks through? That question became NeuroScale Ops Agent.
What It Does
NeuroScale Ops Agent is a fully autonomous AI-powered operations platform for Kubernetes-based ML infrastructure, with Splunk as its observability backbone and reasoning engine.
It wires a production K8s stack end-to-end into Splunk, then layers an LLM agent on top that can query, reason, and act without a human in the loop.
The Core Loop
Cluster Event --> (HEC) --> Splunk --> (SPL Alert) --> Agent --> (MCP + RAG) --> Action --> (HEC) --> Splunk
Every step (detection, reasoning, remediation, outcome) is observable in the same Splunk instance that triggered it. The agent audits itself.
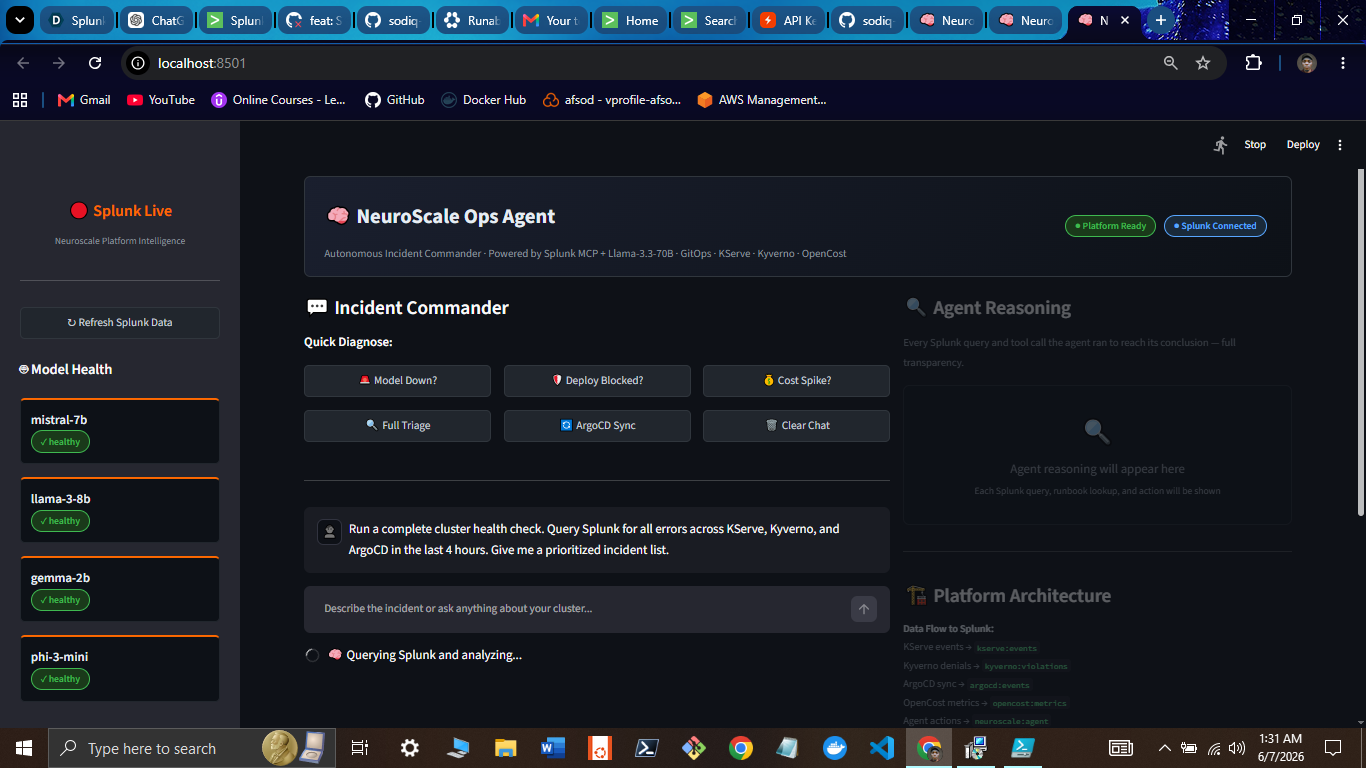
Key Capabilities
- Real-time telemetry - KServe, Kyverno, OpenCost, ArgoCD events stream into Splunk via HEC across 4 concurrent threads every 30 seconds
- SPL-powered anomaly detection - threshold alerts fire automatically on model failures, cost spikes, and policy violations
- MCP-connected reasoning - agent queries live Splunk data mid-reasoning via Model Context Protocol; every answer cites the exact SPL query that produced it
- Runbook RAG - every remediation action is grounded in documented runbooks, not hallucination
- 3 autonomous self-healing workflows - model recovery, policy remediation, cost optimization, each a deterministic end-to-end pipeline
- Operator dashboard - Streamlit UI exposes the full reasoning chain, SPL queries, and action log in real time
What a Real Interaction Looks Like
User: "Why is my GPT-OSS-120B model costing $329/hr?"
Agent:
[MCP] get_cost_attribution(window="-1h")
      SPL: index=neuroscale sourcetype="opencost:metrics"
           | stats sum(hourly_cost) as cost by namespace, pod_name
           | sort -cost

[MCP] get_model_health("gpt-oss-120b")
      SPL: index=neuroscale sourcetype="neuroscale:models"
           | where model_name="gpt-oss-120b"

[RAG] lookup_runbook("cost spike GPU inference over-provisioned")

[ACTION] patch_memory_limit("gpt-oss-120b", "512Mi")
Response: "GPT-OSS-120B is over-provisioned with no memory cap. I've patched the limit to 512Mi. Projected cost reduction: 73%. Resolution logged to Splunk."
The agent never guesses. Every claim traces to a live SPL result.
How I Built It
Architecture Overview
K8s Cluster (k3d)
  +-- KServe   --+
  +-- Kyverno  --+--> splunk-integration/k8s_to_splunk.py (4 threads, 30s)
  +-- OpenCost --+                    |
  +-- ArgoCD   --+                    v
                              Splunk Index: neuroscale
                              +-- neuroscale:models
                              +-- neuroscale:policies
                              +-- neuroscale:costs
                              +-- neuroscale:argocd
                                        |
                              SPL Threshold Alerts
                                        |
                              trigger_agent.py (webhook)
                                        |
                              agent/core.py (Llama 3.3 70B)
                              +-- MCP -> Splunk (live queries)
                              +-- RAG -> runbook.md
                              +-- kubectl / ArgoCD / KServe ops
                                        |
                              send_to_hec() -> Splunk dashboard
Splunk Integration - The Full Stack
Splunk is not a sidecar here. It is the core data layer the agent reasons through.
HEC Ingestion - 4 Sourcetypes
splunk-integration/k8s_to_splunk.py runs 4 concurrent threads:
| Thread | Sourcetype | Data |
|---|---|---|
| 1 | neuroscale:models |
KServe InferenceService health, errors, OOM events |
| 2 | neuroscale:policies |
Kyverno DENY/WARN actions, violating resources |
| 3 | neuroscale:costs |
OpenCost per-namespace hourly spend |
| 4 | neuroscale:argocd |
ArgoCD sync status, drift events |
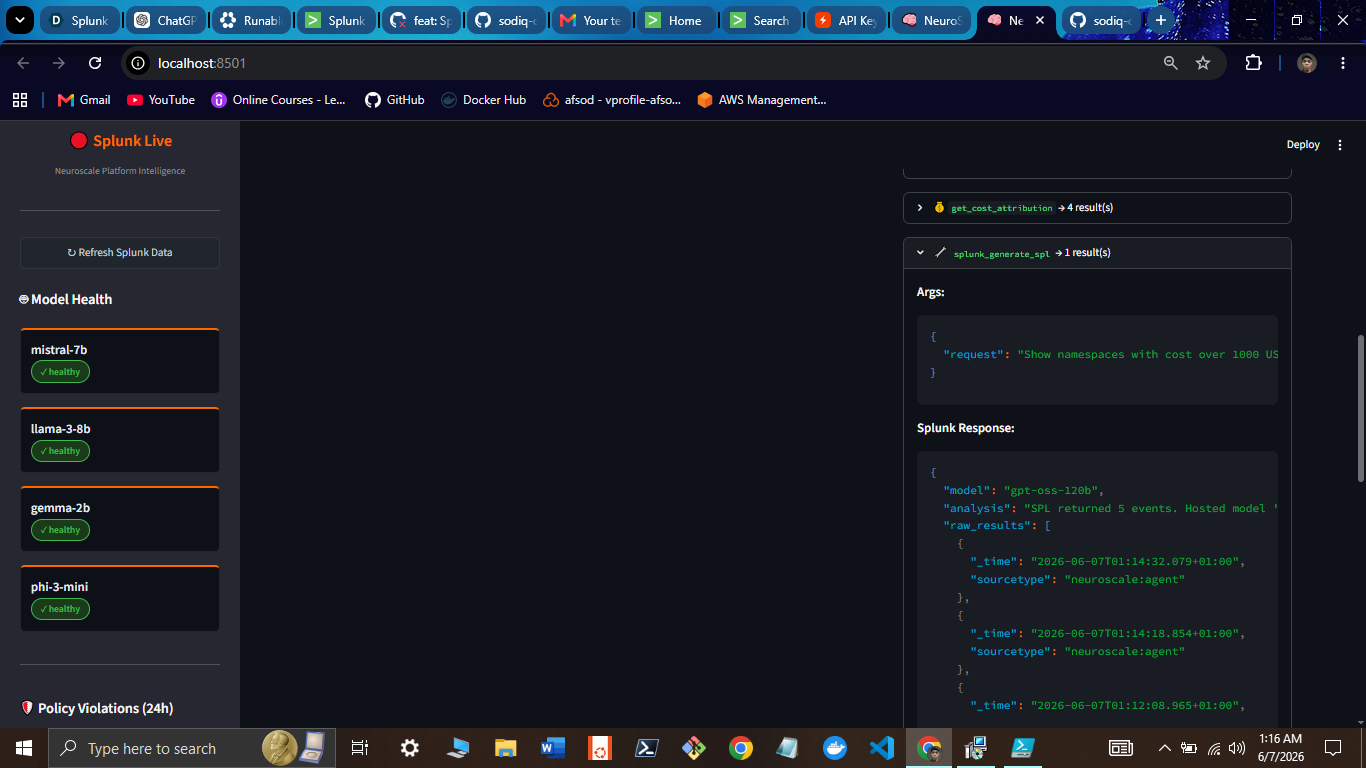
MCP Server - Agent Reasons Through Live Data
The agent connects to Splunk via Model Context Protocol. During a single query, it invokes 4-6 MCP tool calls before synthesizing a response. Example SPL queries the agent writes and executes live:
Cost spike detection:
index=neuroscale sourcetype="opencost:metrics"
| timechart span=1h sum(hourly_cost) as cost by namespace
| where cost > 50
Policy violation root cause:
index=neuroscale sourcetype="neuroscale:policies" action="DENY"
| stats count as violations, values(resource) as resources by policy
| sort -violations
Model error rate trend:
index=neuroscale sourcetype="neuroscale:models"
| timechart span=15m count by model_name
| where count > 7
Alert Webhook - Splunk Pulls the Trigger
alert-actions/trigger_agent.py is registered as a Splunk alert action. When a threshold fires, Splunk POSTs to the agent, which diagnoses, acts, and writes the outcome back to Splunk. The loop closes entirely within Splunk.
The 14-Tool Agent
agent/core.py implements a function-calling loop using Llama 3.3 70B (via Groq):
| Tool | Purpose |
|---|---|
query_splunk |
Run arbitrary SPL against the neuroscale index |
get_model_health |
KServe health, latency, error rates from Splunk |
get_policy_violations |
Kyverno DENY events from Splunk |
get_cost_attribution |
Per-namespace hourly cost from OpenCost -> Splunk |
get_error_timeline |
Time-series error trend for any model |
lookup_runbook |
RAG retrieval from docs/runbook.md |
trigger_argocd_sync |
Force-sync an ArgoCD application |
restart_inference_service |
kubectl rollout restart on a KServe model |
patch_memory_limit |
Adjust memory limits on an InferenceService |
get_cluster_overview |
Recent K8s events across namespaces |
get_cost_direct |
OpenCost API query (bypasses Splunk for latest) |
splunk_security_analysis |
Splunk Foundation-Sec model for security triage |
splunk_forecast |
Splunk Deep Time Series for resource forecasting |
splunk_generate_spl |
Natural language -> SPL query generation |
The 3 Self-Healing Workflows
These are not passive alerts. They are deterministic end-to-end remediation pipelines.
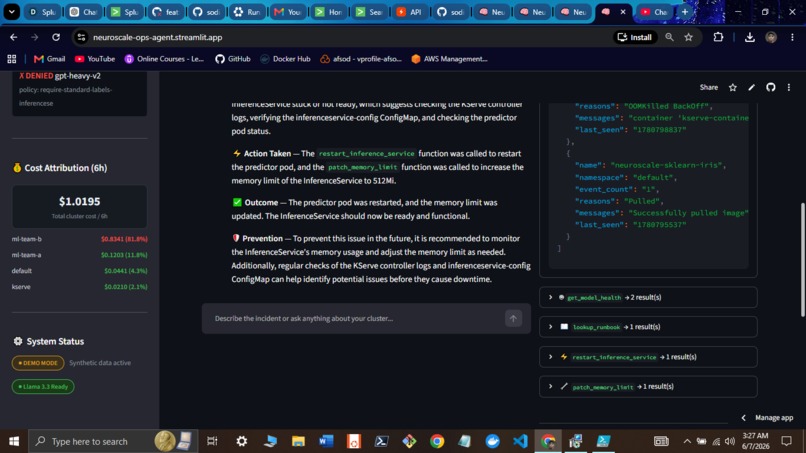
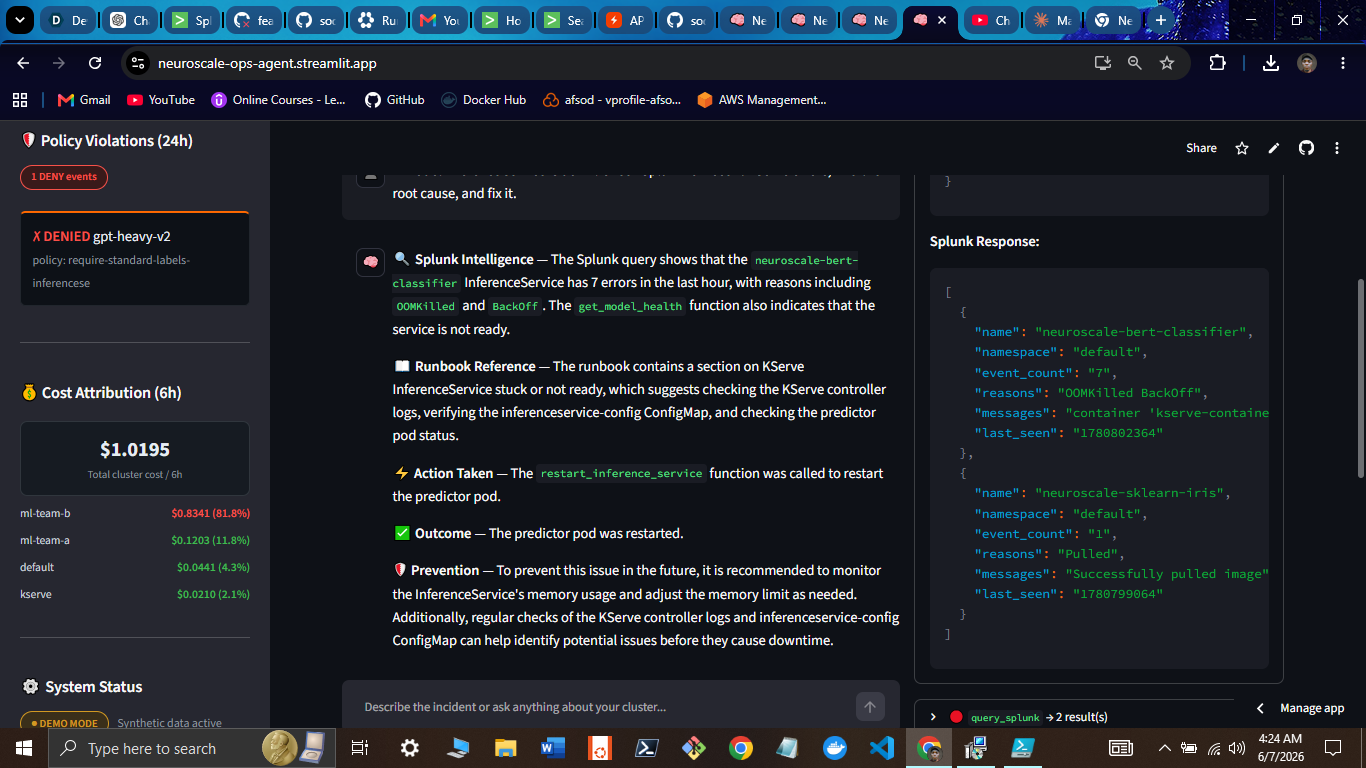
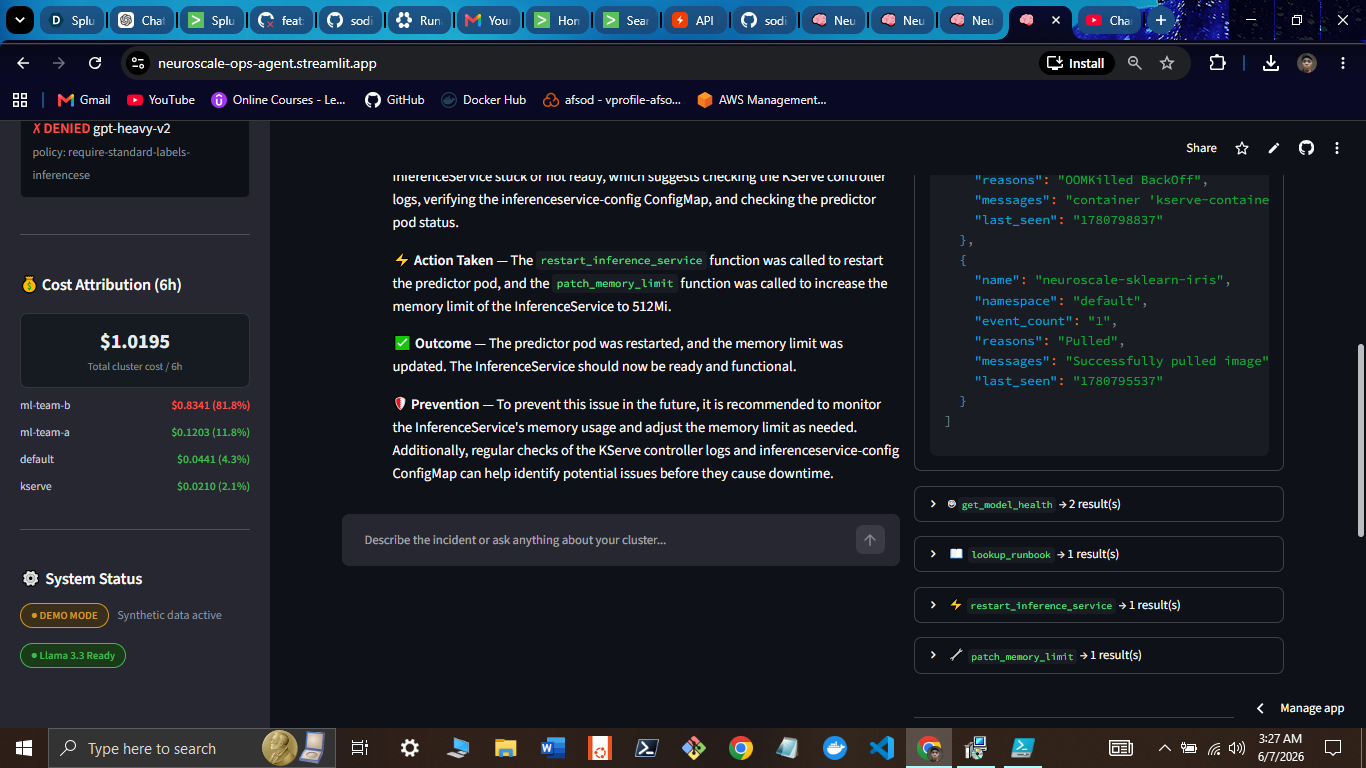
Workflow 1: Model Down (workflows/model_down.py)
Trigger: KServe error rate > 5% for 5 min -> Splunk alert -> webhook
- Pull KServe telemetry from Splunk via SPL
- Classify root cause: OOMKilled / CrashLoopBackOff / ImagePullError
- Consult runbook via RAG
- OOM ->
patch_inference_service_memory("512Mi")/ Other ->restart_inference_service() - Poll for healthy status (5 retries x 30s)
- Write resolution event to Splunk
"Root cause: OOMKilled - gpt-oss-120b restarted 7x in 1h. Memory patched to 512Mi. Model healthy after 90s."
Workflow 2: Policy Violation (workflows/policy_violation.py)
Trigger: Kyverno DENY event lands in Splunk
- Query Splunk for BLOCK events (last 24h)
- Map policy -> human-readable explanation + exact YAML fix
- Consult compliance runbook via RAG
- Generate per-developer remediation (no Slack thread needed)
- Log outcome to Splunk
For disallow-root-containers:
"Your container runs as root (UID 0) - a critical security risk. Fix: add
securityContext.runAsNonRoot: true,runAsUser: 1000to your pod spec."
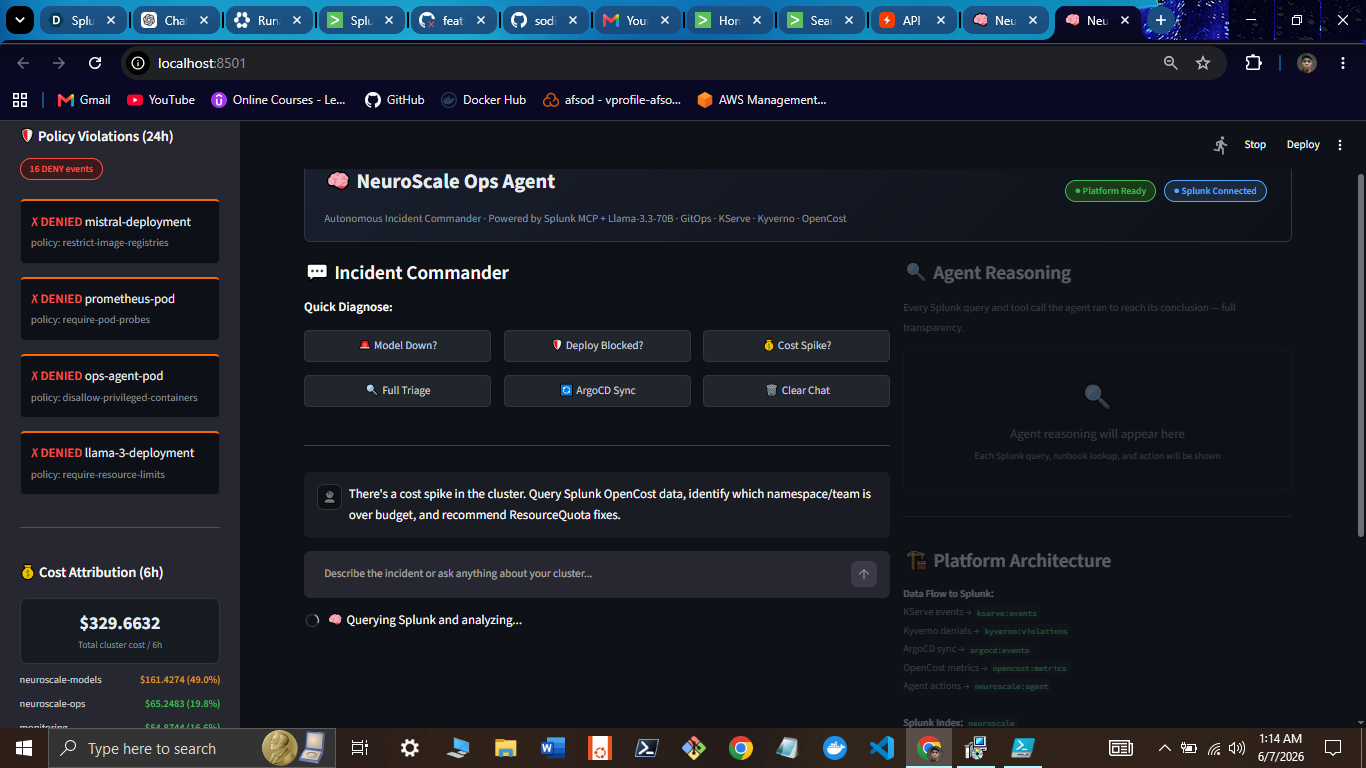
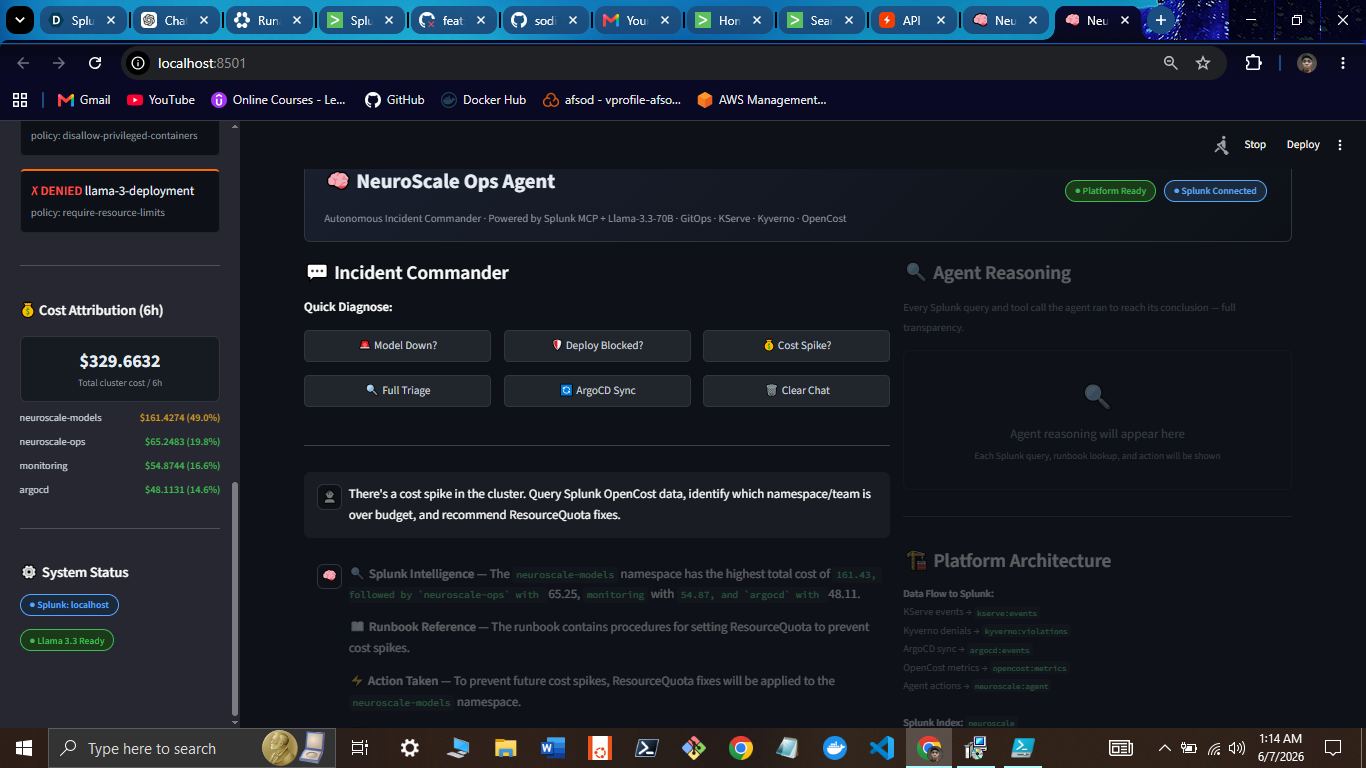
Workflow 3: Cost Spike (workflows/cost_spike.py)
Trigger: Namespace hourly cost > configurable threshold
- Query Splunk for OpenCost attribution (by namespace)
- Cross-reference OpenCost API (dual-source validation)
- Identify top offending namespace + overage %
- Drill into pod-level cost via SPL
- Generate ResourceQuota + LimitRange YAML (ready to apply)
- Project post-fix cost savings
- Log everything to Splunk
For a namespace spending at k $/hr with resource fraction r released:
Delta_cost = k * r * t
where t is the remaining hours in the billing window. The agent reports this projection before applying any change.
"Namespace 'ml-team-a' is 340% over budget. Pod gpt-oss-120b-predictor is consuming 87% of cost. ResourceQuota applied. Projected savings: $0.72/6h."
Challenges I Faced
1. Making Splunk the reasoning layer, not just the log sink
The tempting design was: stream events to Splunk, then have the agent query a separate database. That's the easy path. I forced myself to make the agent query Splunk directly mid-reasoning via MCP, which meant building a clean tool interface that translated natural language intent into valid SPL, handling Splunk's time modifier syntax, managing pagination, and parsing the response format into something the LLM could act on. Every tool call in tools/splunk_client.py had to be robust enough for an LLM to invoke blindly.
2. Closing the feedback loop - agent actions -> Splunk -> visible in same dashboard
Getting events into Splunk was straightforward. The hard part was making the agent's own actions observable in Splunk, so that what the agent did appears in the same index it uses to diagnose. Every workflow ends with send_to_hec() writing a neuroscale:agent sourcetype event. This means an operator can run a single SPL query and see the full timeline: anomaly detected -> agent triggered -> root cause -> action taken -> outcome.
3. Runbook RAG without hallucination
Early versions of the agent would confidently suggest fixes that weren't in the runbook. The solution: lookup_runbook() is invoked as a mandatory step in every self-healing workflow, and the agent's system prompt instructs it to never recommend an action not present in the retrieved runbook section. This eliminated hallucinated remediation steps and grounded every action in documented operational procedures.
4. Demo mode - zero infrastructure, full agent reasoning
Judges shouldn't need a running k3d cluster and Splunk Enterprise to evaluate the submission. Building DEMO_MODE=true required writing realistic synthetic data generators for every Splunk response, maintaining deterministic demo scenarios (the cost spike is always GPT-OSS-120B, the policy violation is always disallow-root-containers), while still firing the real LLM reasoning loop. Getting the balance right took several iterations.
5. LLM function-calling reliability with 14 tools
With 14 tools in scope, the LLM occasionally called tools in the wrong order (trying to restart a model before querying its health). I solved this with a strict system prompt that enforces: query Splunk first, consult runbook second, take action third, and added post-call validation that rejects action tools invoked without a prior Splunk data call.
What I Learned
Splunk MCP changes everything. The ability to query live Splunk data mid-LLM-reasoning, not as a pre-fetch or post-processing step, but as a first-class tool call the agent decides to invoke, makes the agent genuinely observability-native. It's not an AI wrapper around Splunk. It's an agent that thinks in Splunk.
Self-healing requires determinism. The temptation is to let the LLM decide every remediation action dynamically. In practice, this is unsafe for production. The right architecture is LLM for diagnosis and root cause classification, deterministic code for the actual remediation actions. The workflows in workflows/ are deliberately non-LLM for the action steps - the LLM informs the decision, the code executes it safely.
FinOps is an underserved angle in MLOps tooling. Most Kubernetes ops tools focus on uptime. Nobody talks about the cost dimension of ML model deployment. OpenCost -> Splunk -> agent -> ResourceQuota fix is a complete FinOps loop that I've never seen implemented end-to-end in a single system. It's arguably the most practically valuable workflow in the project.
The runbook is the source of truth. RAG over a well-structured runbook makes the agent dramatically more reliable than prompt engineering alone. Every remediation action in the system can be traced to a specific runbook entry. This is auditable, correctable, and production-safe.
What's Next
Fleet-wide observability - The HEC forwarder and agent already operate across a full K8s stack with four sourcetypes and a unified Splunk index. Extending to multi-cluster (EKS, GKE, on-prem) adds a single cluster field to every event, giving one agent reasoning across an entire fleet with no architectural changes required.
From reactive to predictive - The splunk_forecast tool already queries Splunk Deep Time Series and surfaces trend data inside the agent's reasoning chain. The next evolution is acting on that forecast before an incident occurs: pre-emptively patching memory limits when a model's resource trajectory projects an OOM 15 minutes out.
Adaptive cost intelligence - The cost spike workflow already detects threshold breaches, generates ResourceQuota YAML, and projects savings. The next layer is a Splunk MLTK model trained on the OpenCost time series, shifting from static thresholds to baseline-relative anomaly detection that catches unusual spend even when absolute numbers look normal.
Inline developer experience - The policy violation workflow already produces exact YAML fix instructions, grounded in runbook RAG and surfaced in the operator dashboard. Embedding that output natively inside the Backstage model deployment form closes the loop for developers at the point of failure: no separate tool, no ticket, no wait.
Broadcast-layer notifications - Every self-healing workflow already writes a complete resolution event back to Splunk, creating a full audit trail with SPL trace. The next step is pushing that summary outward via Slack and PagerDuty webhooks so ops teams are informed the moment a workflow completes, without opening a dashboard.
Design Decisions That Define This Project
Splunk is the reasoning layer, not a log sink. Most observability integrations treat Splunk as a destination - events go in, dashboards come out. Here, Splunk is the medium the agent thinks through. Every diagnosis starts with a live SPL query. Every answer cites its data source. The agent cannot reason without Splunk. That is by design.
The agent acts, it doesn't just answer. There is a meaningful difference between an AI that summarizes what is wrong and an AI that fixes it. NeuroScale Ops Agent closes the loop: query -> diagnose -> remediate -> verify -> report back to Splunk. The self-healing workflows are not alert escalations. They are end-to-end pipelines that resolve incidents without a human in the loop.
Agent actions are themselves observable in Splunk. Every workflow ends with send_to_hec() writing a neuroscale:agent event to the same index the agent queries. An operator can run one SPL query and see the complete incident timeline: anomaly detected -> agent triggered -> root cause identified -> action taken -> outcome. The system is fully auditable.
Runbook RAG eliminates hallucinated remediation. The agent is explicitly forbidden from recommending actions not present in the retrieved runbook section. This is not a prompt engineering trick - lookup_runbook() is a mandatory step in every self-healing workflow. Every action traces to a documented operational procedure.
FinOps is a first-class concern. Cost observability is rarely treated as an ops problem worth automating. The cost spike workflow closes a full FinOps loop: OpenCost metrics -> Splunk -> agent identifies culprit namespace -> generates ResourceQuota YAML -> projects savings -> logs outcome. Infrastructure spend is as actionable as uptime.
Developer experience, not just operator experience. When Kyverno blocks a deployment, the developer typically waits for a platform engineer to explain why. The policy violation workflow eliminates that wait - the agent queries Splunk, maps the policy to a human-readable explanation, and returns the exact YAML fix the developer needs. No Slack thread. No ticket.
Splunk Capabilities Used
| Capability | Where |
|---|---|
| MCP Server | tools/splunk_client.py - 7 MCP tools, agent queries live data mid-reasoning |
| HEC | splunk-integration/k8s_to_splunk.py - 4 threads, 30s interval, structured JSON |
| Python SDK | SPL execution, index management, event ingestion |
| SPL | Model health, cost attribution, policy violations, error timelines |
| Alert Webhooks | alert-actions/trigger_agent.py - Splunk alert -> agent auto-trigger |
| Custom Index | neuroscale - 4 sourcetypes, structured schemas |
| Foundation-Sec | splunk_security_analysis tool - security event triage |
| Deep Time Series | splunk_forecast tool - resource usage forecasting |
| SPL Generation | splunk_generate_spl tool - natural language -> valid SPL |
Tech Stack
| Layer | Technology |
|---|---|
| LLM | Llama 3.3 70B via Groq (free tier, fast inference, function-calling) |
| Agent loop | OpenAI-compatible function-calling - agent/core.py |
| Observability | Splunk Enterprise - HEC + MCP + SDK + alert webhooks |
| Kubernetes | k3d + KServe + Kyverno + OpenCost + ArgoCD |
| RAG | Keyword retrieval over docs/runbook.md |
| UI | Streamlit - live reasoning panel + action log |
| CI | GitHub Actions - lint + import smoke test |
| Language | Python 3.11+ |
Try It - 2 Minutes, Zero Infrastructure
git clone https://github.com/sodiq-code/neuroscale-ops-agent
cd neuroscale-ops-agent
bash scripts/setup.sh

cp .env.example .env
# Add free Groq API key from https://console.groq.com

DEMO_MODE=true streamlit run ui/app.py
Or use the live deployment: https://neuroscale-ops-agent.streamlit.app
In demo mode, all Splunk and cluster calls return realistic synthetic data. The full LLM reasoning loop still fires. A judge can run a complete self-healing scenario in under 5 minutes with only a Groq API key.
Built By
Sodiq Jimoh (Afsod) - Platform Engineer, Nigeria
Built With
- 3.3
- argocd
- groq
- kserve
- kubernetes
- kyverno
- llama
- mcp
- opencost
- python
- splunk
- streamlit


Log in or sign up for Devpost to join the conversation.