🚨 Inspiration
It started with a painfully familiar moment:
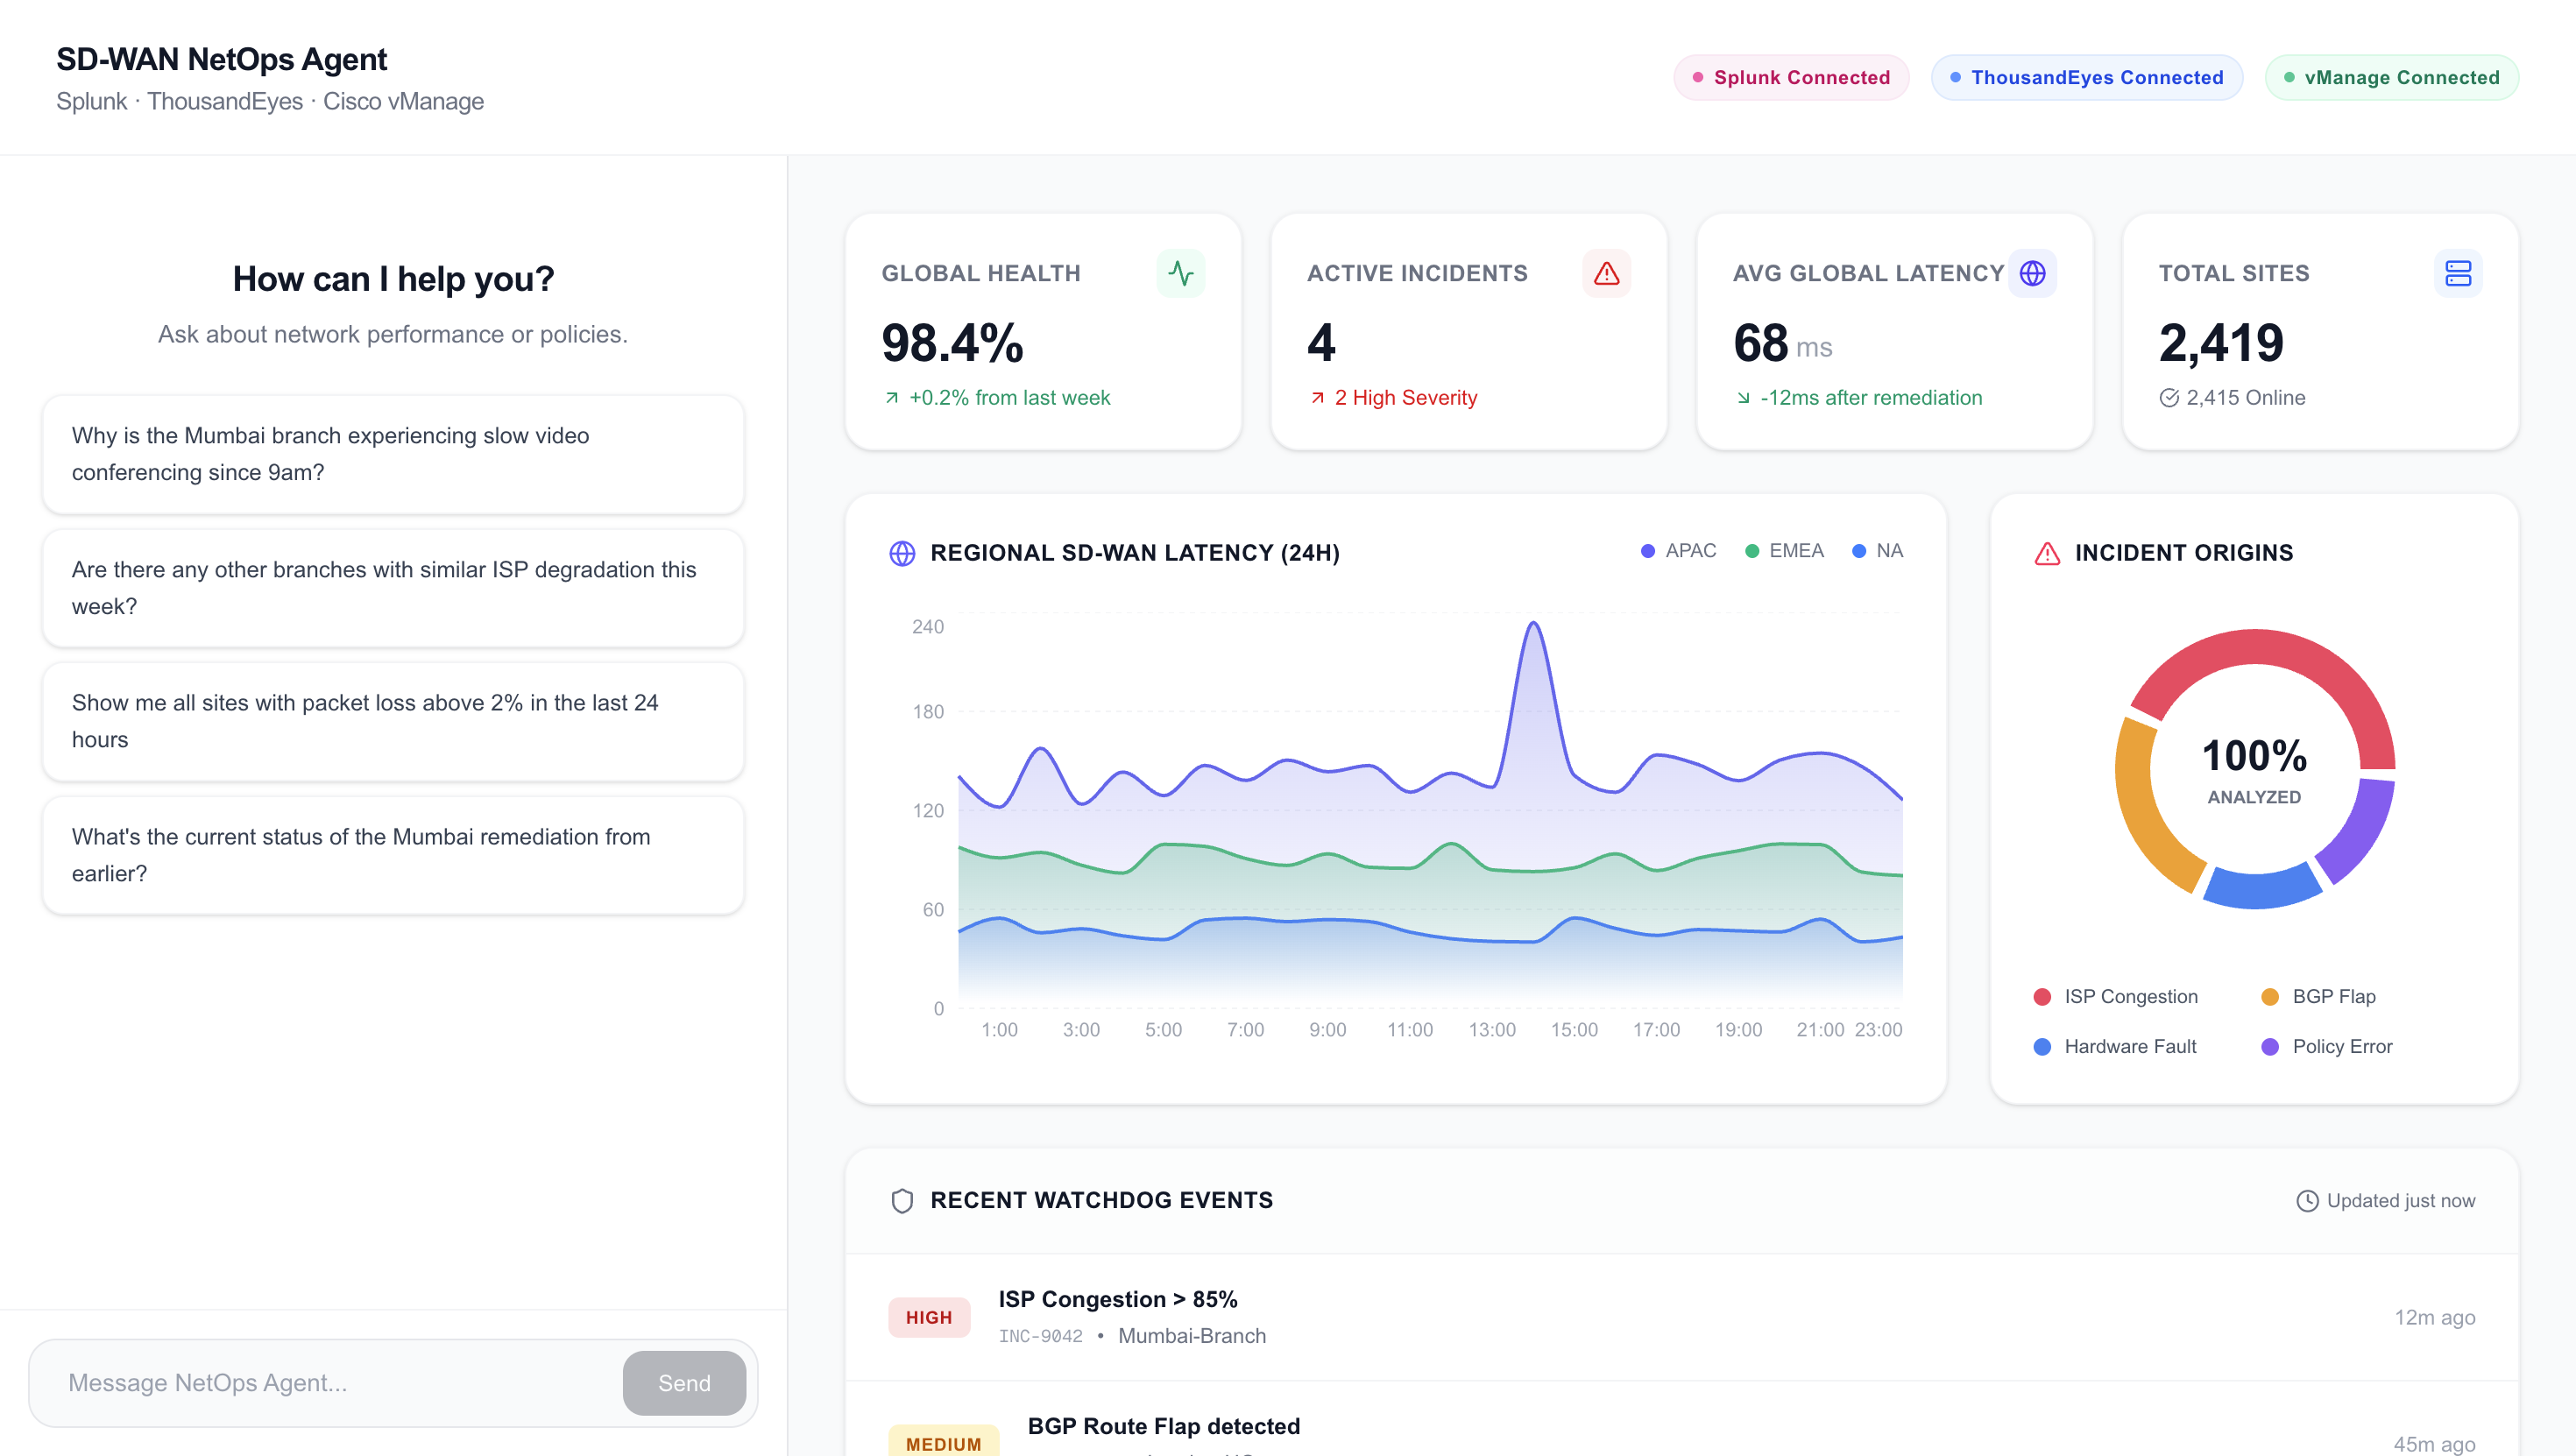
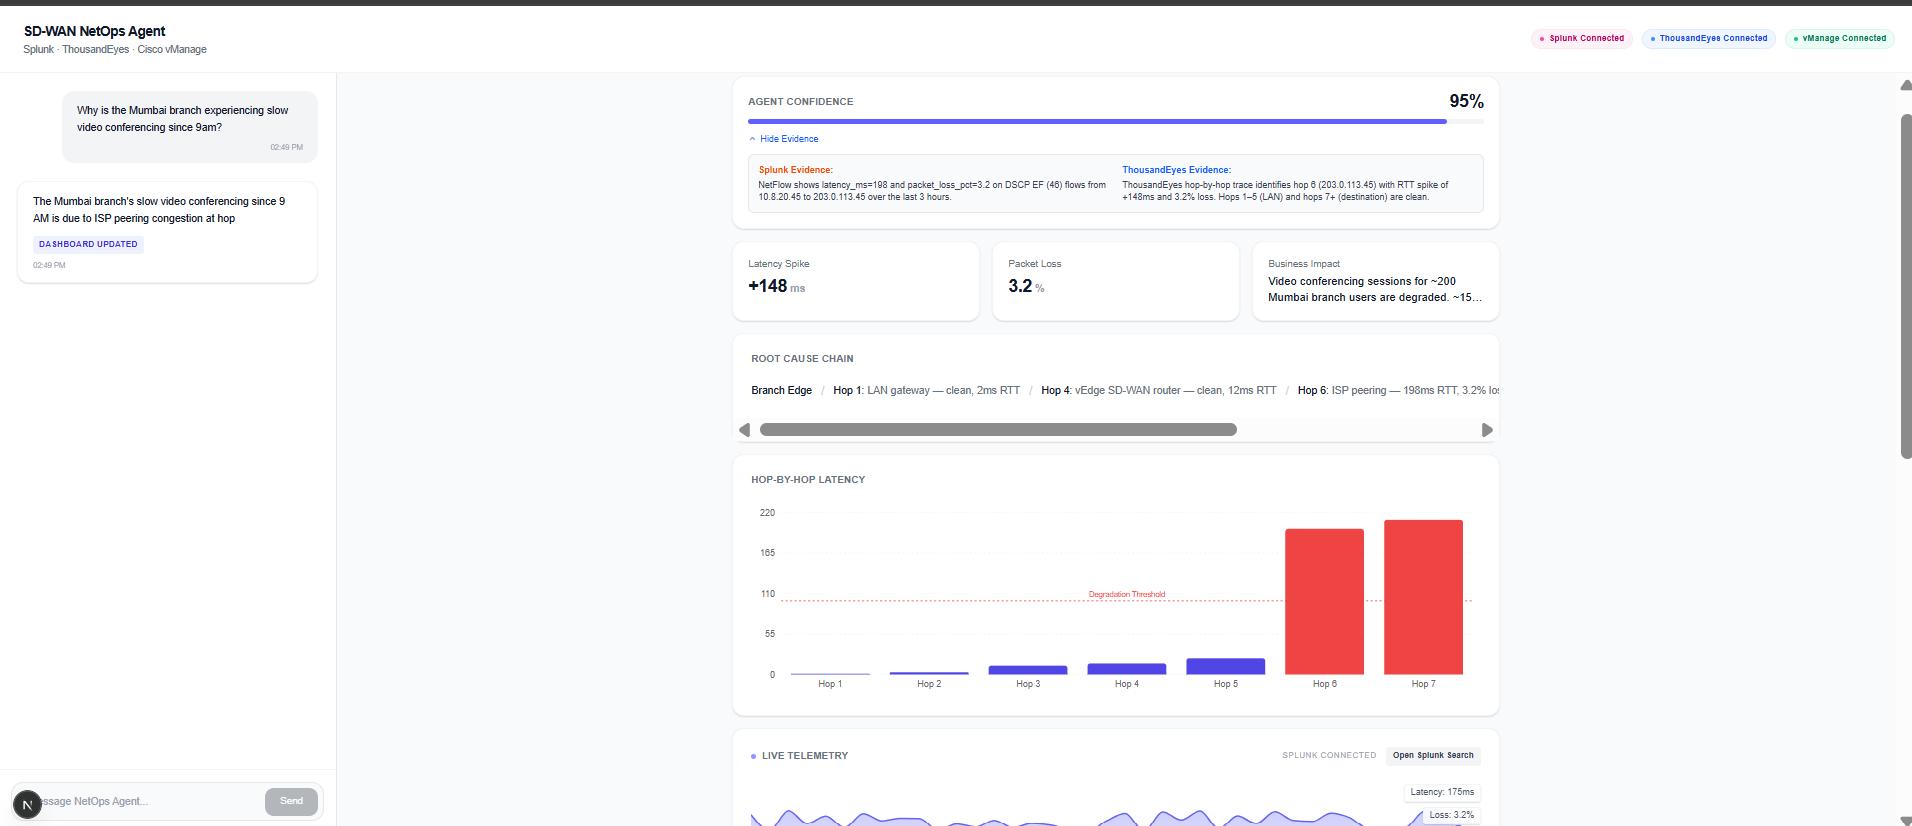
The CEO's video call is freezing. The helpdesk ticket says "Mumbai branch is slow." It's 9:15 AM.
We thought about Sarah — a Senior NetOps Engineer staring at three completely different dashboards. She opens Splunk for latency data. Then ThousandEyes for path traces. Then Cisco vManage to push a QoS policy fix. Each tool gives her a piece of the puzzle. None of them talk to each other.
By the time she connects all the dots and fixes it — the meeting is already over.
What hit us was this: all the data needed to fix the problem already existed in those three systems. The bottleneck wasn't the network. It was the human jumping between platforms.
That's what we built NetOps Agent to eliminate.
⚡ What it does
NetOps Agent uses four Splunk AI capabilities:
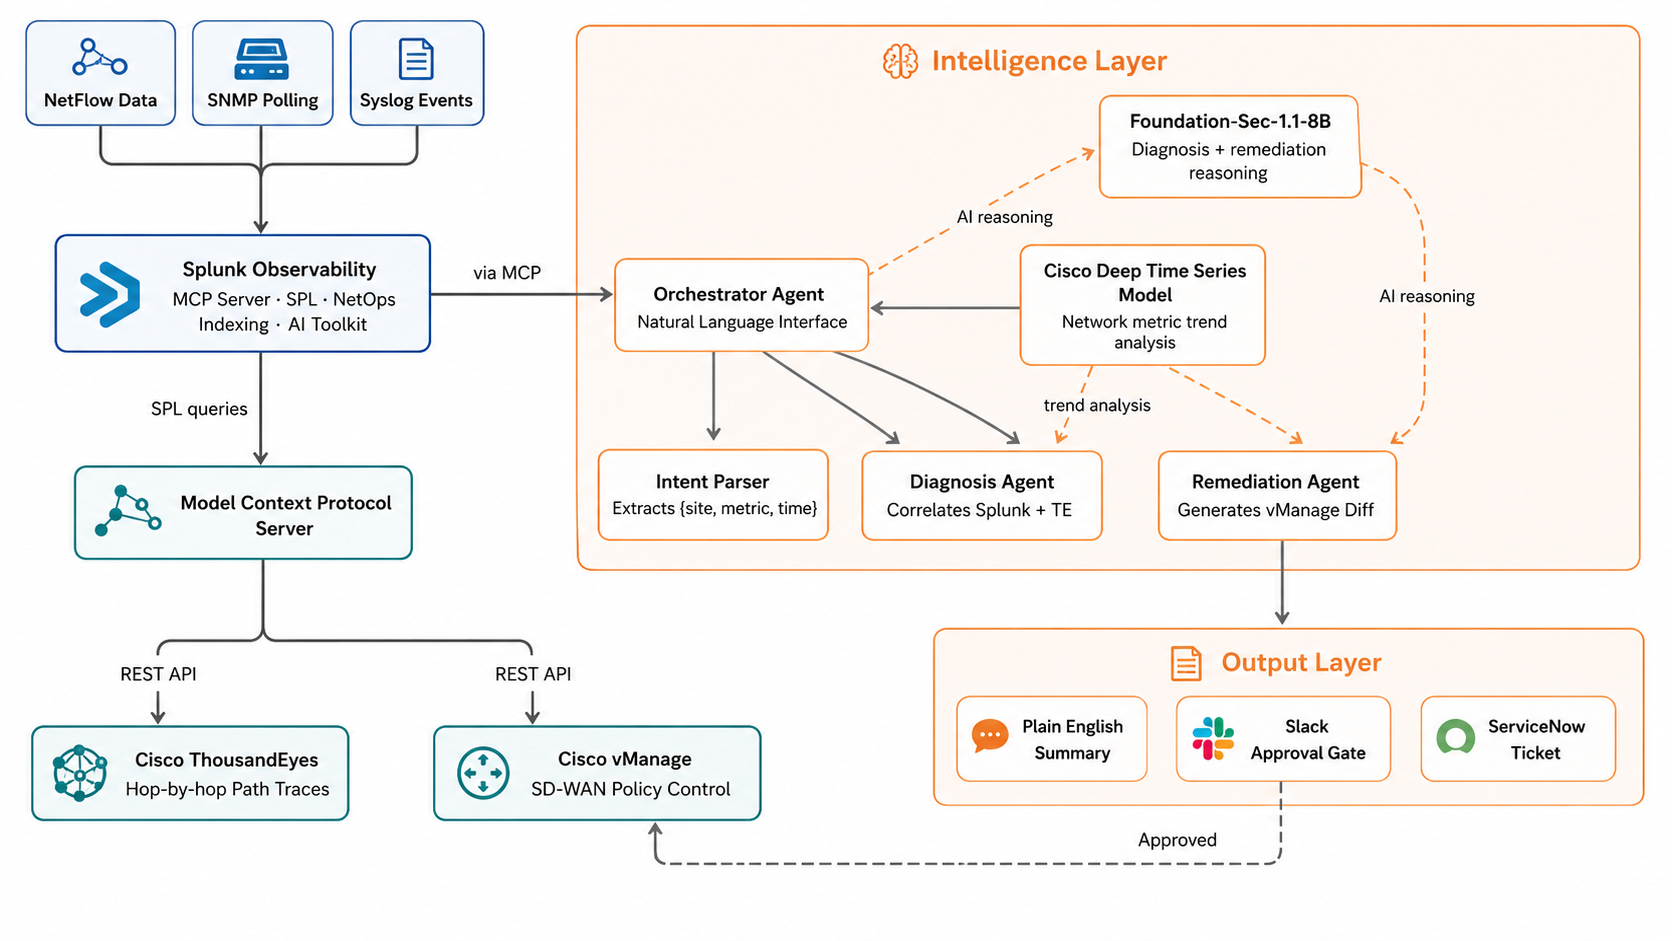
- ✅ Splunk MCP Server (app #7931) — agents query Splunk, ThousandEyes, and vManage via unified MCP tool calls
- ✅ Splunk Hosted Models — Cisco Deep Time Series Model for network metric trend analysis + Foundation-Sec-1.1-8B-Instruct for AI diagnosis and remediation reasoning
- ✅ Splunk AI Toolkit — hosts and serves the foundation models used across the agent pipeline
- ✅ Splunk Observability — real-time network telemetry ingestion, NetFlow indexing, and SPL metric queries
NetOps Agent is an intent-driven, autonomous network operations system built on Splunk that diagnoses network problems and remediates them — before the user even finishes explaining what's wrong.
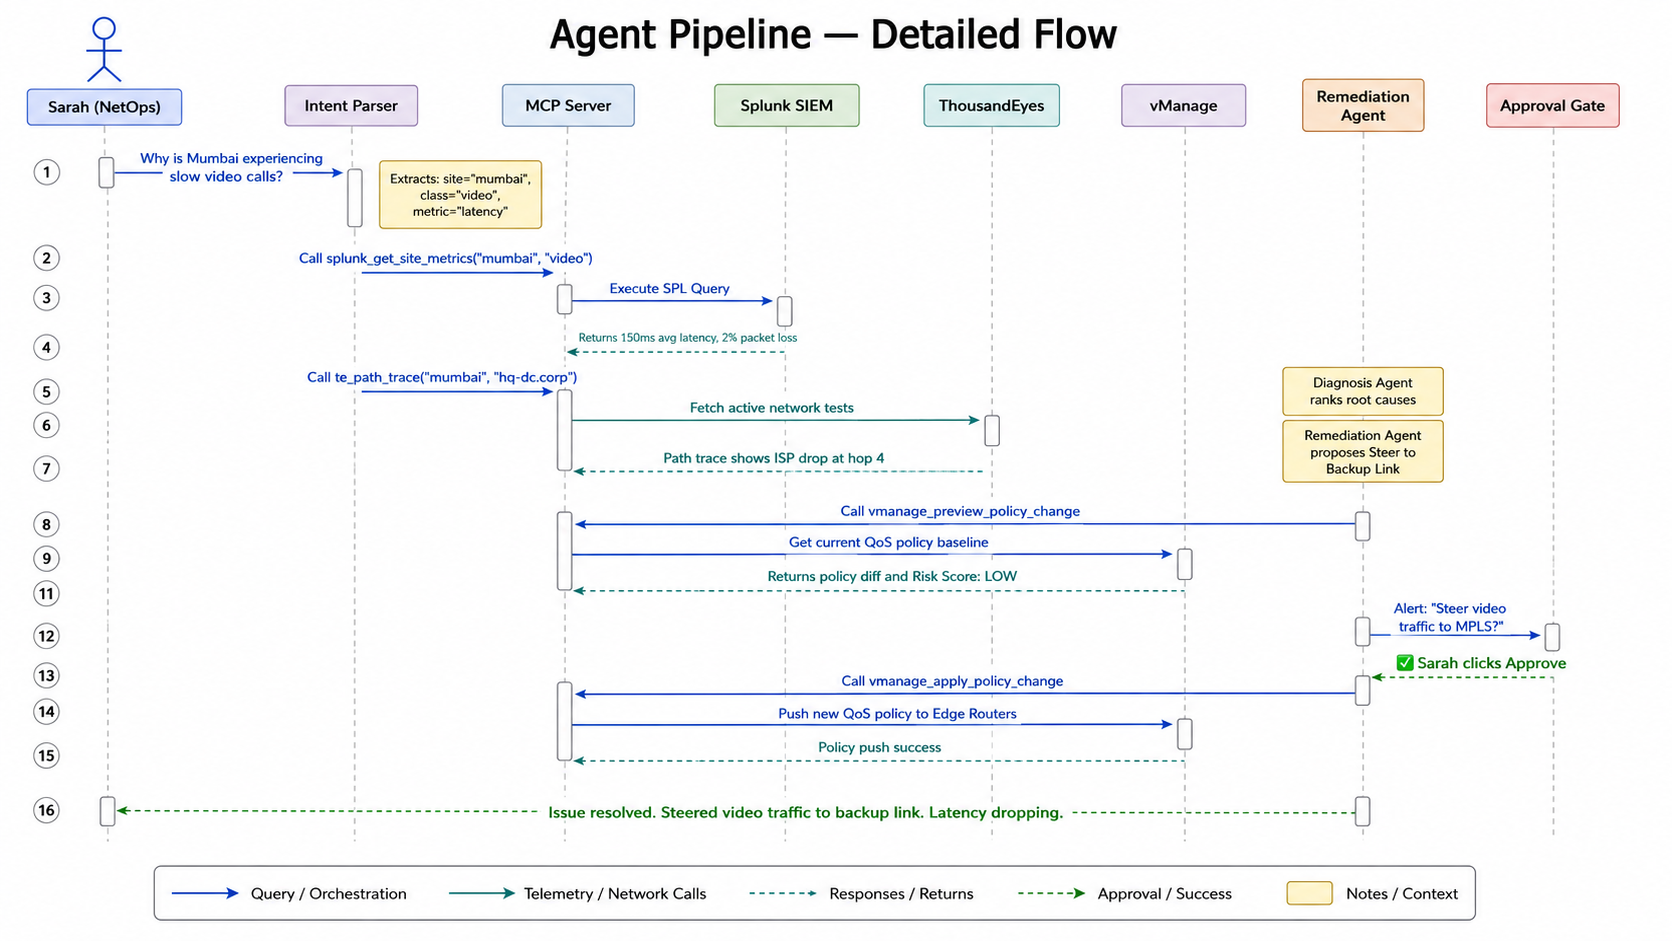
Here's what happens when Sarah asks "Why is Mumbai slow?":
| Step | What NetOps Agent does | Time |
|---|---|---|
| 🗣️ Understand | Intent Parser extracts site=Mumbai, metric=latency, class=video | T+2s |
| 📡 Query | Splunk MCP returns 150ms avg latency, 2% packet loss on video traffic | T+5s |
| 🔍 Trace | ThousandEyes MCP finds ISP packet drop at hop 4 | T+8s |
| 🧠 Diagnose | Splunk Hosted AI correlates both datasets, ranks root causes, generates vManage policy diff | T+12s |
| ✅ Approve | Sarah gets a Slack message — one click to approve the fix | T+13s |
| 🌐 Remediate | SD-WAN policy pushed to edge routers, video traffic rerouted to backup link | T+15s |
The numbers that matter:
45 minutesof manual triage reduced to15 seconds3 platformsunified through a single natural language interface4 autonomous agentsoperating in parallel0 manual SPL querieswritten by the operator100%human approval required before any network change
🛠️ How we built it
We built NetOps Agent in layers, each one feeding into the next:
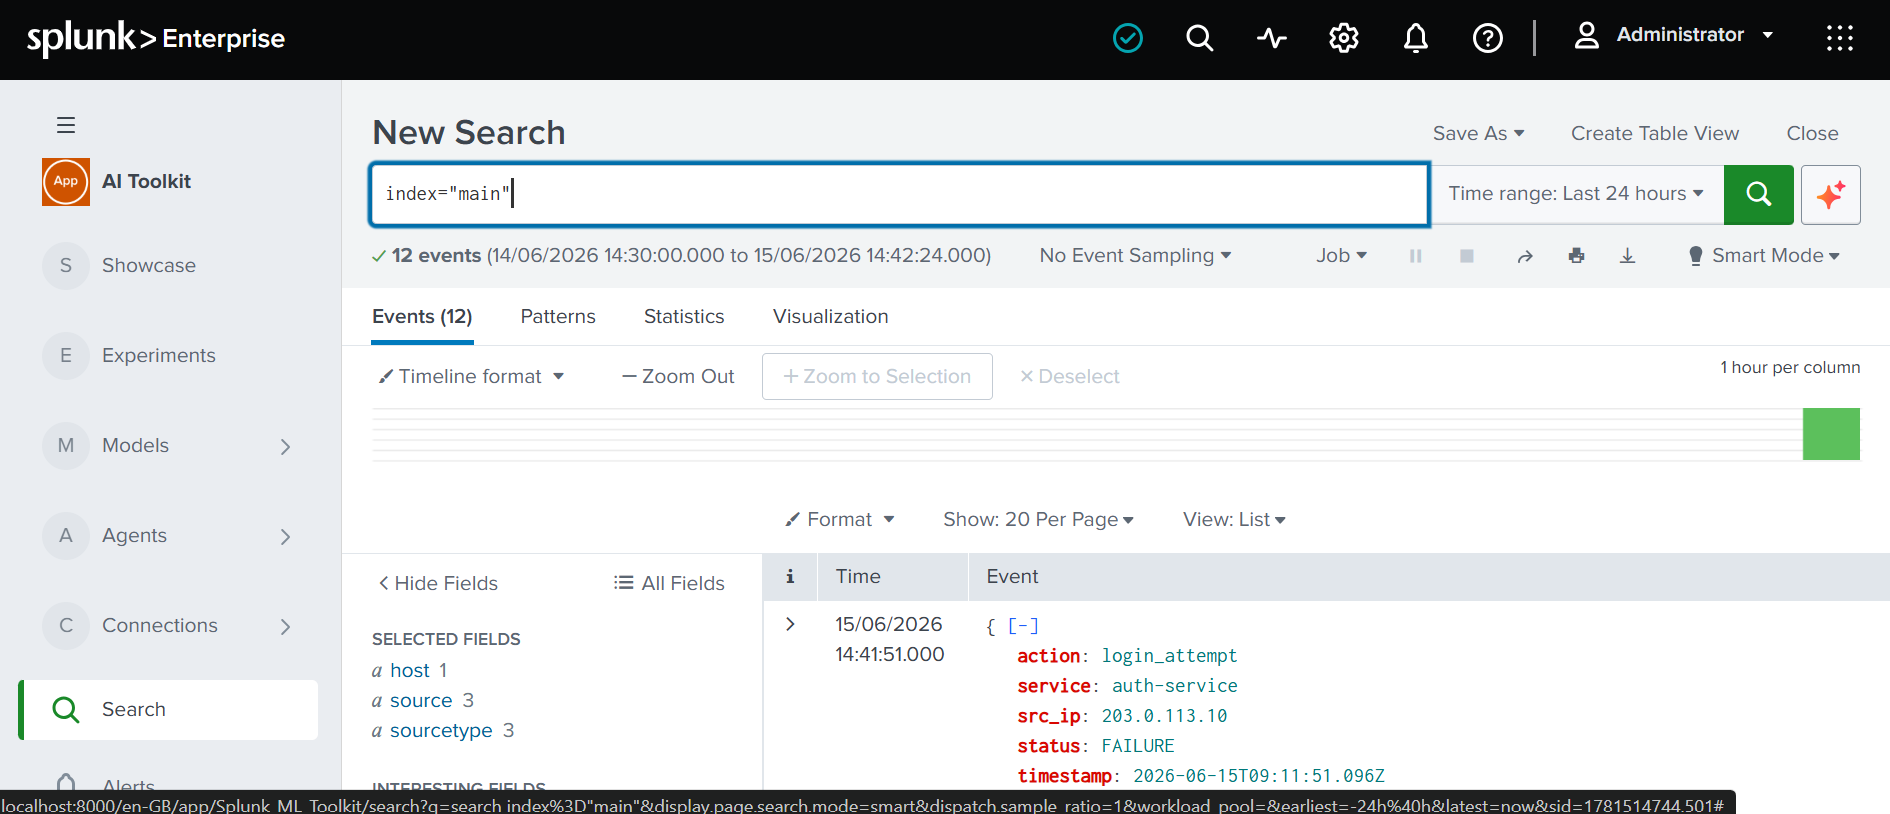
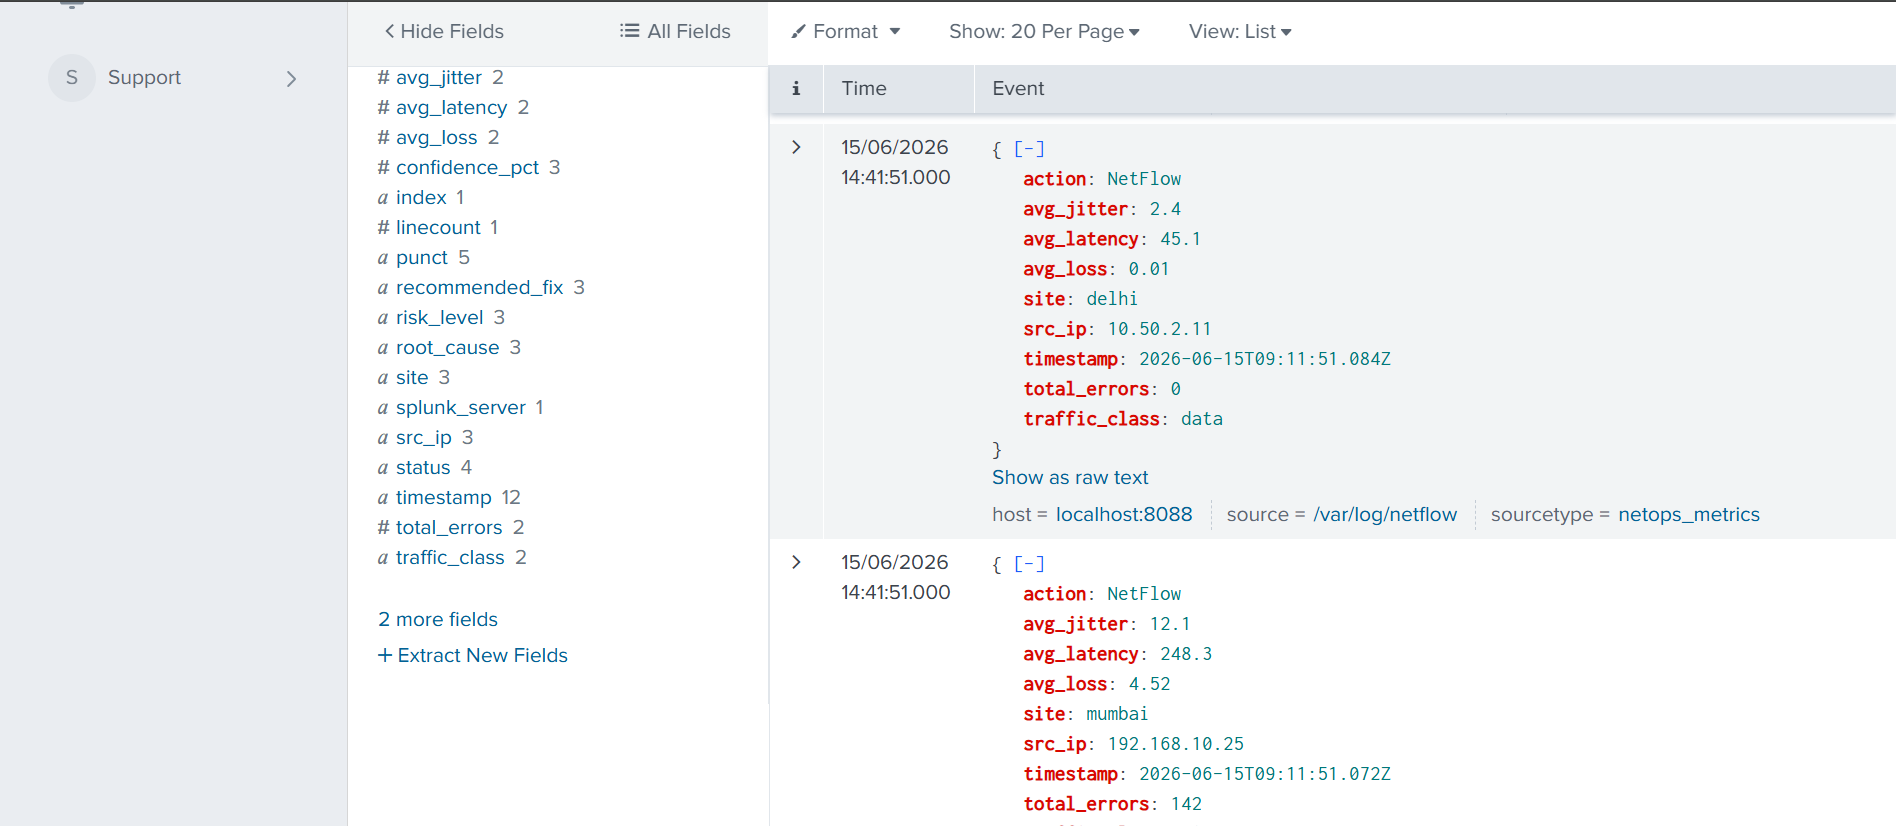
Layer 1 — Data Ingestion (Splunk Observability) NetFlow, SNMP polling, and syslog events from all branch offices flow continuously into Splunk. Network telemetry is indexed and searchable in real time. SPL aggregations handle site-level latency metrics, packet loss, and traffic class breakdowns.
Layer 2 — Intelligence (Splunk MCP Server + Splunk Hosted Models) We installed the official Splunk MCP Server app (Splunkbase app #7931). The Orchestrator Agent calls standardized MCP tools for all three platforms. For AI reasoning, we use two Splunk Hosted Models via the Splunk AI Toolkit:
- Cisco Deep Time Series Model — analyzes historical latency and packet loss trends from Splunk to detect whether a current spike is a genuine anomaly or an expected traffic pattern
- Foundation-Sec-1.1-8B-Instruct — powers the Diagnosis Agent and Remediation Agent, reasoning over the correlated Splunk + ThousandEyes data to rank root causes and generate the vManage policy diff
This means all AI inference runs through Splunk's own hosted model infrastructure — no external LLM dependency, no data leaving the Splunk environment.
stats avg(latency_ms) by site, traffic_class
| where site="mumbai"
| sort -avg_latency
The Intent Parser transforms "Mumbai is slow" into structured JSON parameters. The Diagnosis Agent runs Splunk and ThousandEyes queries in parallel and correlates them automatically.
Layer 3 — Path Analytics (Cisco ThousandEyes via MCP)
ThousandEyes is wrapped as an MCP tool. The agent calls te_path_trace("mumbai", "hq-dc") and gets hop-by-hop path data back as structured JSON. No manual test navigation required.
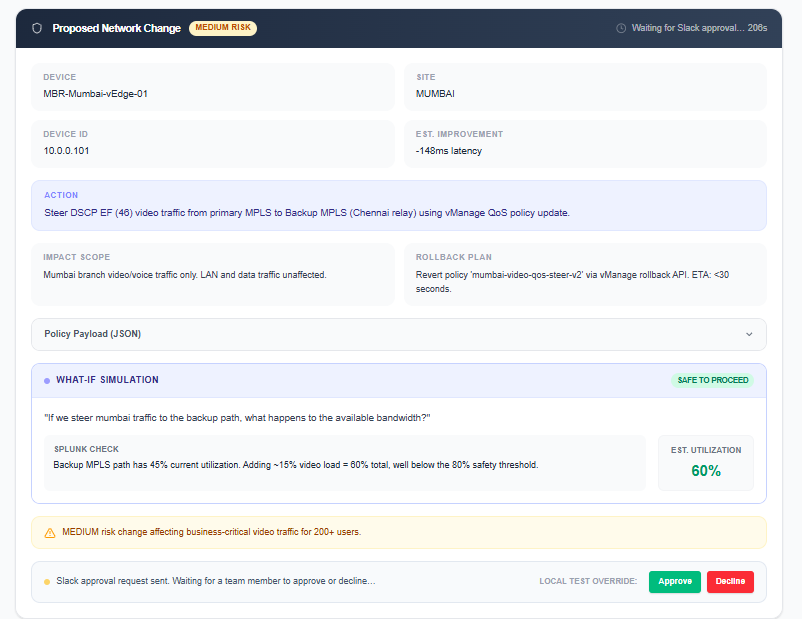
Layer 4 — Remediation (Cisco vManage via MCP)
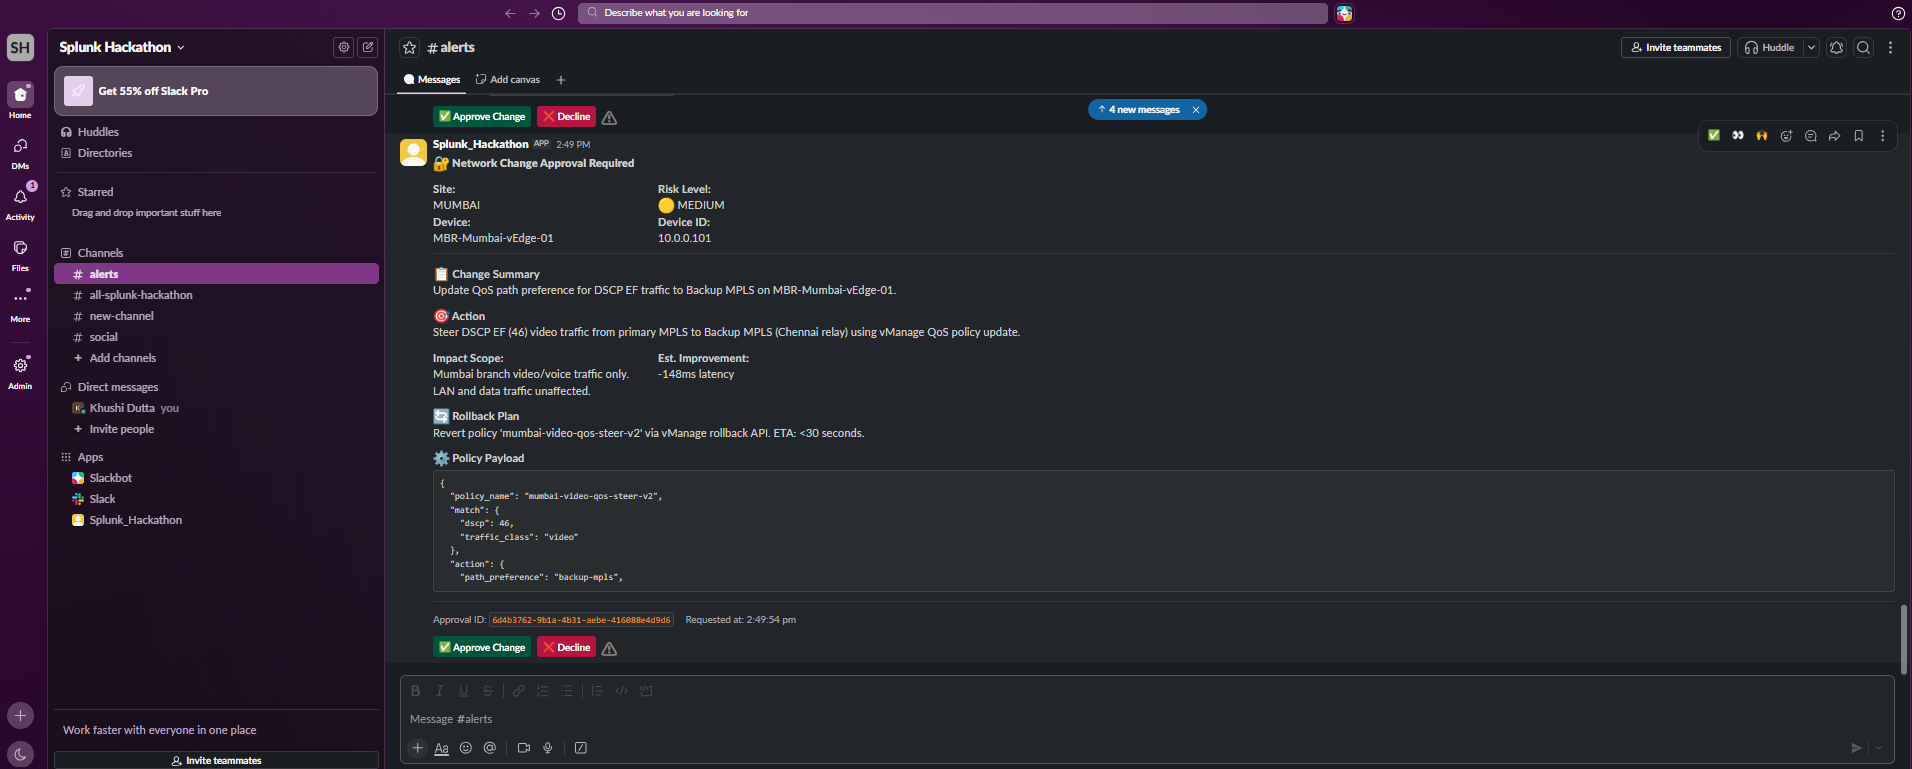
The Remediation Agent calls vmanage_preview_policy_change() first — generating a full diff and a risk score before touching anything. The vmanage_apply_policy_change() tool explicitly rejects execution without a Slack-generated approval token.
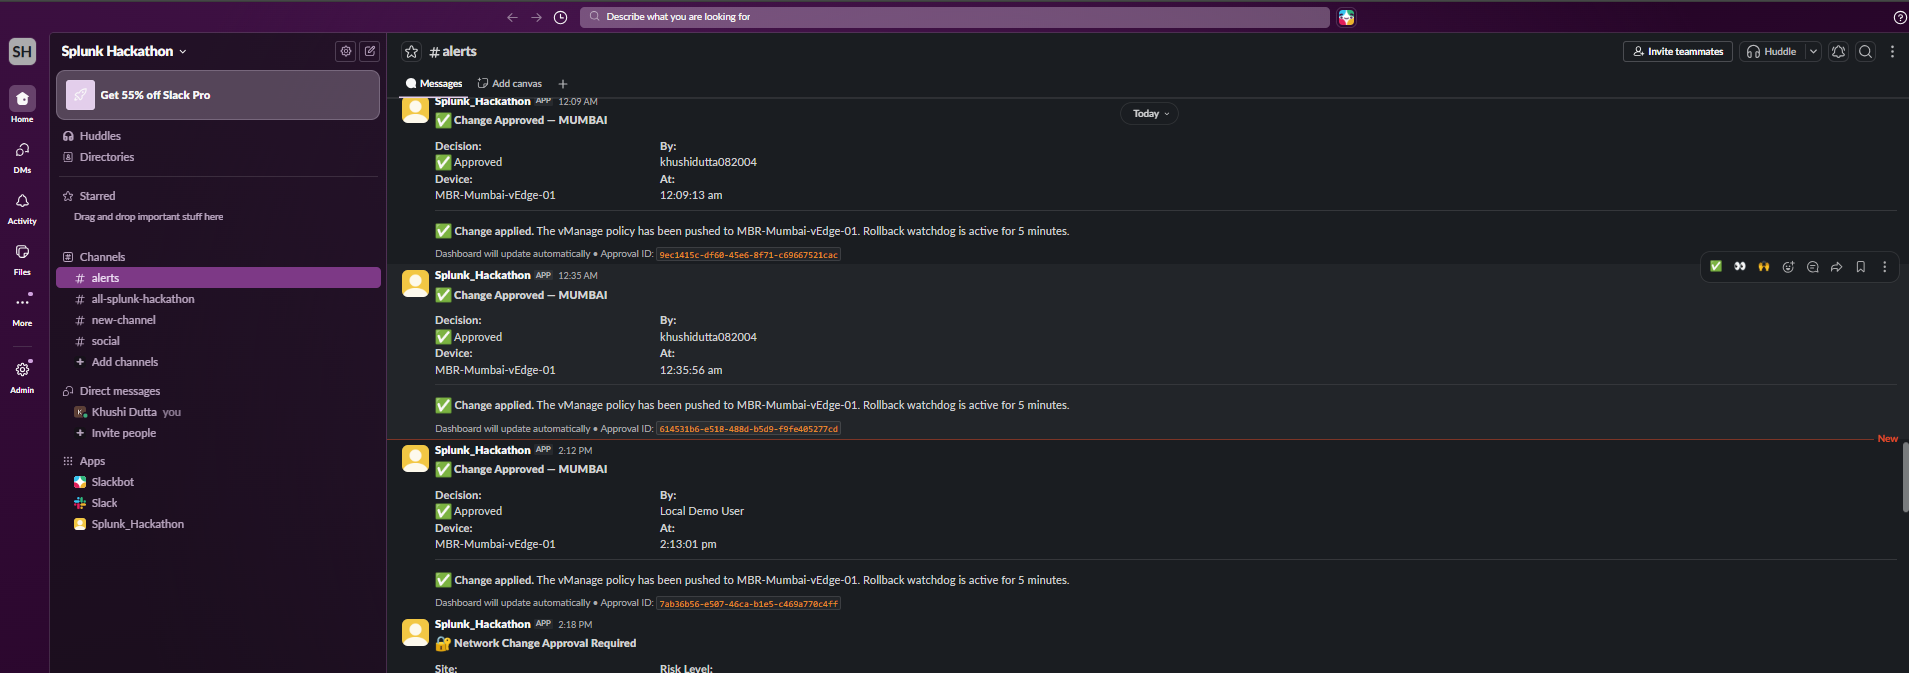
Layer 5 — Human Approval Gate (Slack) Every remediation produces a Slack message with the proposed change, the risk score, and a single Approve button. No network change happens without it.
Layer 6 — Natural Language Dashboard (Next.js) The entire system is accessible through a chat interface. Sarah types in plain English. The system streams its reasoning steps back to her in real time, so she can see exactly what the agent is doing and why.
🧱 Challenges we ran into
Correlating data from three different systems in real time Splunk, ThousandEyes, and vManage each have completely different data models, authentication methods, and response formats. Making the Diagnosis Agent reason across all three required building a unified JSON schema that normalised the outputs before correlation.
Making the MCP abstraction actually work The Model Context Protocol is designed to give AI agents a clean interface to external tools. But wrapping Splunk SPL, ThousandEyes REST, and vManage APIs each required careful tool definition. The agent needed to know what parameters each tool accepted, what it returned, and how to chain them logically.
Switching from cloud LLM to Splunk Hosted Models We initially built the Intent Parser and Diagnosis Agent using a general-purpose cloud LLM. Migrating to Splunk Hosted Models — specifically the Cisco Deep Time Series Model for metric trend analysis and Foundation-Sec-1.1-8B for reasoning — required re-tuning our prompts for each model's characteristics. The Cisco Deep Time Series Model in particular thinks about data differently than a general-purpose model, which made the anomaly detection significantly more accurate for network telemetry.
The approval token problem
We needed to ensure the Remediation Agent could never apply a vManage change without real human approval. We solved this with a cryptographically signed token generated by the Slack bot and required as a parameter by vmanage_apply_policy_change. If the token is missing or invalid — the tool refuses to execute.
Intent parsing edge cases Natural language is messy. "Mumbai calls are choppy" and "the video conferencing at Branch 4 is unusable" both mean the same thing. Training the Intent Parser to handle operator slang, branch aliases, and ambiguous time references without breaking the downstream query took significant iteration.
Rollback safety After a policy push, we needed a watchdog that could measure whether the metric actually improved. If latency didn't drop by at least 20% within 5 minutes, the agent auto-rolls back via vManage. Getting the post-remediation Splunk query timing right to avoid false rollbacks required careful tuning.
🏆 Accomplishments that we're proud of
Built a true multi-system agentic pipeline — not a dashboard, not a chatbot. A system that reads from Splunk, queries ThousandEyes, generates vManage policy diffs, and pushes changes — all autonomously, all in under 15 seconds.
Four Splunk AI capabilities in one project — Splunk MCP Server, Splunk Hosted Models (Cisco Deep Time Series + Foundation-Sec), Splunk AI Toolkit, and Splunk Observability all working together in a single agent pipeline. Each one doing a genuinely different job.
Splunk Hosted Models replacing a cloud LLM — the Cisco Deep Time Series Model handles network metric trend analysis with far better accuracy than a general-purpose model, because it understands time-series network data natively. All inference runs inside Splunk's infrastructure.
Human-in-the-loop that actually protects the network — the Slack approval gate with cryptographic tokens means no network change can ever be applied by the AI alone. The system is designed to be trusted, not just impressive.
Natural language that actually works for NetOps — "Mumbai is choppy", "Branch 4 calls are dropping", "video is slow at HQ" all route to the same correct SPL query. The Intent Parser handles real operator language, not just demo-perfect inputs.
Streaming reasoning UI — Sarah can see every step the agent takes in real time. Not a black box. Not just a final answer. She watches it query Splunk, get the path trace, and build the fix — exactly as if a senior engineer was narrating their own thought process.
📚 What we learned
MCP is the right abstraction for multi-system agents. Wrapping every external system as an MCP tool meant the AI agent only needed to know tool names and parameters — not API endpoints, authentication schemes, or response parsing. This made the agent dramatically easier to debug and extend.
Splunk Hosted Models change the compliance conversation. Using Cisco Deep Time Series Model and Foundation-Sec-1.1-8B inside Splunk's own infrastructure means network telemetry never leaves the Splunk environment for AI inference. For enterprise NetOps teams with strict data residency requirements, this is the difference between "interesting demo" and "actually deployable."
Domain-specific models outperform general ones on network data. The Cisco Deep Time Series Model, specifically trained on network telemetry patterns, detected latency anomalies that a general-purpose LLM consistently missed. The right model for the right data matters far more than raw model size.
Parallelism is non-negotiable at 15 seconds. The Diagnosis Agent queries Splunk and ThousandEyes simultaneously. Running them sequentially would have doubled the time. Building the agent to fire parallel MCP calls and merge the results was the single biggest performance improvement we made.
Governance is a feature, not an afterthought. Early versions let the agent apply changes automatically. Every engineer who saw it was uncomfortable with that. The Slack approval gate with cryptographic tokens turned "this is impressive" into "this is actually deployable." Trust matters more than speed.
Splunk is the source of truth — use it as one. We were tempted to cache network metrics locally. Instead we query Splunk for everything and let it be the authoritative source. This means the agent's answers are always fresh, always auditable, and always consistent with what the rest of the team sees.
🚀 What's next for NetOps Agent
Proactive alerting before the helpdesk ticket arrives The background polling loop already runs SPL anomaly detection. The next step is surfacing proactive alerts to Slack: "Mumbai is trending toward degradation — intervene now?" before any user complains.
AppDynamics integration Combining ThousandEyes network paths with AppDynamics application transactions would let us pinpoint the exact API failure point and calculate direct business impact: "23 failed checkout sessions → ₹4.2L revenue impact."
What-if simulations Before pushing a policy, simulate the cascade: "If we steer Mumbai video to Chennai backup, what happens to Chennai's available bandwidth?" Run it against historical Splunk data before touching the network.
Natural language policy definitions Let operators define permanent rules in plain English: "Whenever any branch has more than 2% packet loss on voice traffic, auto-steer to backup." Translated to vManage policy templates and triggered automatically.
Multi-region remediation memory Build a persistent memory of which SD-WAN changes worked for which scenarios. When Mumbai has the same ISP drop next month, the agent already knows the best fix from last time — without asking.
"3 dashboards. 15 seconds. 4 agents. Zero manual configurations."
"While the meeting was still happening — NetOps Agent fixed the connection."


Log in or sign up for Devpost to join the conversation.