-
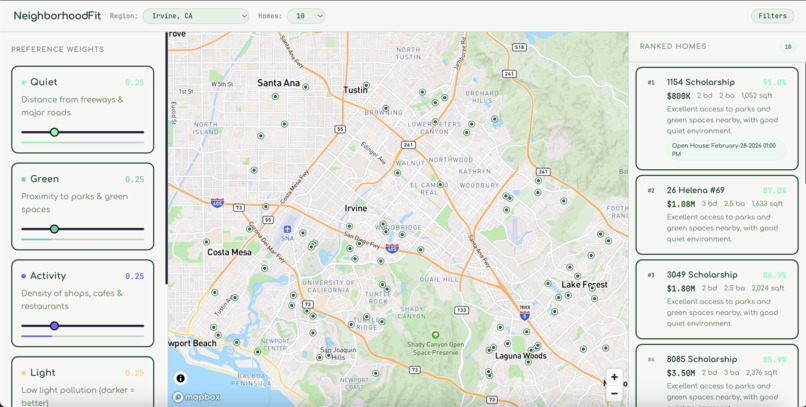
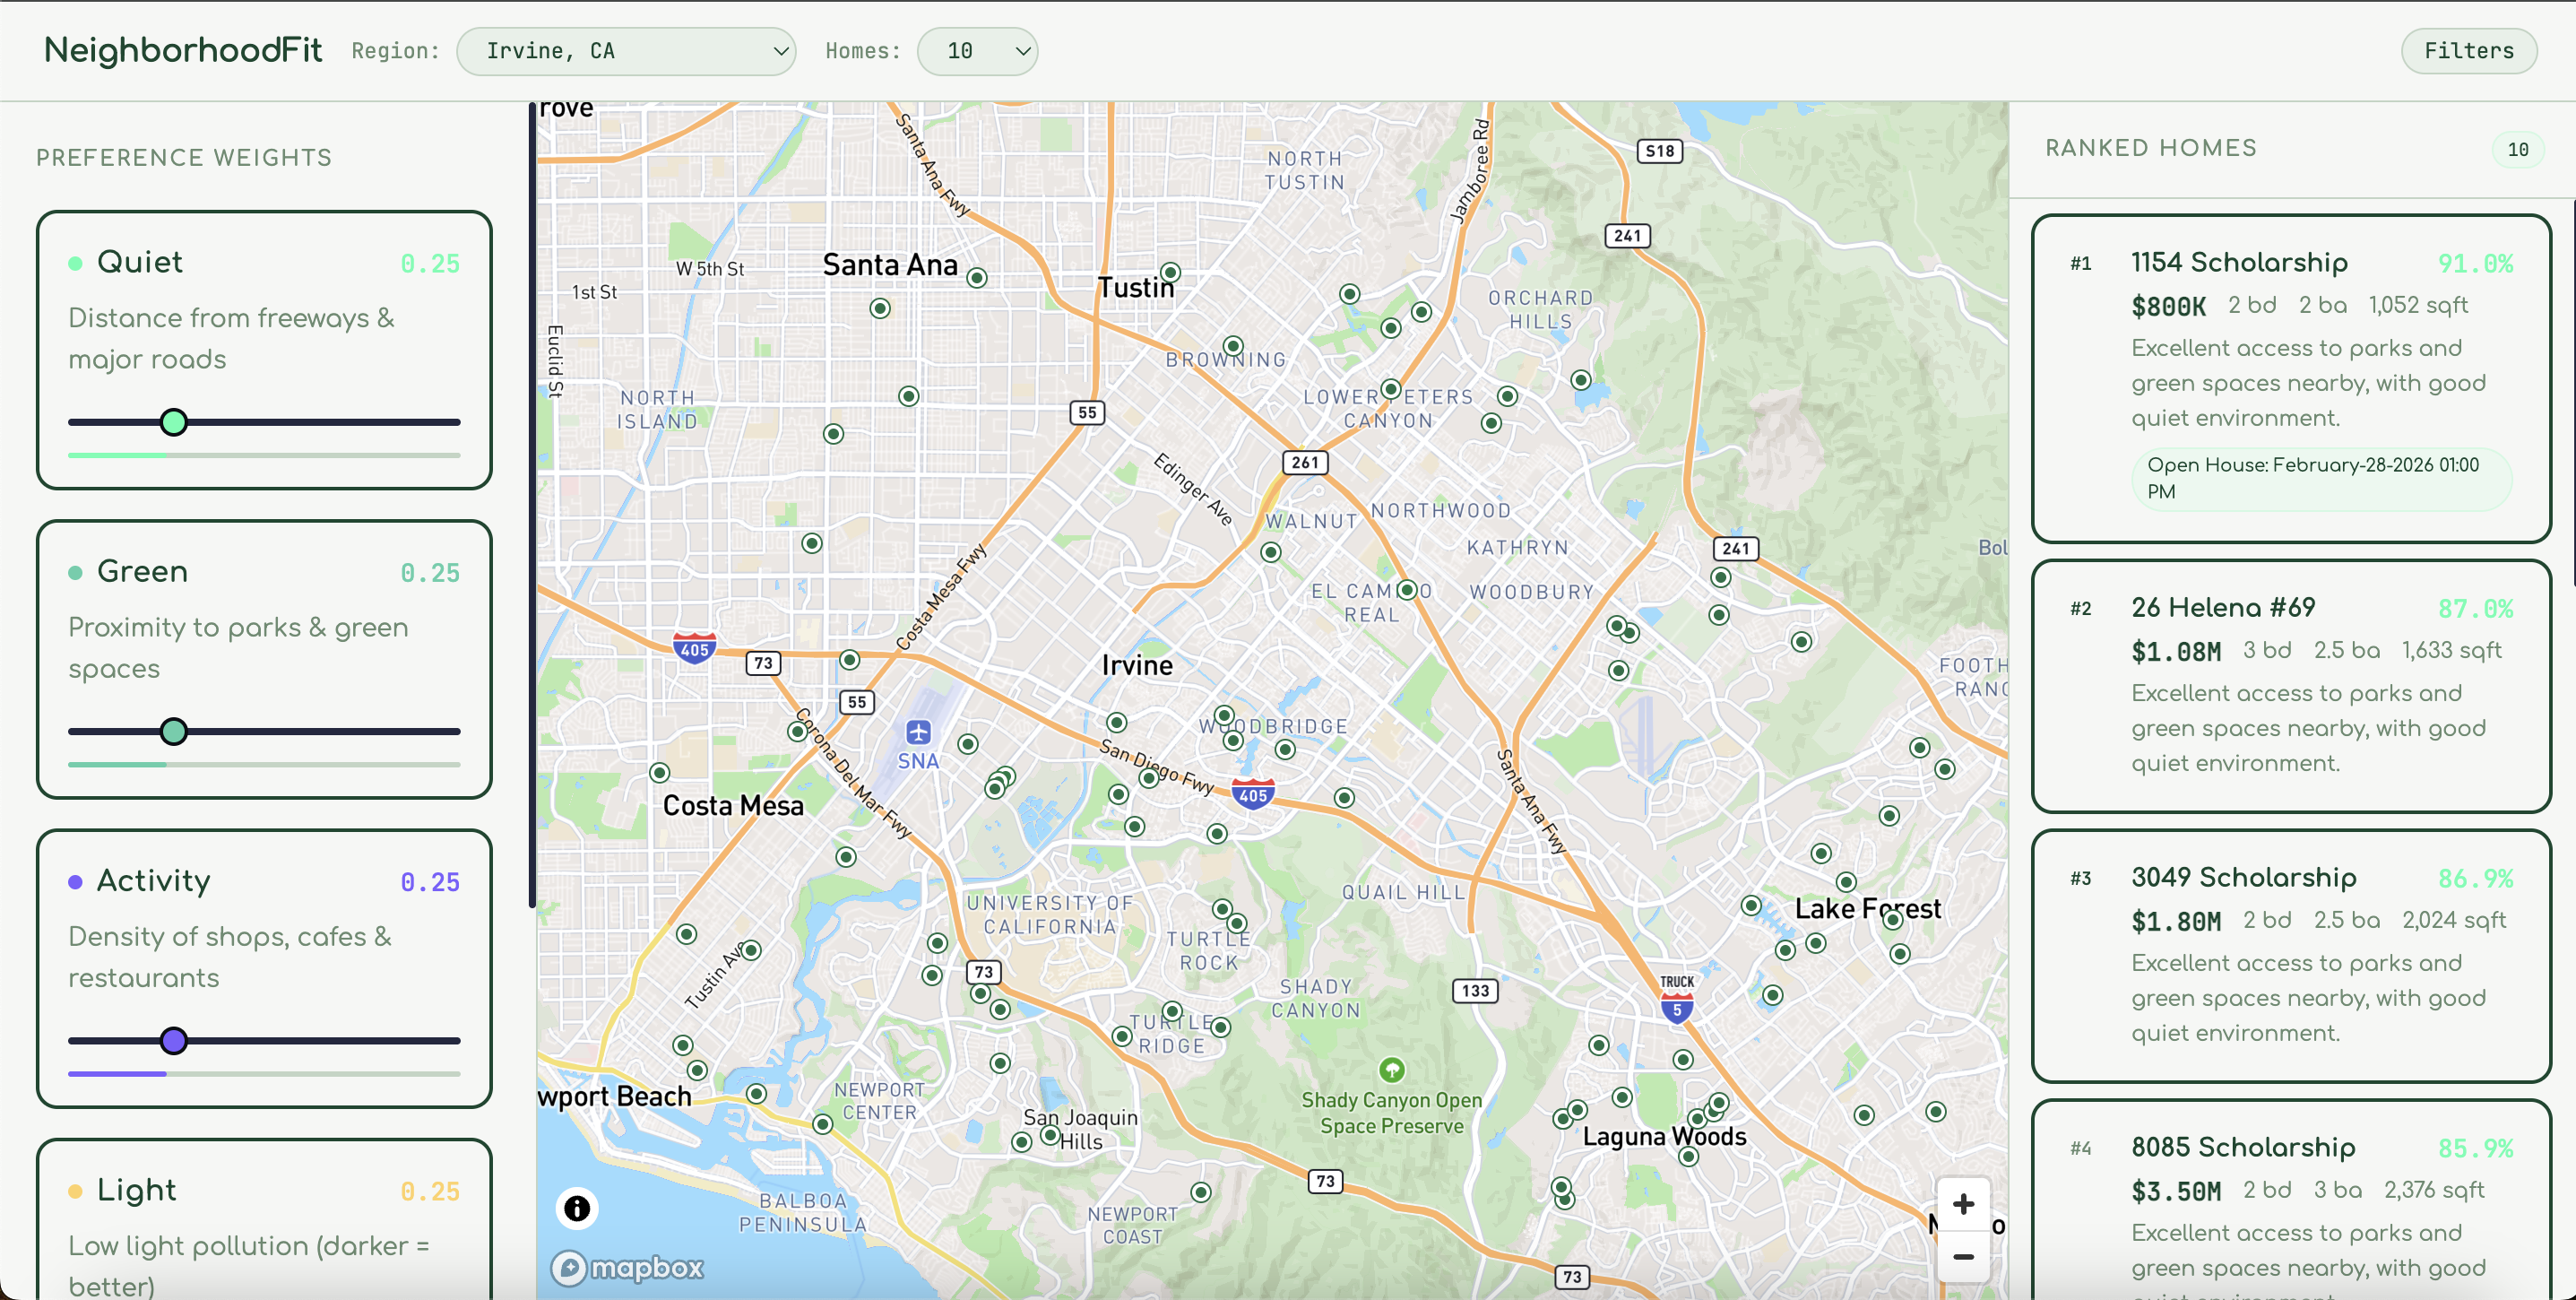
NeighborhoodFit’s interactive map interface displaying housing data and layered neighborhood insights.
-
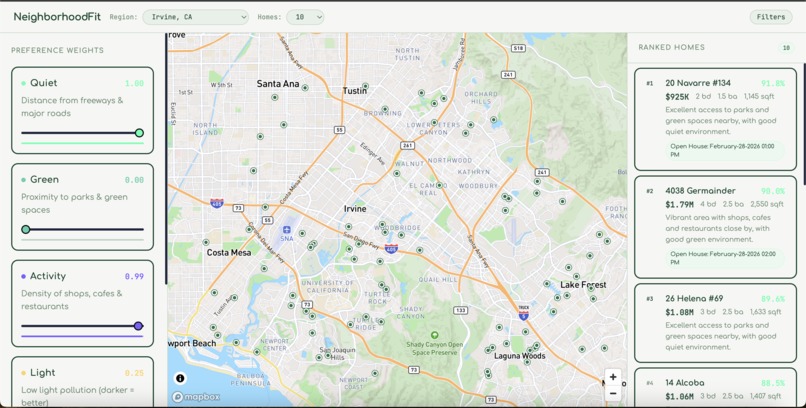
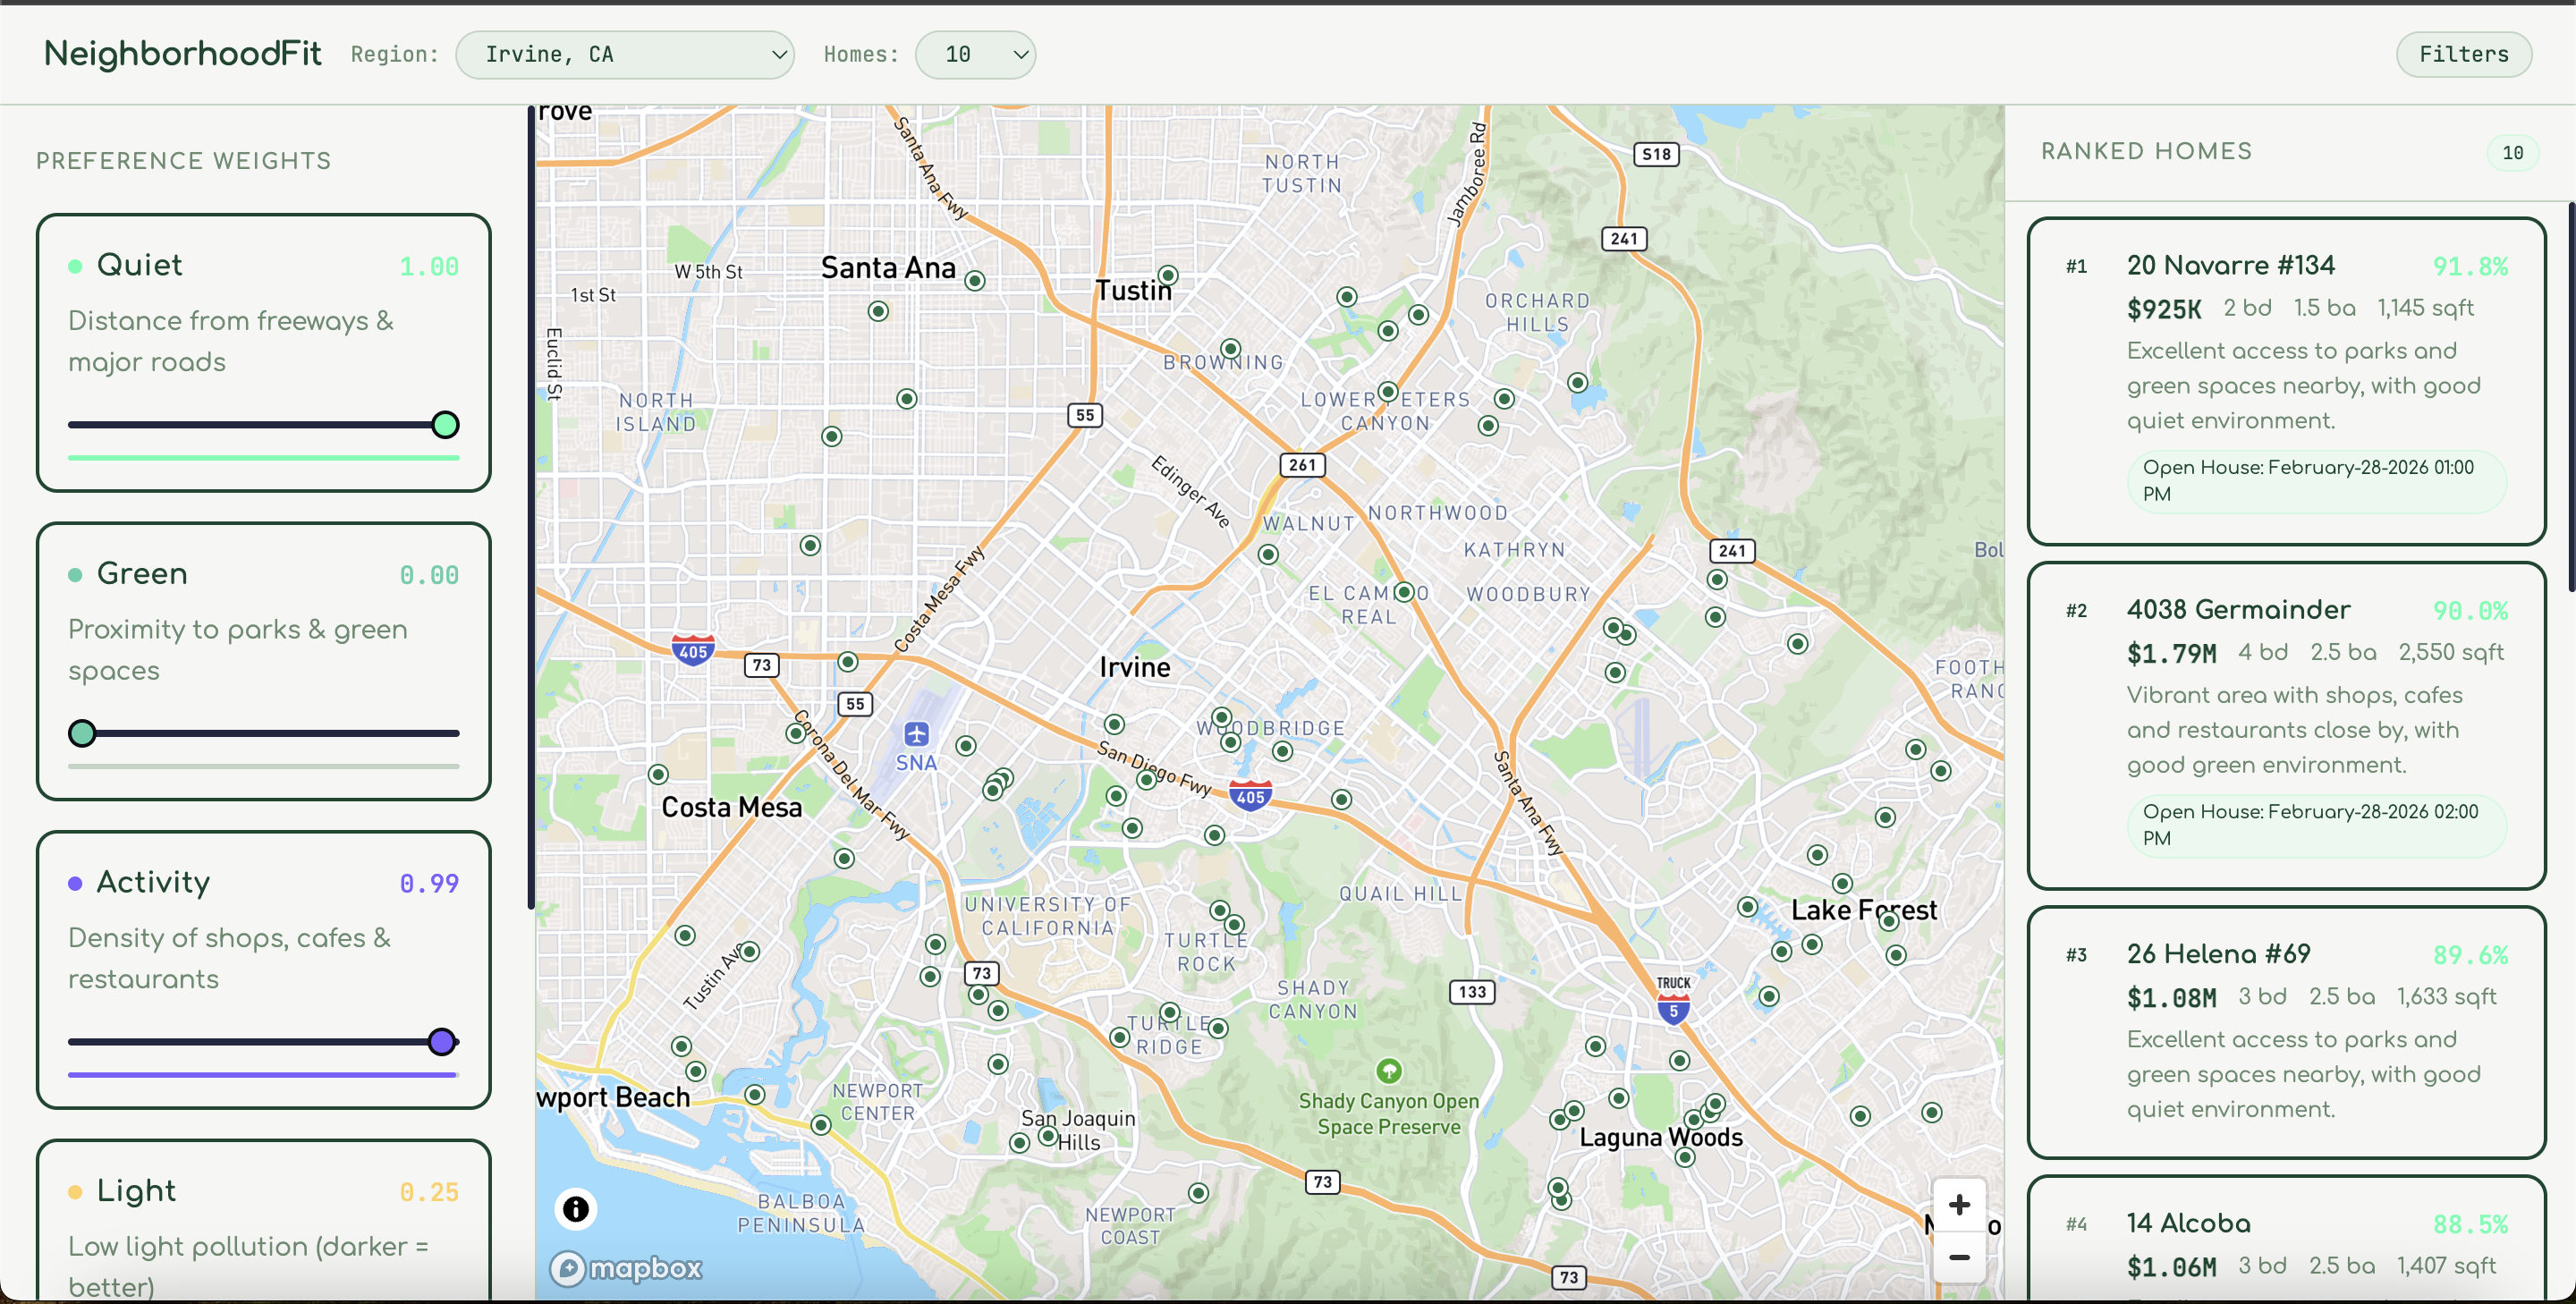
Real-time neighborhood scoring updates based on infrastructure, amenities, and environmental factors.
-
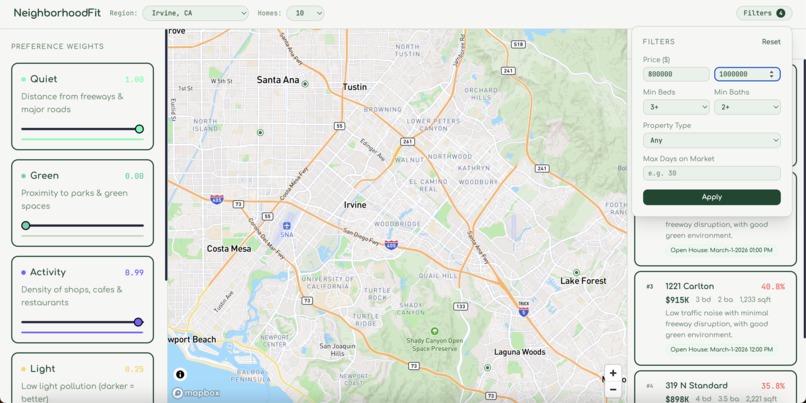
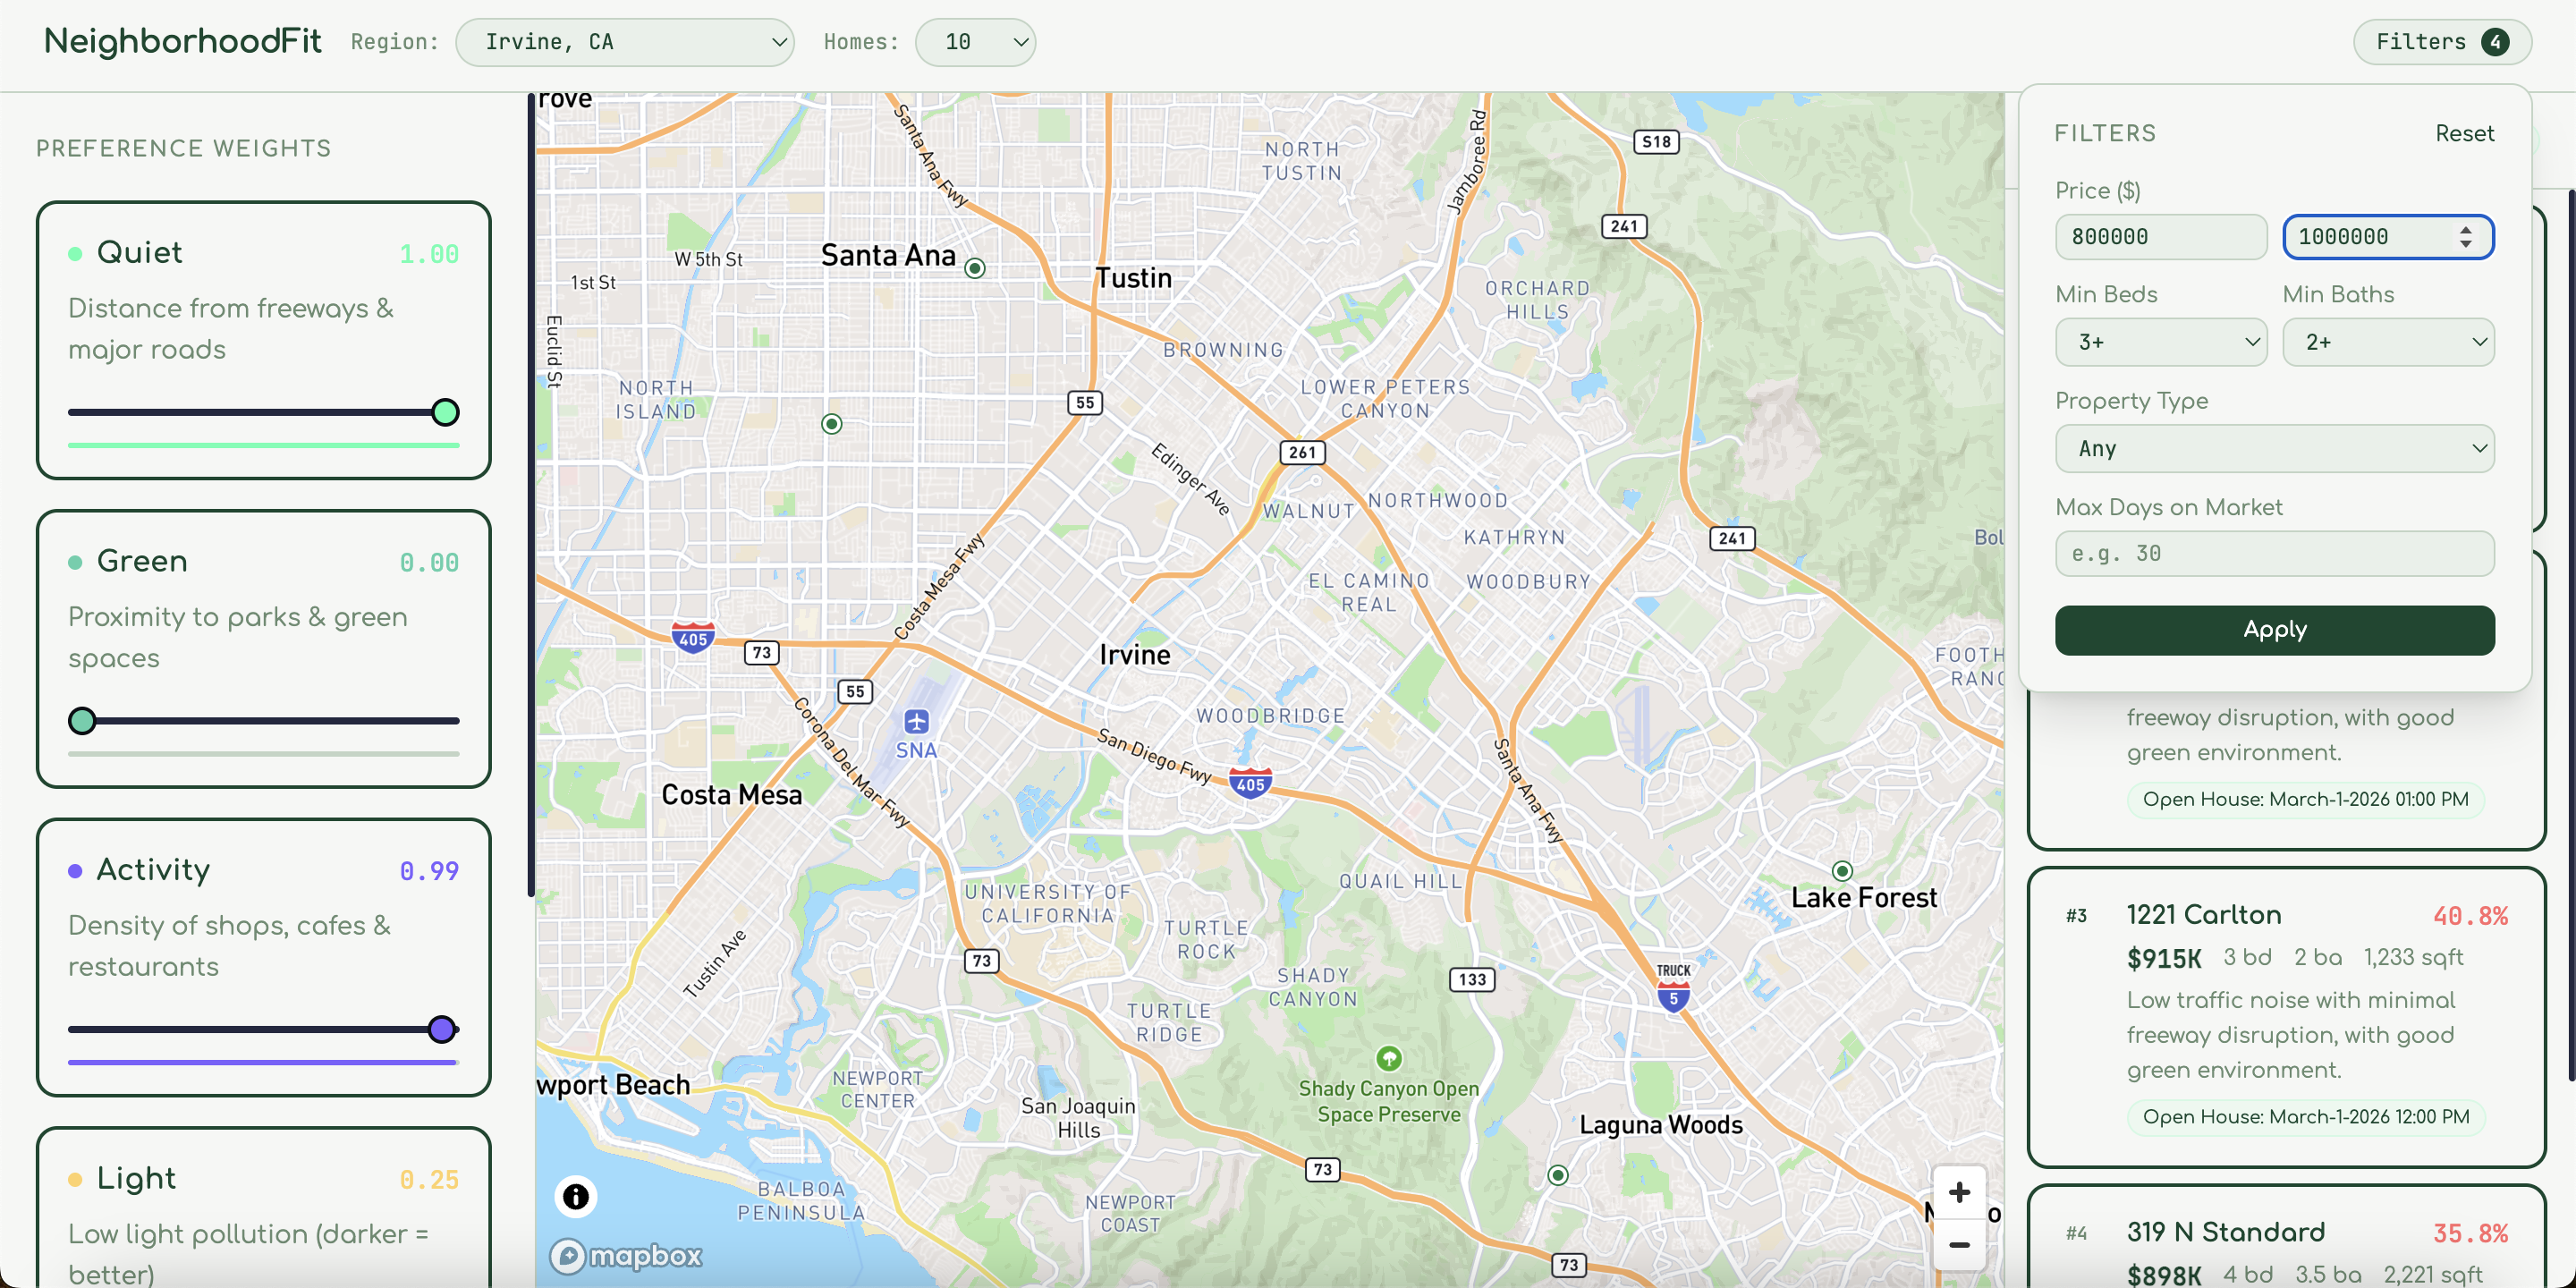
Advanced filters for price, bedrooms, and preferences to personalize your home search.
-
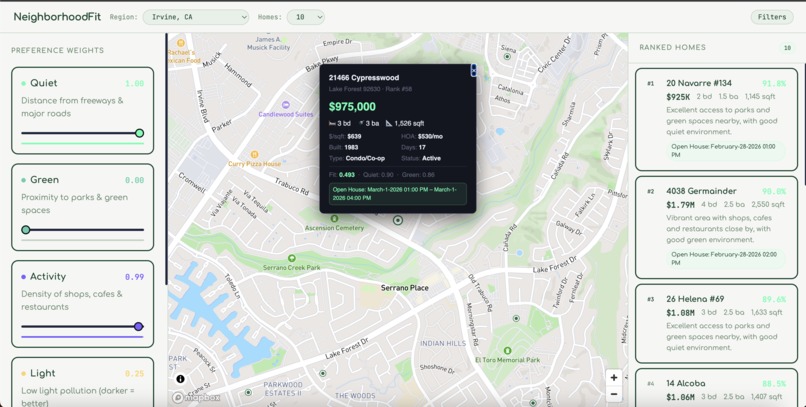
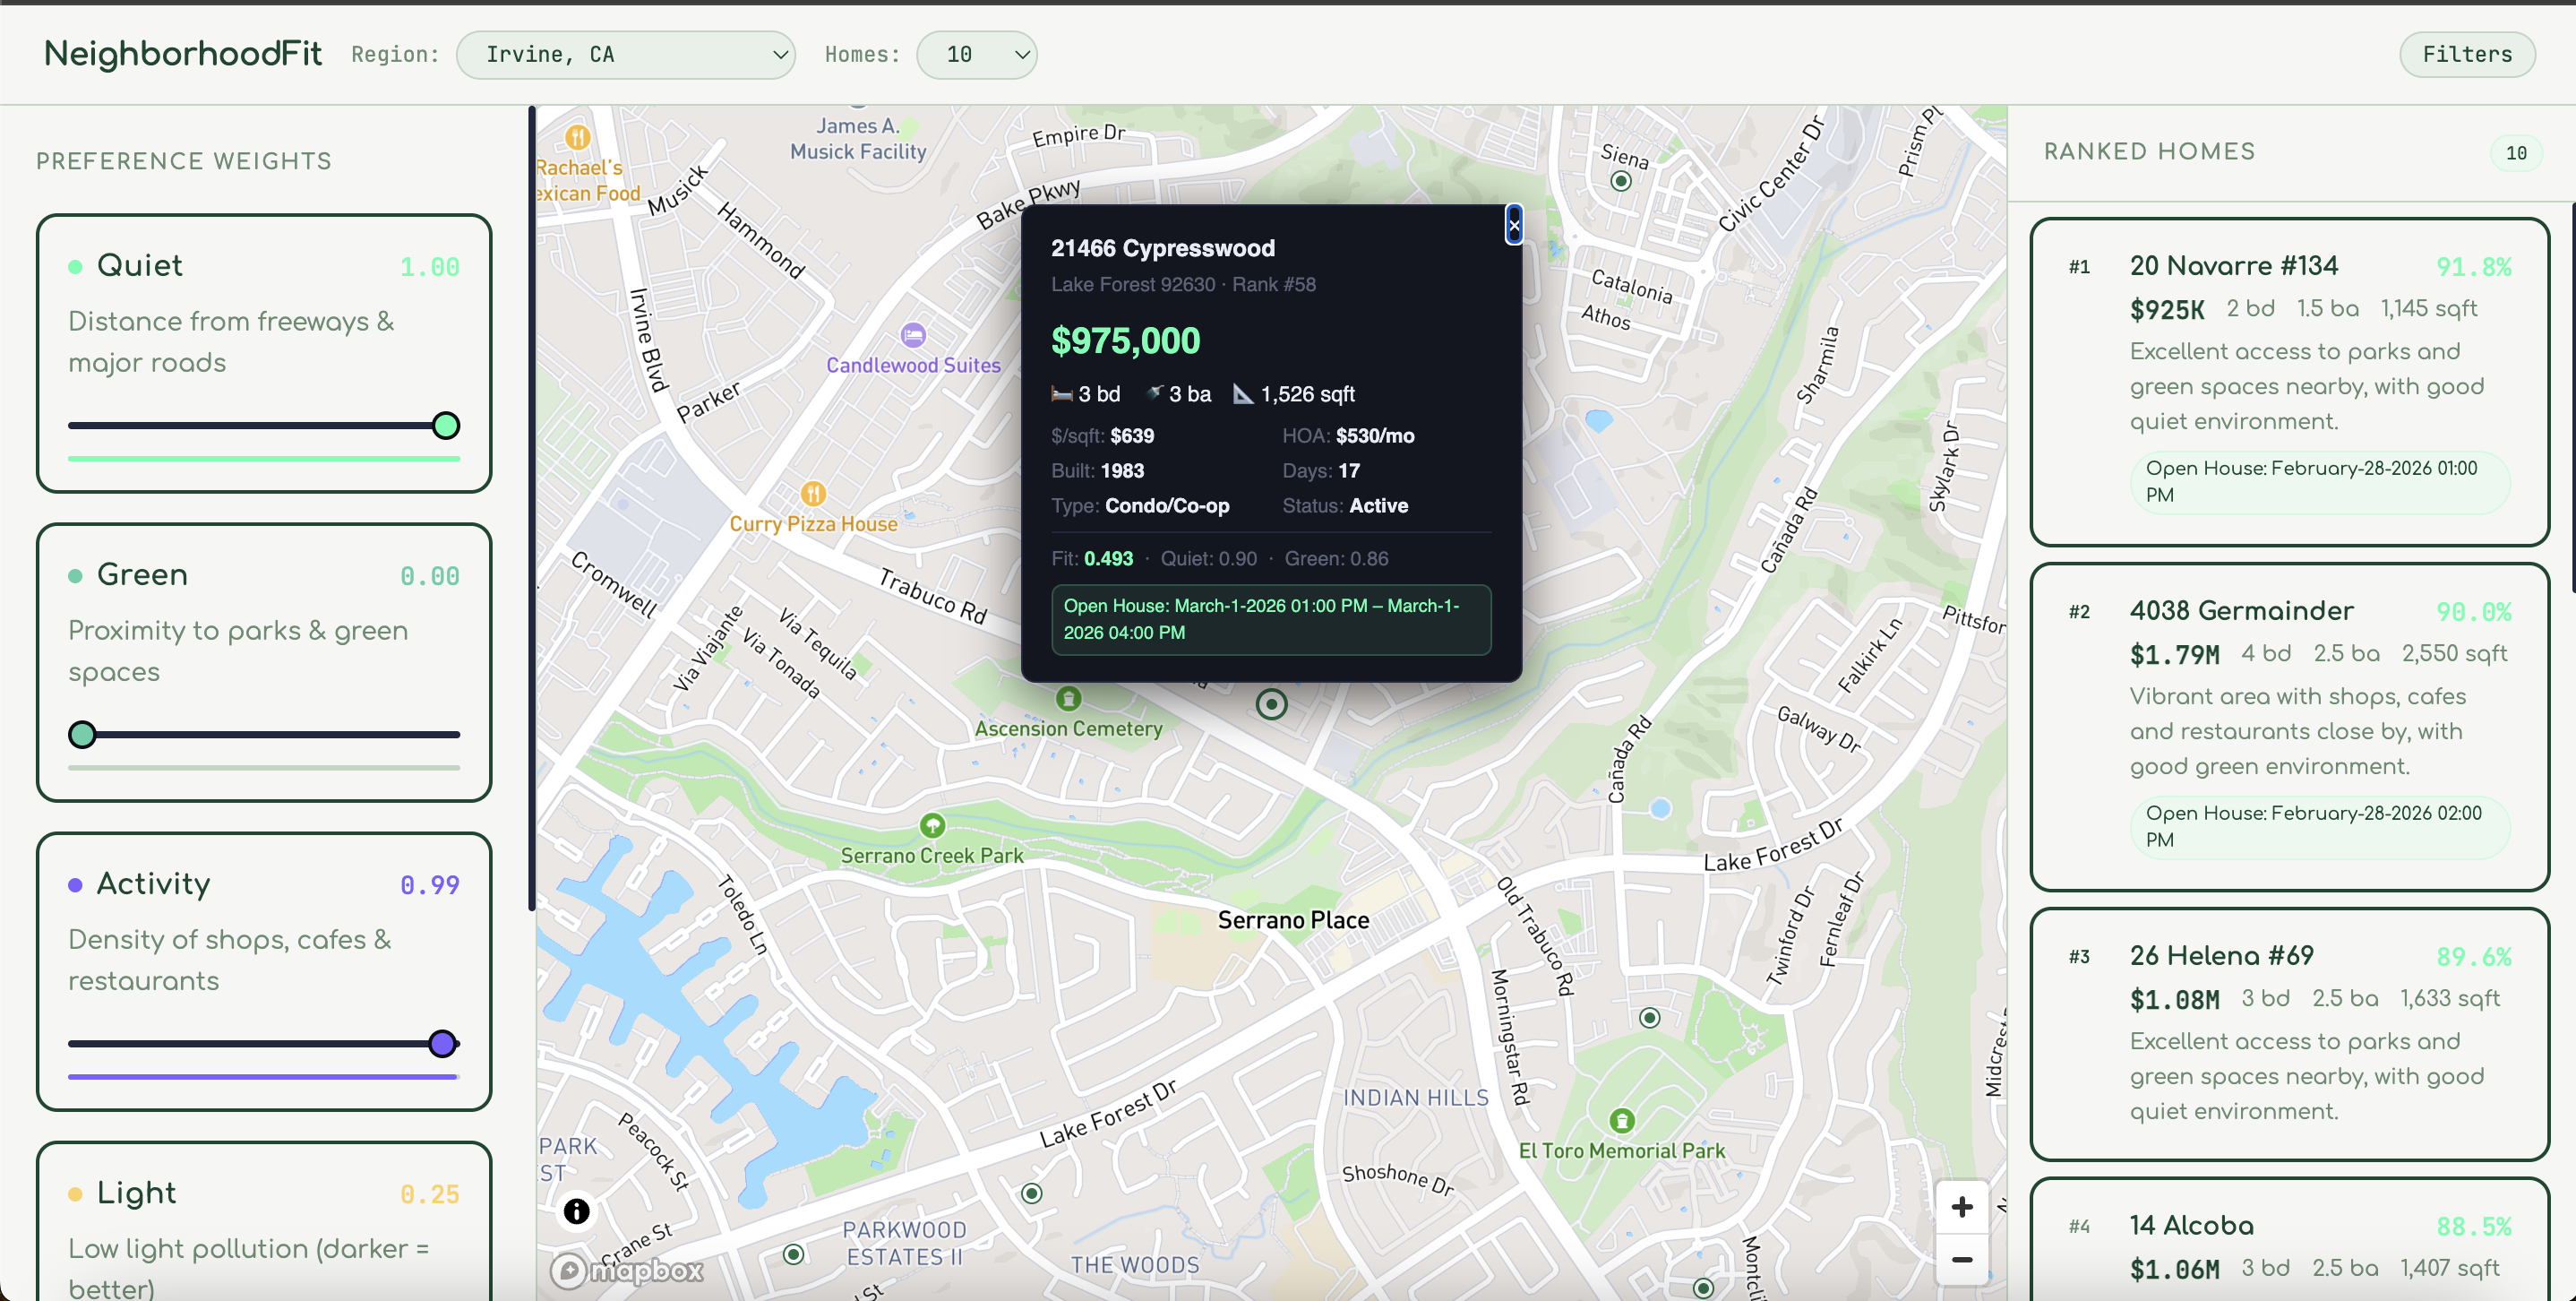
Click any listing to view detailed home information, pricing, and neighborhood metrics.
Project Story
About the Project
NeighborhoodFit was inspired by a simple question: why is it so hard to understand what a neighborhood actually feels like before moving there?
Most home search platforms focus heavily on price, square footage, and number of bedrooms. While those are important, they don’t capture the everyday experience of living in a community. Access to parks, lighting conditions, road density, nearby amenities, and zoning patterns all shape quality of life—but this information is rarely presented in one place.
We wanted to build a tool that evaluates neighborhoods holistically rather than just evaluating houses.
How We Built It
We combined housing data with geospatial infrastructure layers to create an interactive and data-driven experience.
Our stack includes:
Frontend
- React (Vite) for the frontend interface
- Tailwind CSS for styling
- JavaScript (ES6+) for application logic
- Mapbox GL JS for interactive maps
- GeoJSON rendering for spatial visualization
Backend
- Python for backend logic
- FastAPI for API endpoints
- SQLite for database storage
- Data processing scripts for feature computation
- GeoJSON spatial layers for geographic data handling
We processed raw housing data and city-level GeoJSON files into structured spatial layers. These layers include parks, roads, industrial zones, lighting data, and other points of interest.
From there, we integrated everything into an interactive map interface where users can visually explore and compare neighborhoods.
Conceptually, we thought of NeighborhoodFit as a weighted scoring system:
Neighborhood Fit Score = w_1(Parks) + w_2(Amenities) + w_3(Infrastructure) - w_4(Industrial Density)
Although our current implementation focuses on visualization, this formula represents the foundation for future personalization and scoring features.
What We Learned
Throughout this project, we learned:
- How to process and clean real-world housing datasets
- How to work with GeoJSON and spatial data layers
- How to connect backend data pipelines to a React frontend
- How deployment differs between frontend (Vercel) and backend (Render) environments
- The importance of modular architecture when working under hackathon time constraints
We also gained experience balancing performance and usability when rendering large spatial datasets in the browser.
Challenges We Faced
One of our biggest challenges was managing and preprocessing spatial data. GeoJSON files can be large and complex, and rendering too much data at once can significantly impact frontend performance.
Another challenge was coordinating the backend data pipeline with frontend visualization. Ensuring consistent schemas between SQLite tables and frontend API responses required careful planning.
Deployment was also non-trivial. Separating the frontend (Vercel) and backend (Render) required proper environment configuration, API routing, and CORS handling.
Looking Ahead
NeighborhoodFit lays the foundation for a more intelligent home search experience. In the future, we aim to:
- Introduce personalized weighting for neighborhood features
- Implement a dynamic “Fit Score” system
- Expand data sources beyond Orange County
- Transition to a scalable cloud database
Ultimately, our goal is to help people choose neighborhoods that align with their lifestyle, priorities, and long-term vision—not just their budget.

Log in or sign up for Devpost to join the conversation.