Inspiration
We entered HackEPS 2025 with a clear goal: tackle the Restb.ai challenge to create a functional prototype that doesn't just show data, but justifies it.
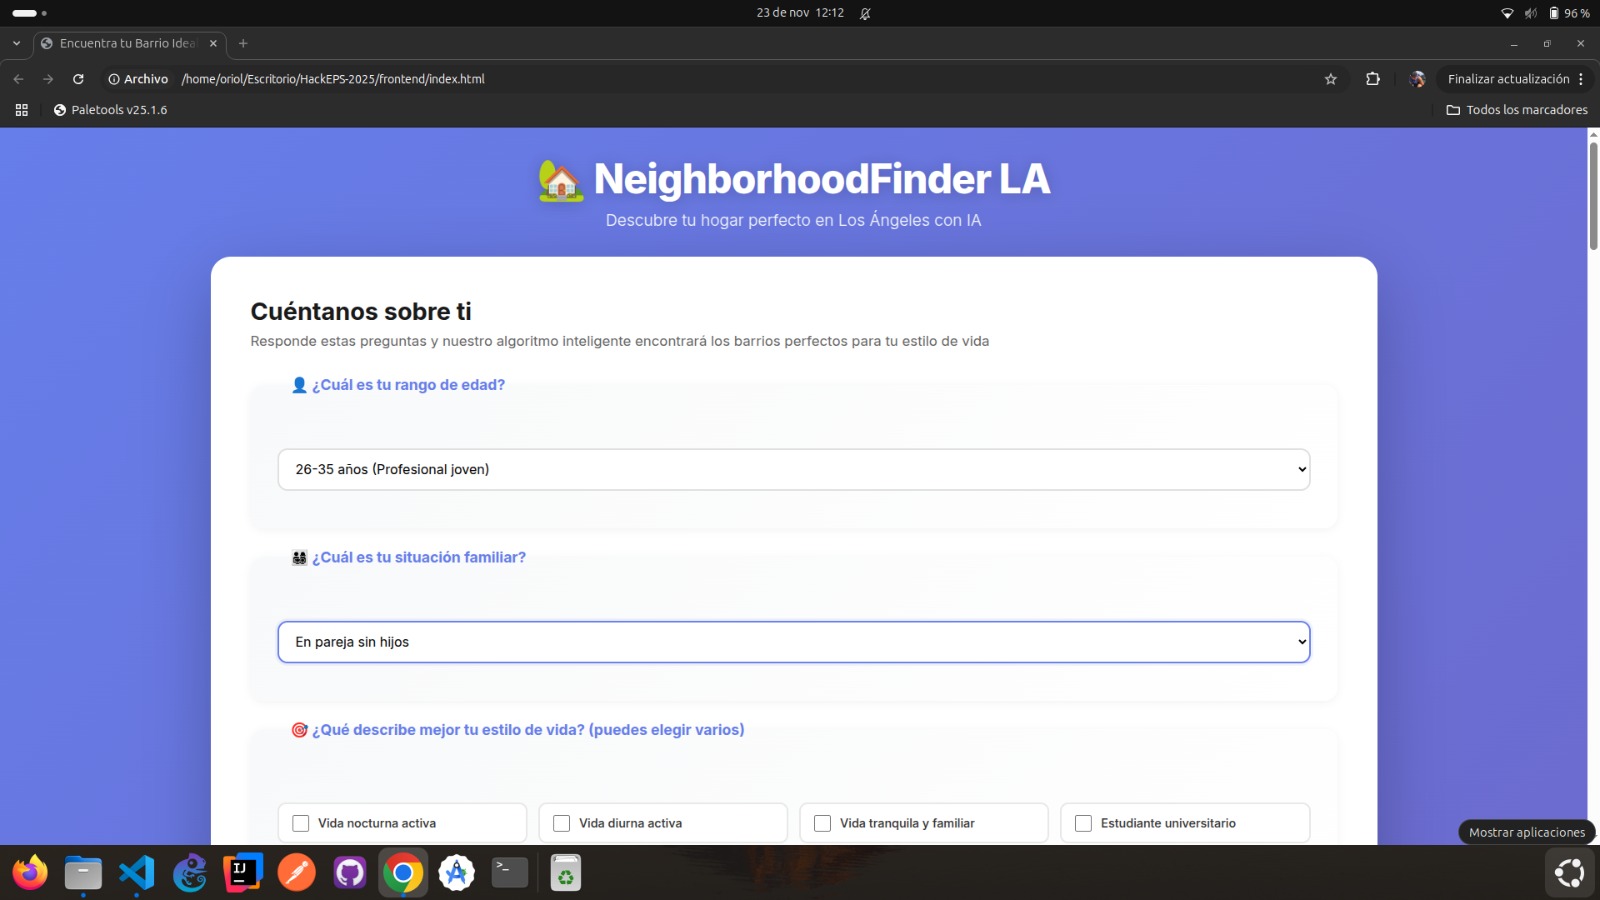
Moving to a city as vast as Los Angeles is overwhelming. With over 100 neighborhoods, how do you choose? Existing maps show you where things are, but they don't tell you if a place fits your specific life stage.
The Problem: "Analysis Paralysis." A young student needs cheap rent and nightlife, while a family needs safety and schools. A generic map fails both.
The Challenge: Build a "Justification Engine" that personalizes public data to explain why a specific zone is the perfect match for a specific user.
What it does
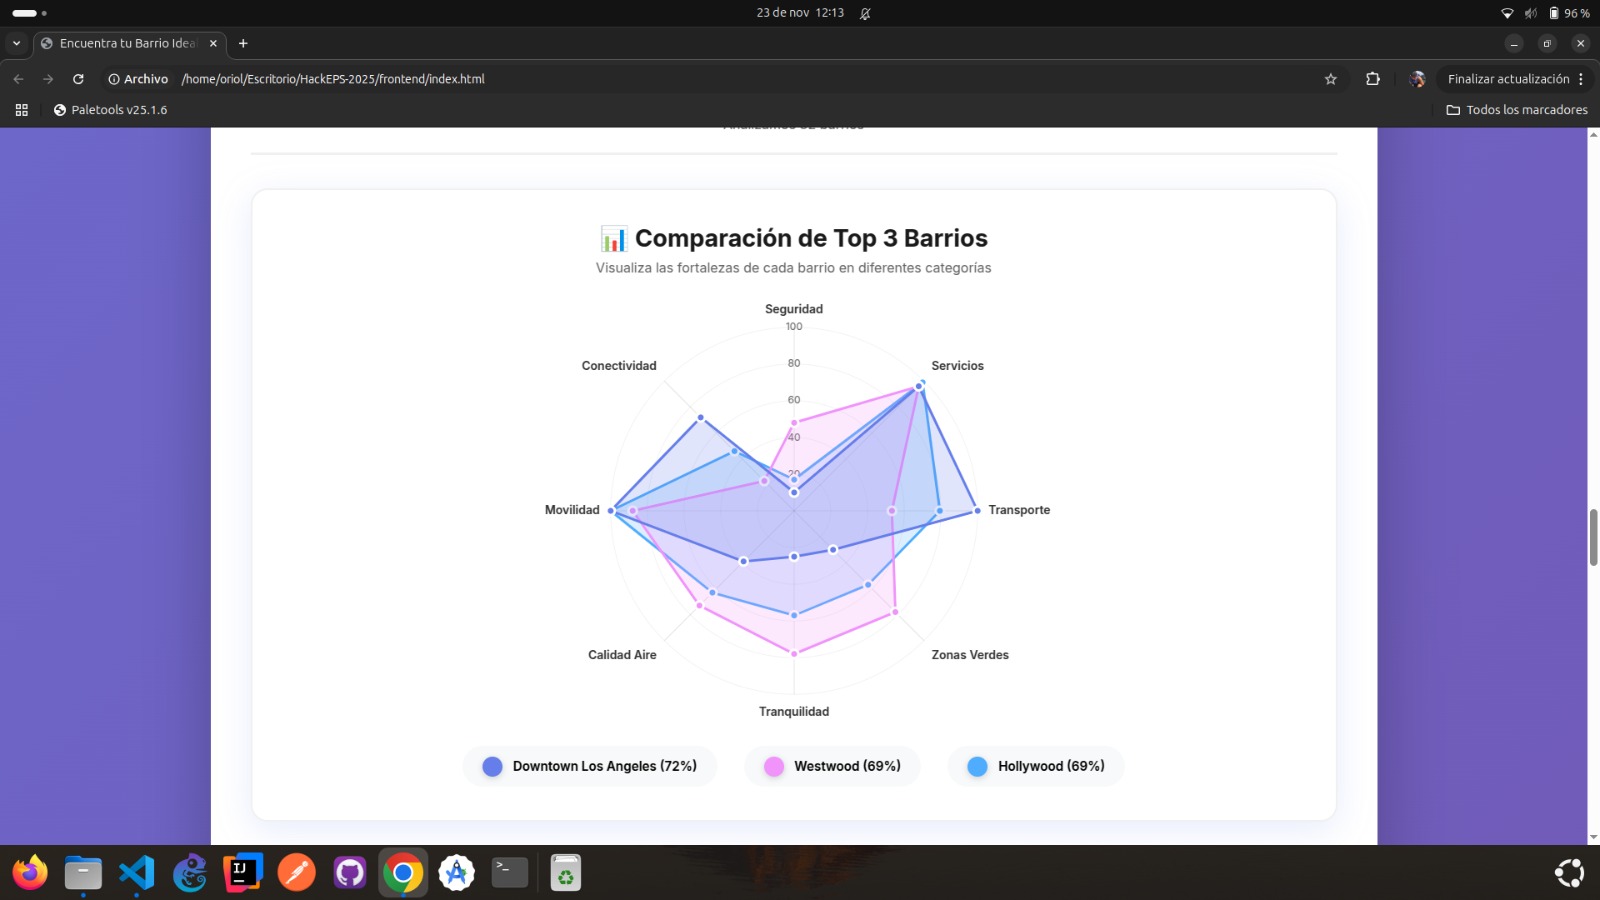
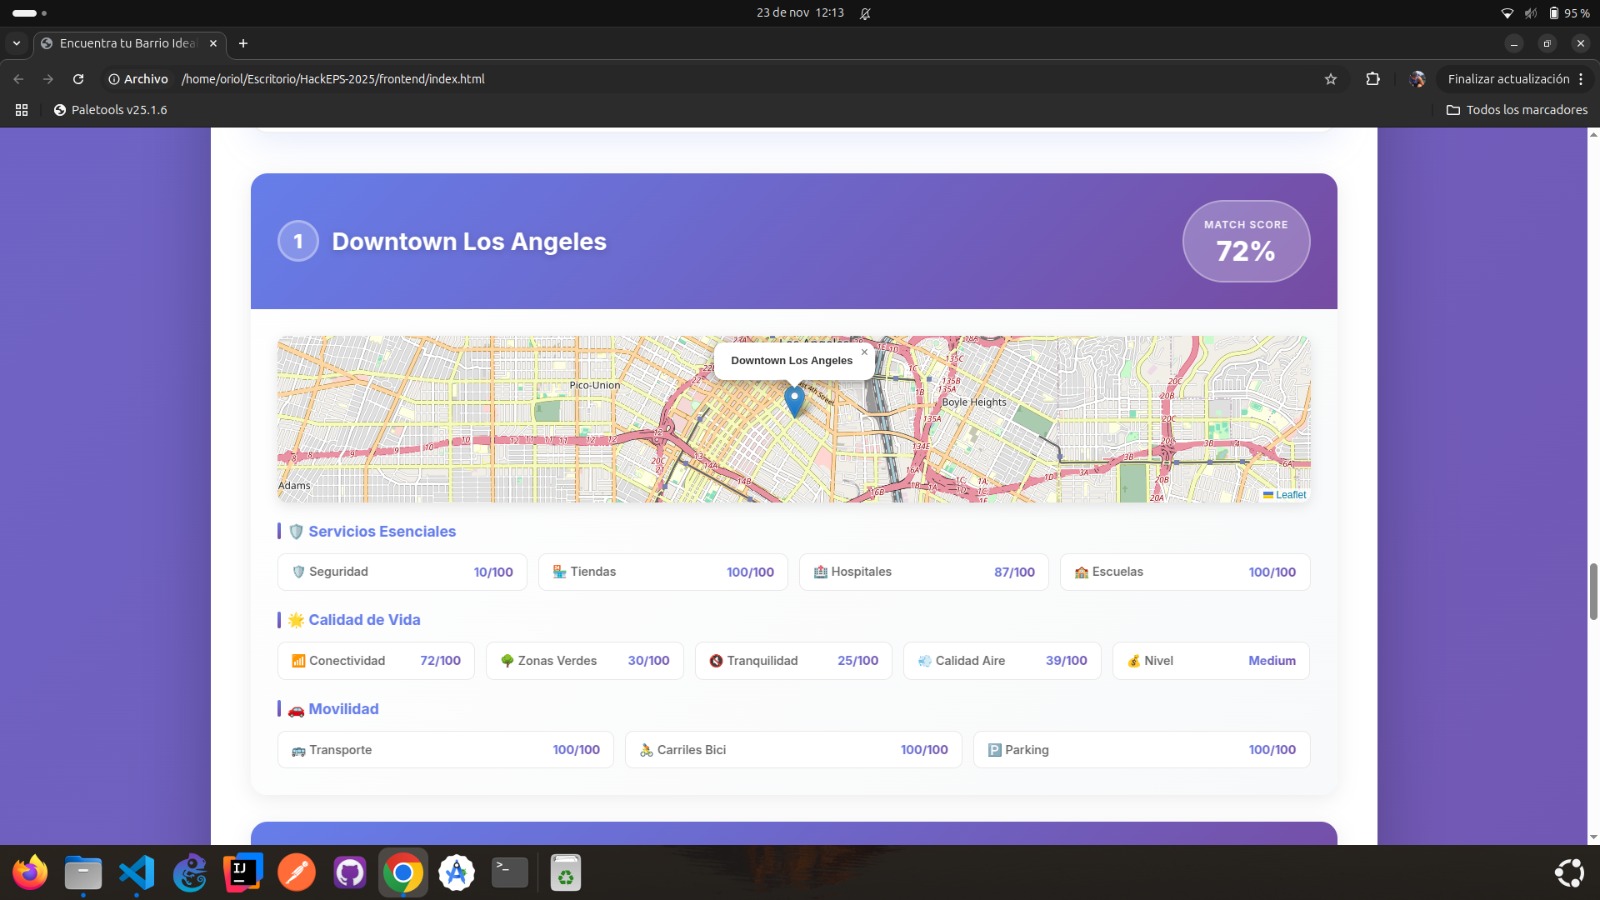
NeighborhoodFinder LA is an intelligent matchmaking system for cities. It converts subjective user preferences into objective, mathematical neighborhood scores.
How we built it
We architected a solution that separates the "Data Layer" from the "Logic Layer" to ensure 100% data-driven objectivity.
Tech Stack
Frontend: HTML5, JavaScript, and Leaflet.js for geospatial visualization.
Backend: Node.js with NestJS framework for a robust, scalable architecture.
Language: TypeScript (Strict typing was essential for handling complex scoring interfaces).
Database: SQLite with TypeORM for efficient data management during the hackathon.
Data Pipeline & APIs
We integrated massive datasets from three key public sources:
LA Open Data Portal: Real-time data for Crime (LAPD), Traffic Collisions, and Business permits.
Overpass API (OpenStreetMap): To dynamically count amenities like bus stops, bike lanes, cafes, and bars within a 2km radius of each zone.
US Census Bureau: For demographic baselines.
The "Secret Sauce": The Scoring Algorithm
This is the core of our innovation. We didn't hardcode "good neighborhoods." We built a mathematical model:
Dynamic Weighting: If a user selects "Safety is Critical," the algorithm boosts the weight of the Crime Metric by +60 points. If they are a student, it boosts University proximity by +90 points.
Normalization: We normalized disparate data (e.g., crime counts vs. distance to the beach) into a uniform 0-100 scale using percentile distribution, ensuring fair comparisons.
Penalties: We implemented "Aggressive Penalties." For example, if a user demands nature but a neighborhood has high noise levels, the score is heavily penalized, preventing bad matches.
Challenges we ran into
We faced challenges such as time management, integrating various technologies, and the need to devise innovative solutions within a limited period.
Data Heterogeneity: The biggest headache was harmonizing data formats. Some APIs returned GeoJSON polygons, while others returned raw Latitude/Longitude points. We had to build a spatial query system to determine if a specific crime point fell within a neighborhood's boundary.
The "Zero" Problem: How do you score a neighborhood with zero crimes vs. one with missing data? We had to implement strict validation to distinguish between safe zones and empty datasets.
Time Management: integrating 21 different metrics in 24 hours was exhausted. We had to prioritize the most impactful data (Safety & Mobility) first.
Accomplishments that we're proud of
We successfully developed a functional and creative solution in a short amount of time, learning new skills and improving our teamwork.
The Math Works: We successfully built a non-biased algorithm. The recommendations feel genuinely "smart" because they are based on real-time stats, not opinions.
Data Volume: We are processing over 50,000 crime records and thousands of POIs (Points of Interest) in real-time.
The "Justification" Feature: We met the sponsor's requirement. The app doesn't just guess; it mathematically proves why a neighborhood is the right choice.
What we learned
Geospatial Engineering: We gained deep experience using OpenStreetMap/Overpass, understanding the complexity of querying spatial data (nodes vs. ways vs. relations).
Algorithmic Design: We learned how to translate human feelings ("I want a quiet life") into computer logic (Noise_Score < 30 && GreenZones > 70).
NestJS Power: Using a structured framework like NestJS allowed our team to work in parallel on different "Services" (SecurityService, MobilityService) without breaking each other's code.
Built With
- javascript
- leaflet.js
- nestjs
- node.js
- opendata
- openstreetmap
- sqlite
- typescript


Log in or sign up for Devpost to join the conversation.