-
-
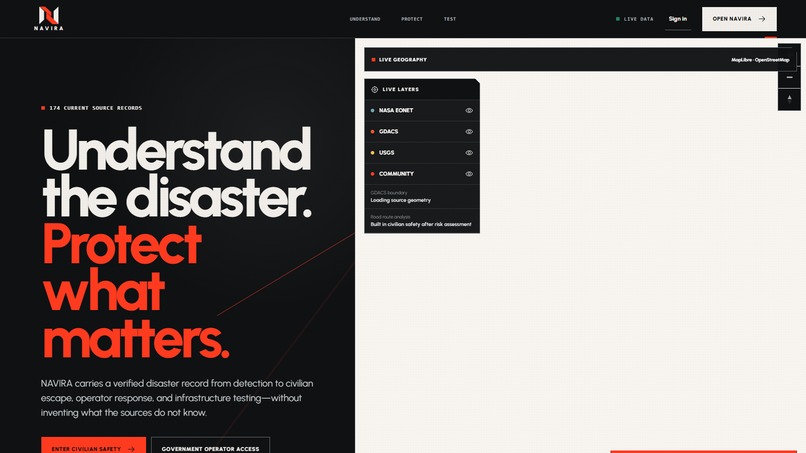
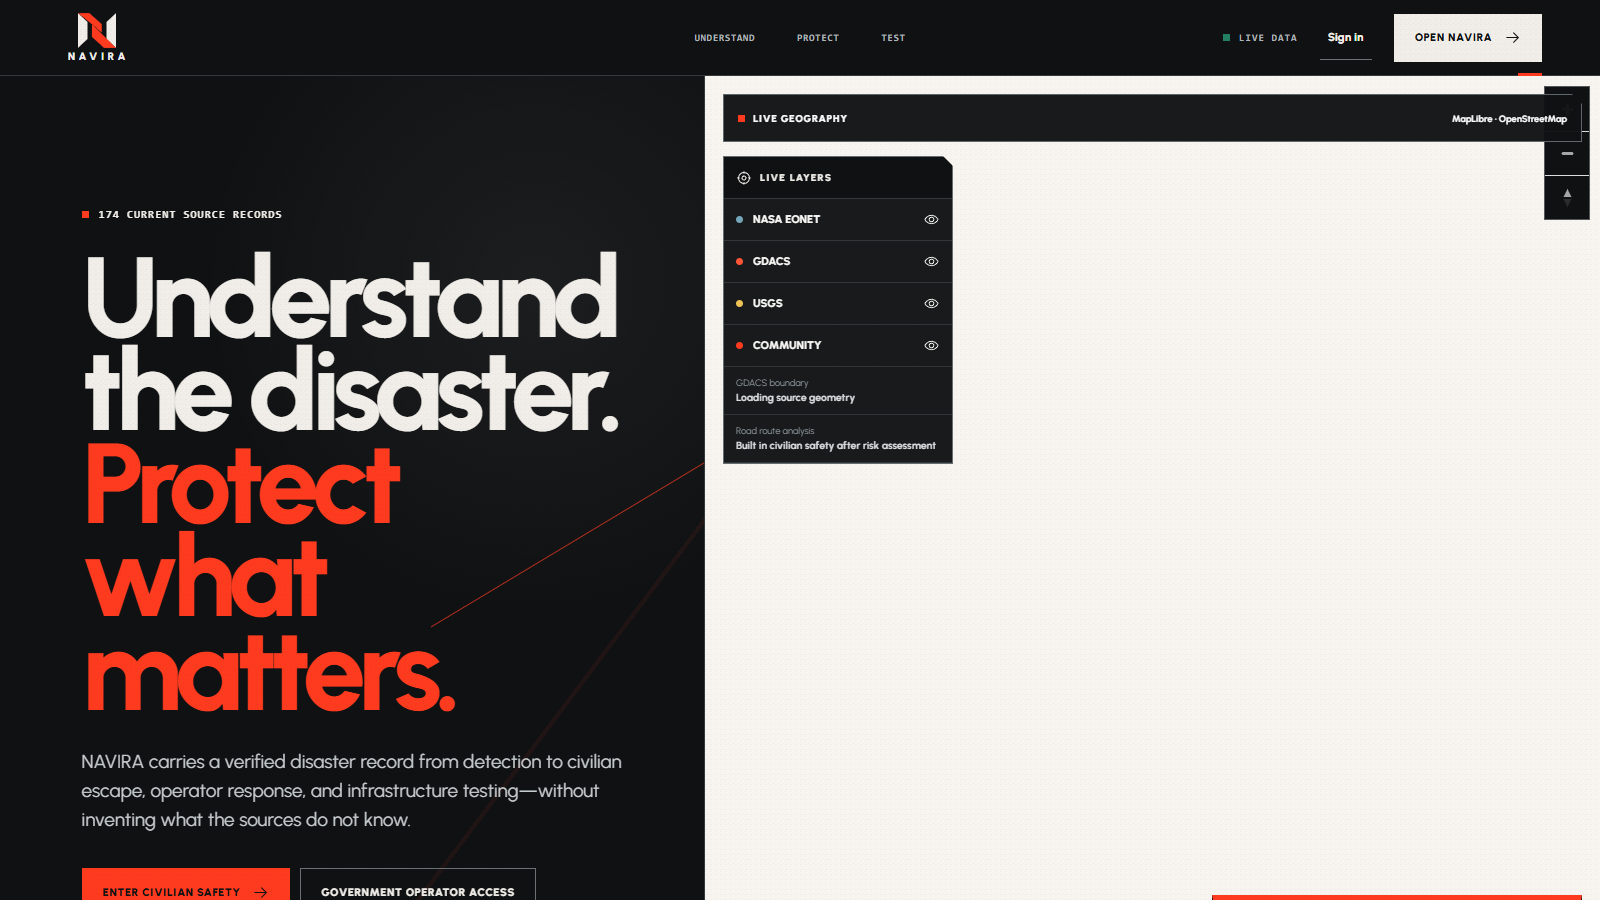
Landing Page
-
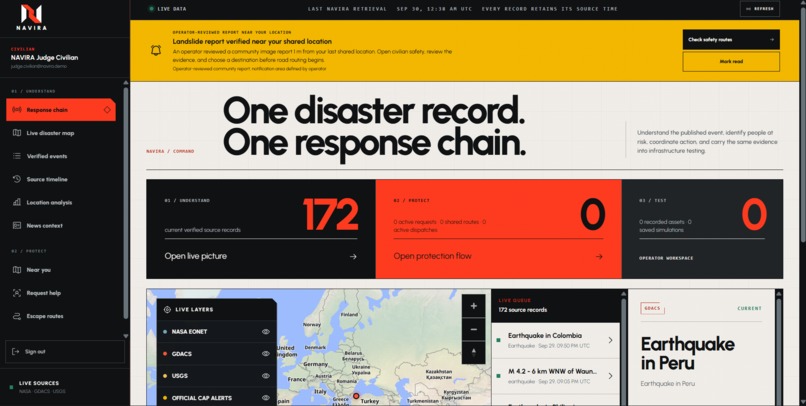
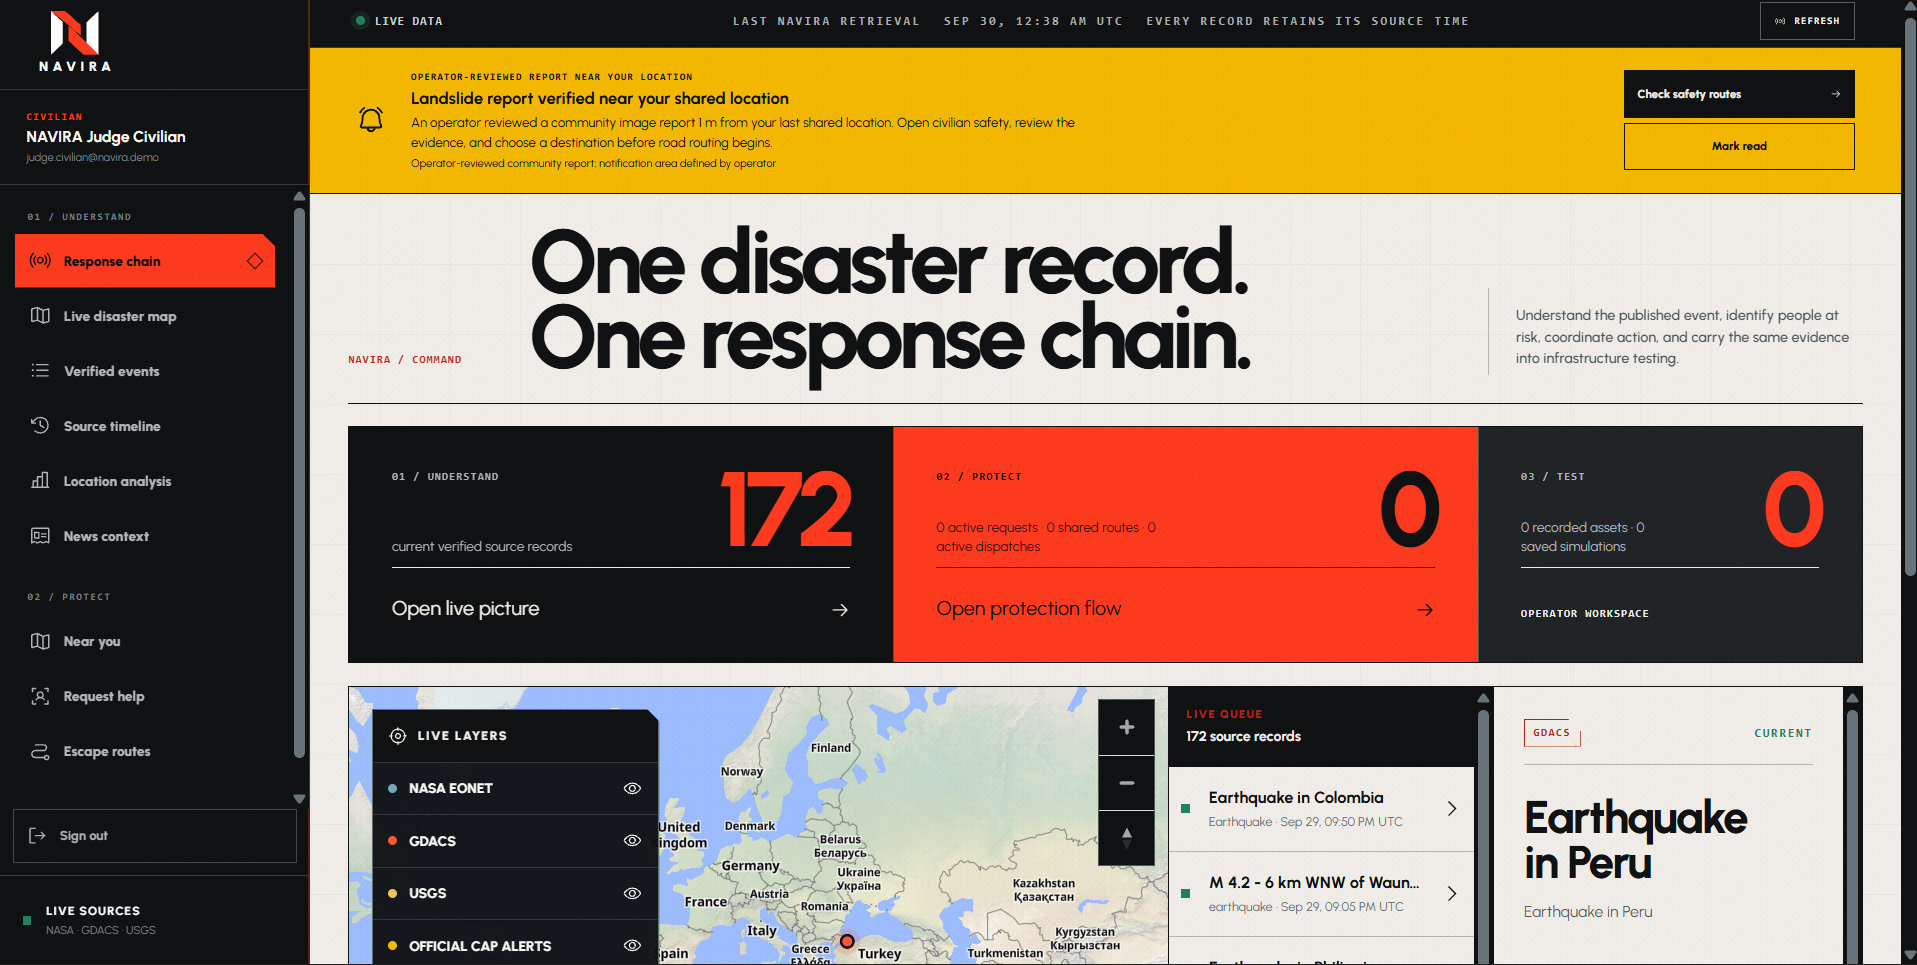
Live Notification if civilian is near disaster
-
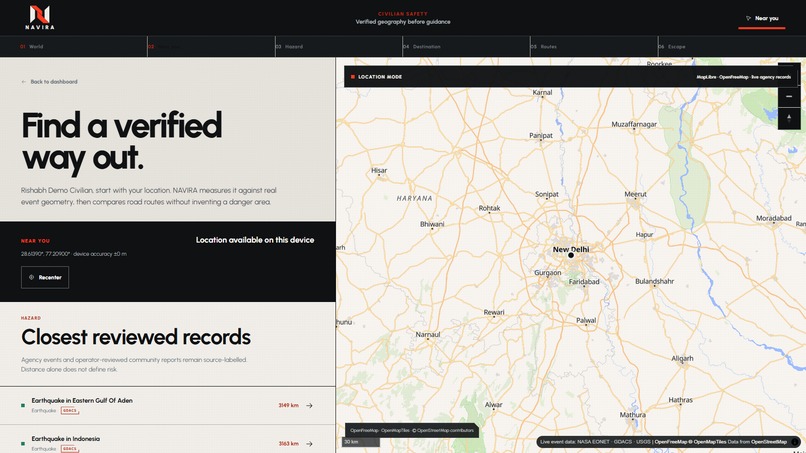
Civilian Safety
-
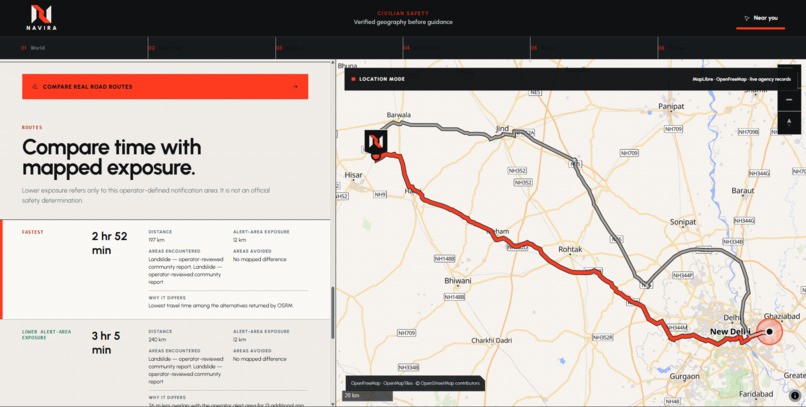
Safety Route, finds fastest and safest both
-
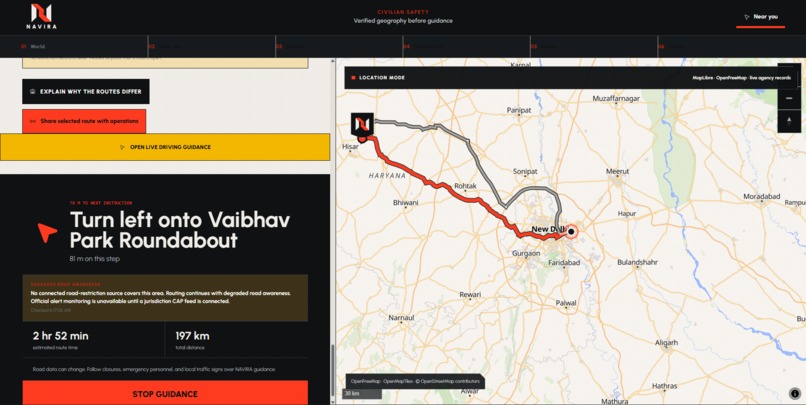
Live Navigation
-
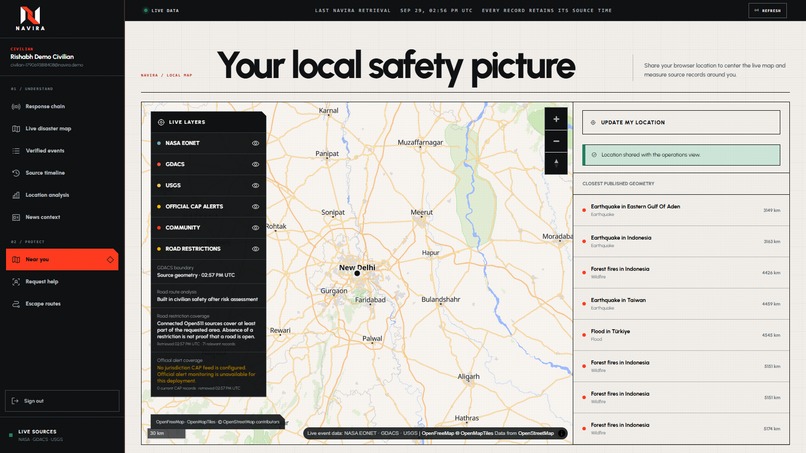
Near You
-
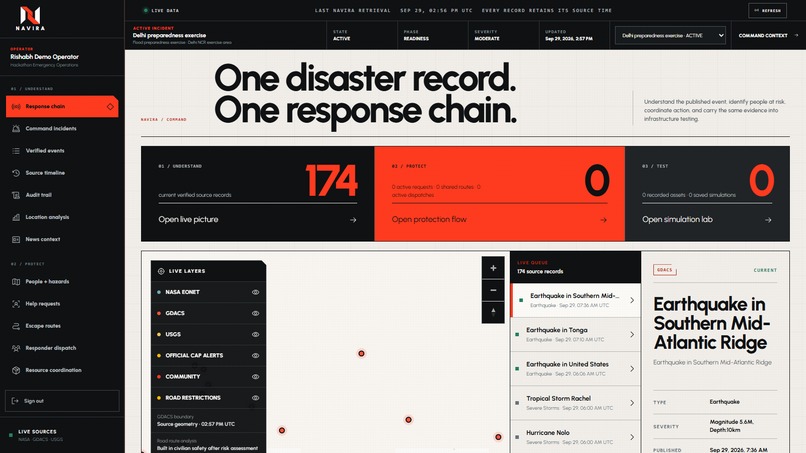
Operator Command
-
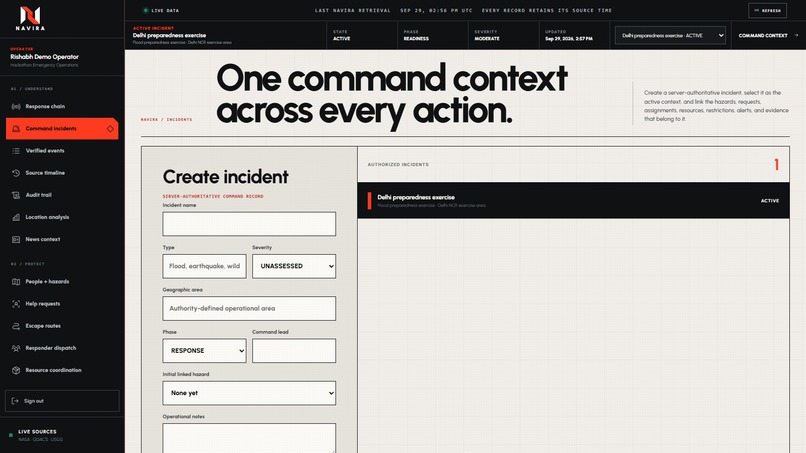
Incidents
-
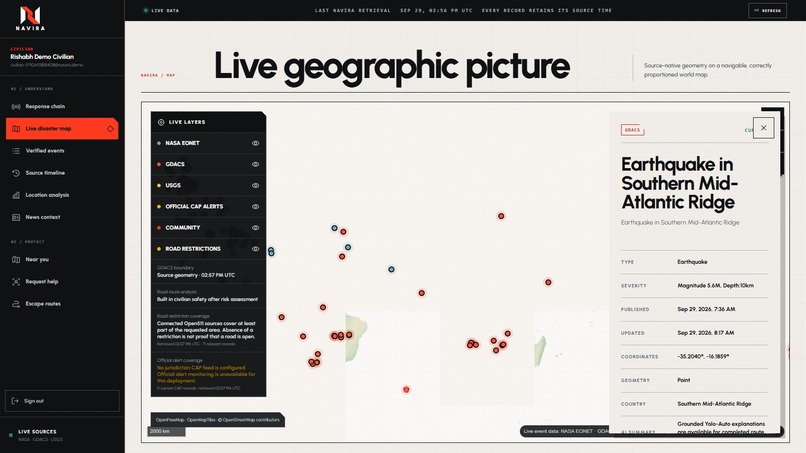
Live Map
-
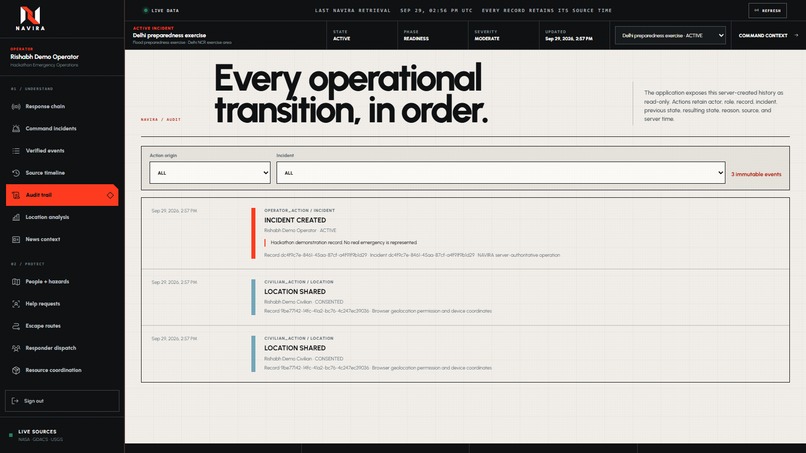
Audit
-
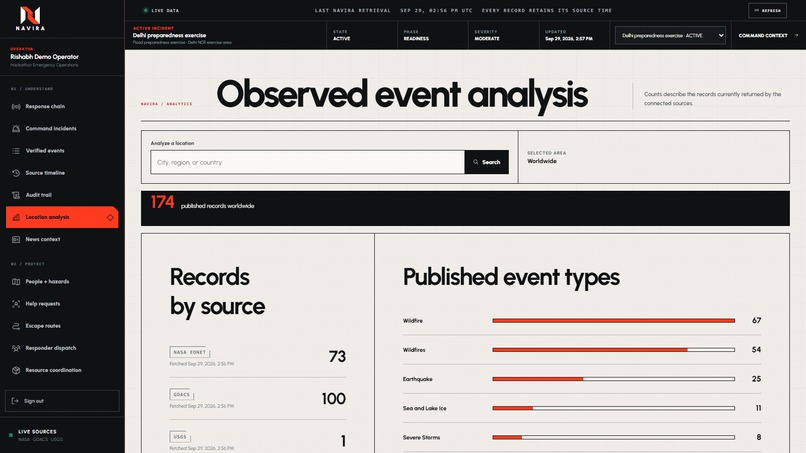
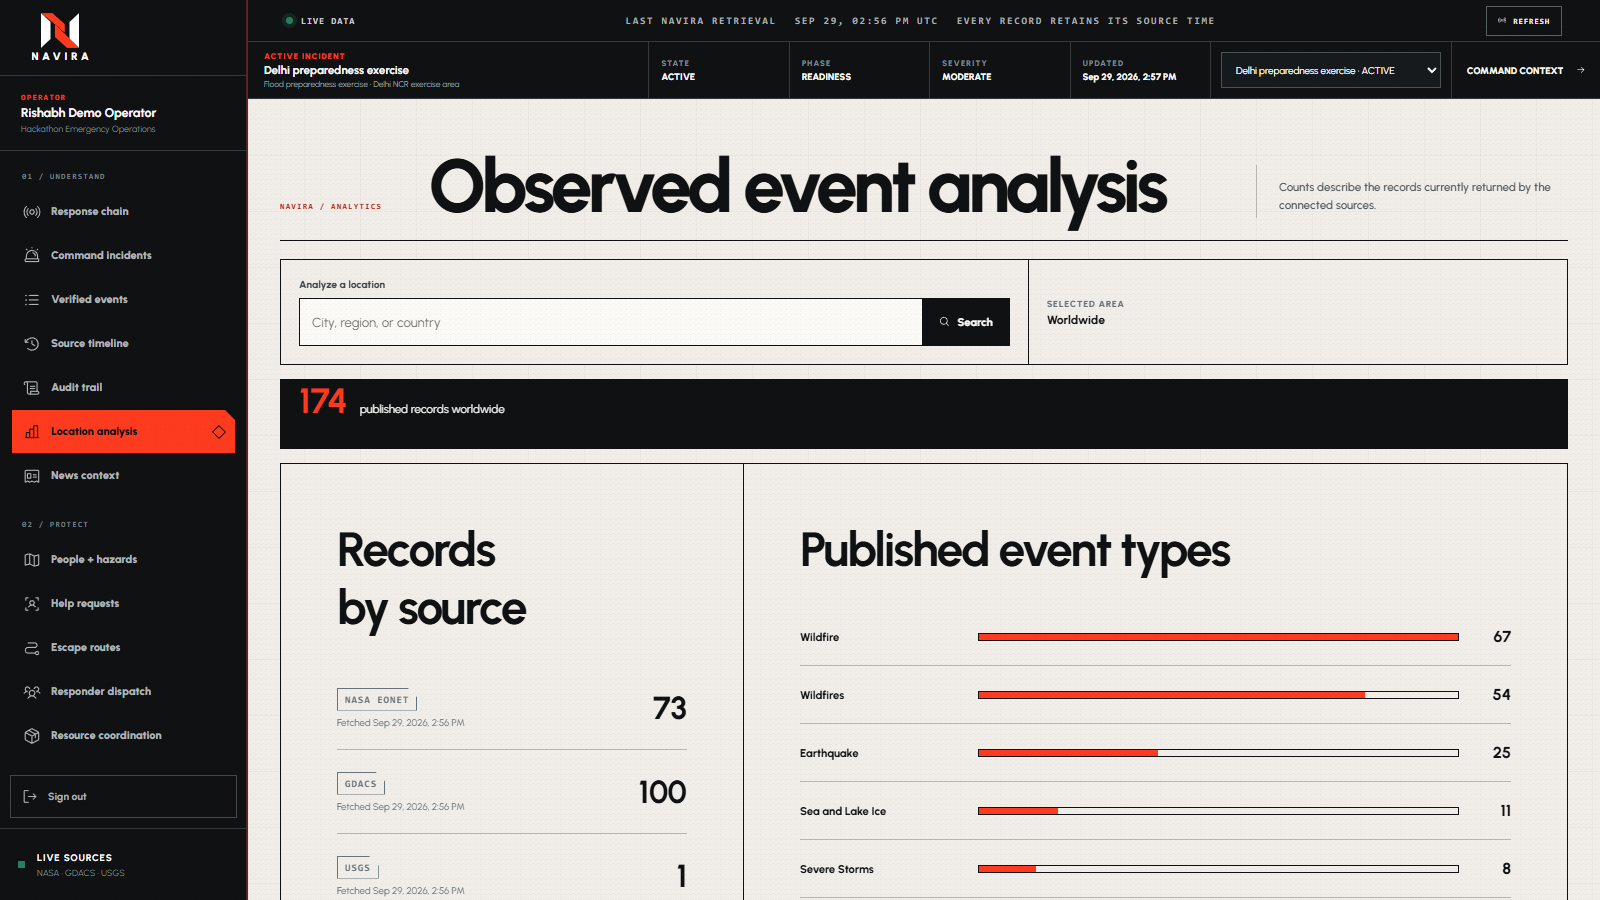
Analytics
-
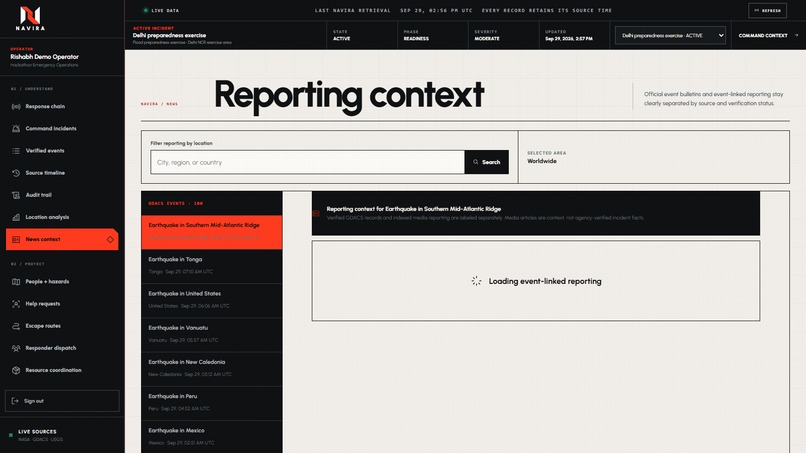
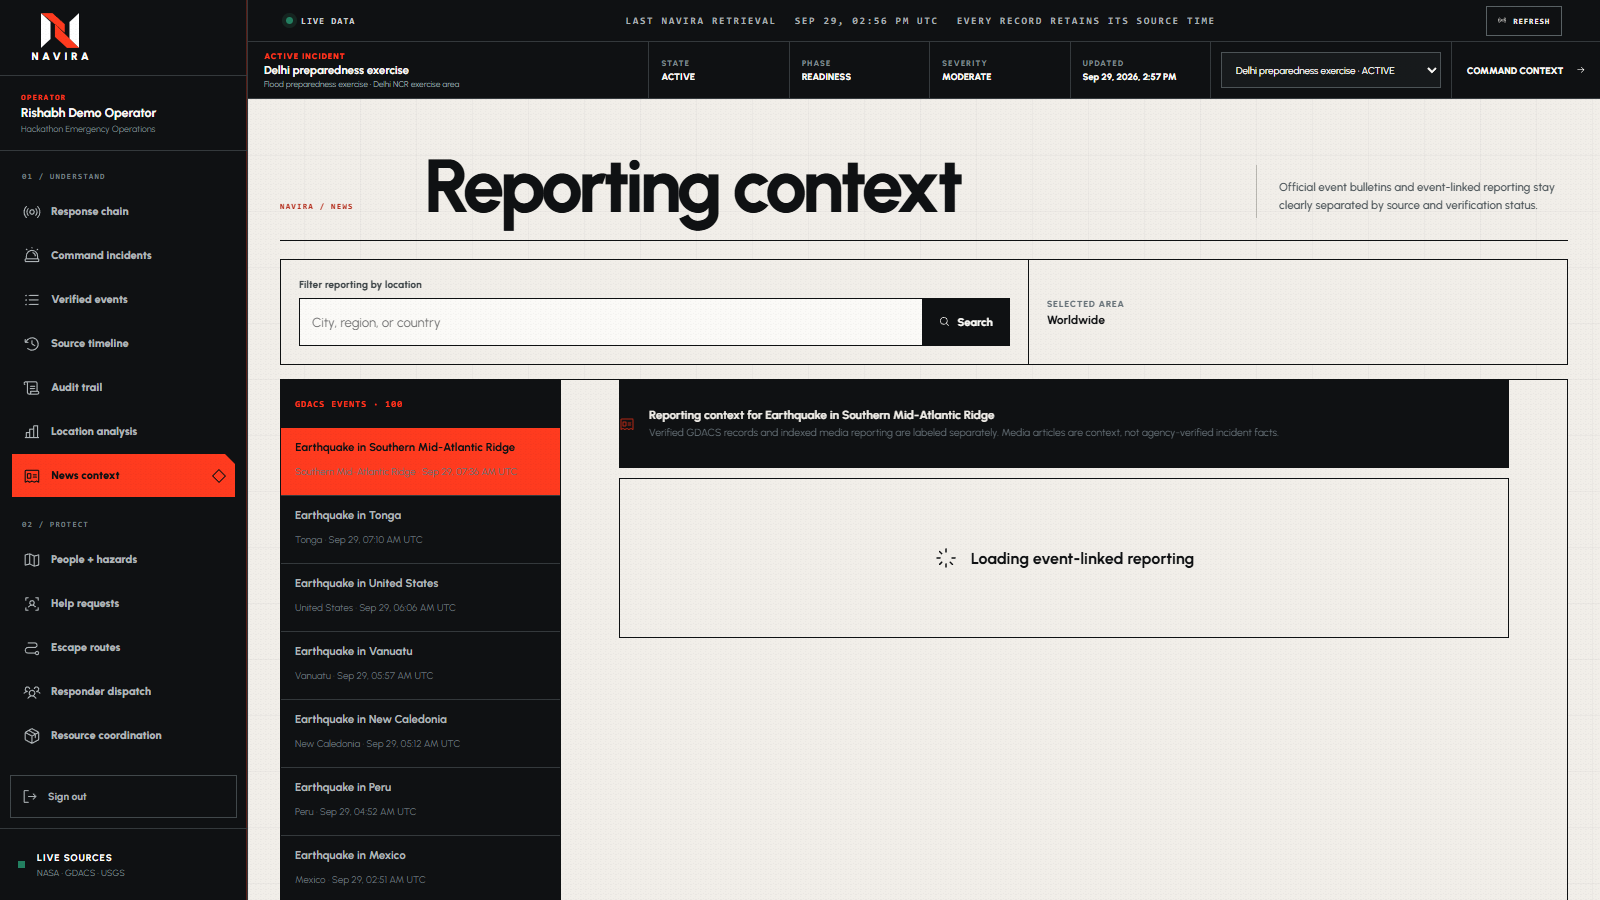
News
-
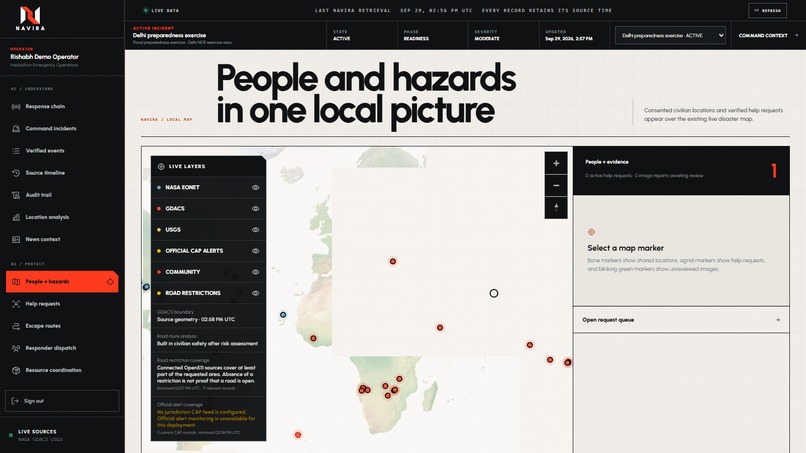
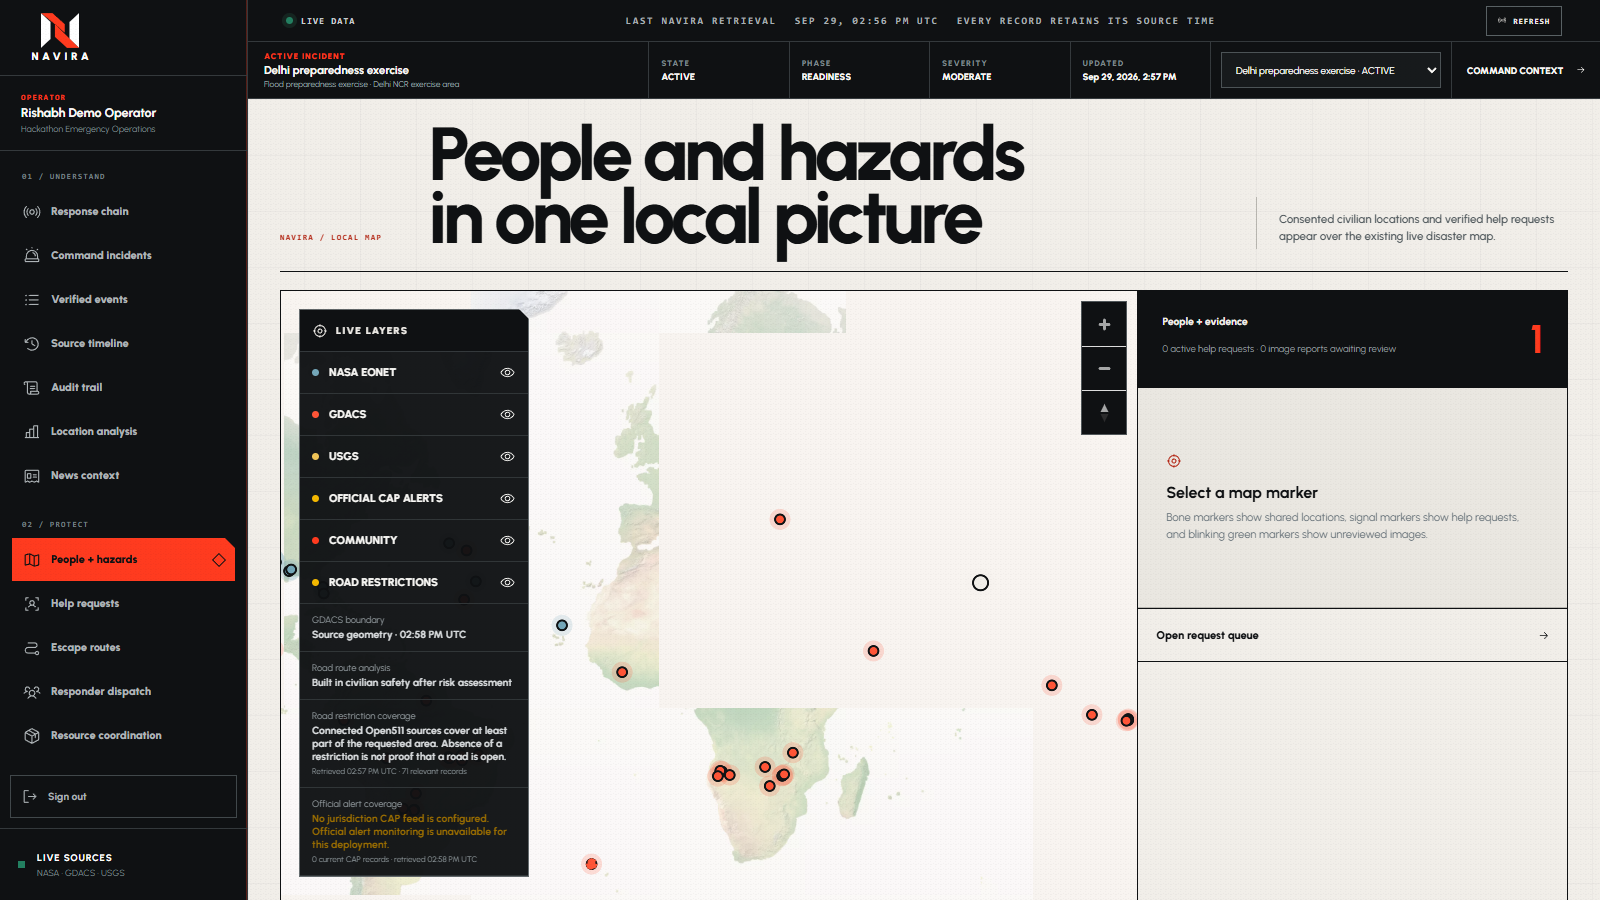
People in Hazard/Danger
-
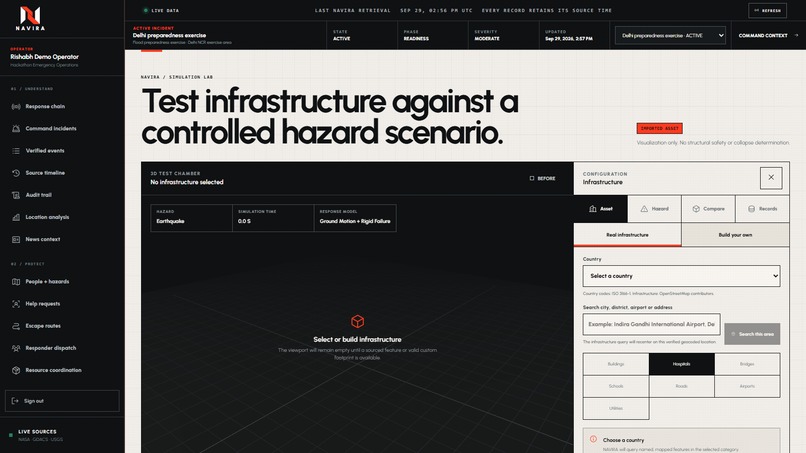
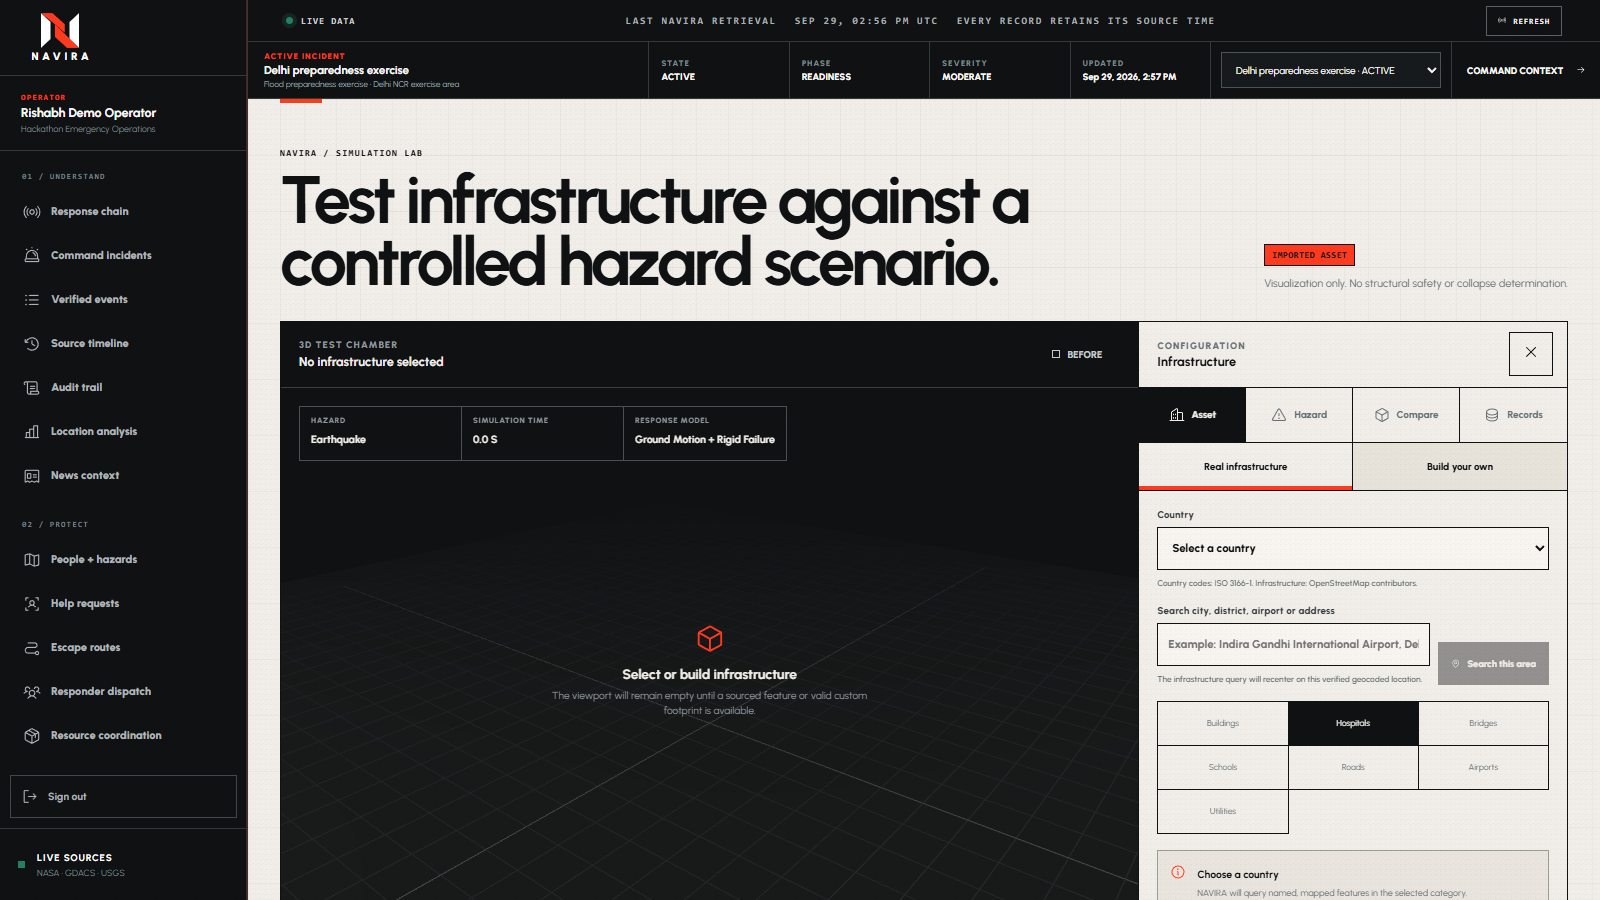
Simulation
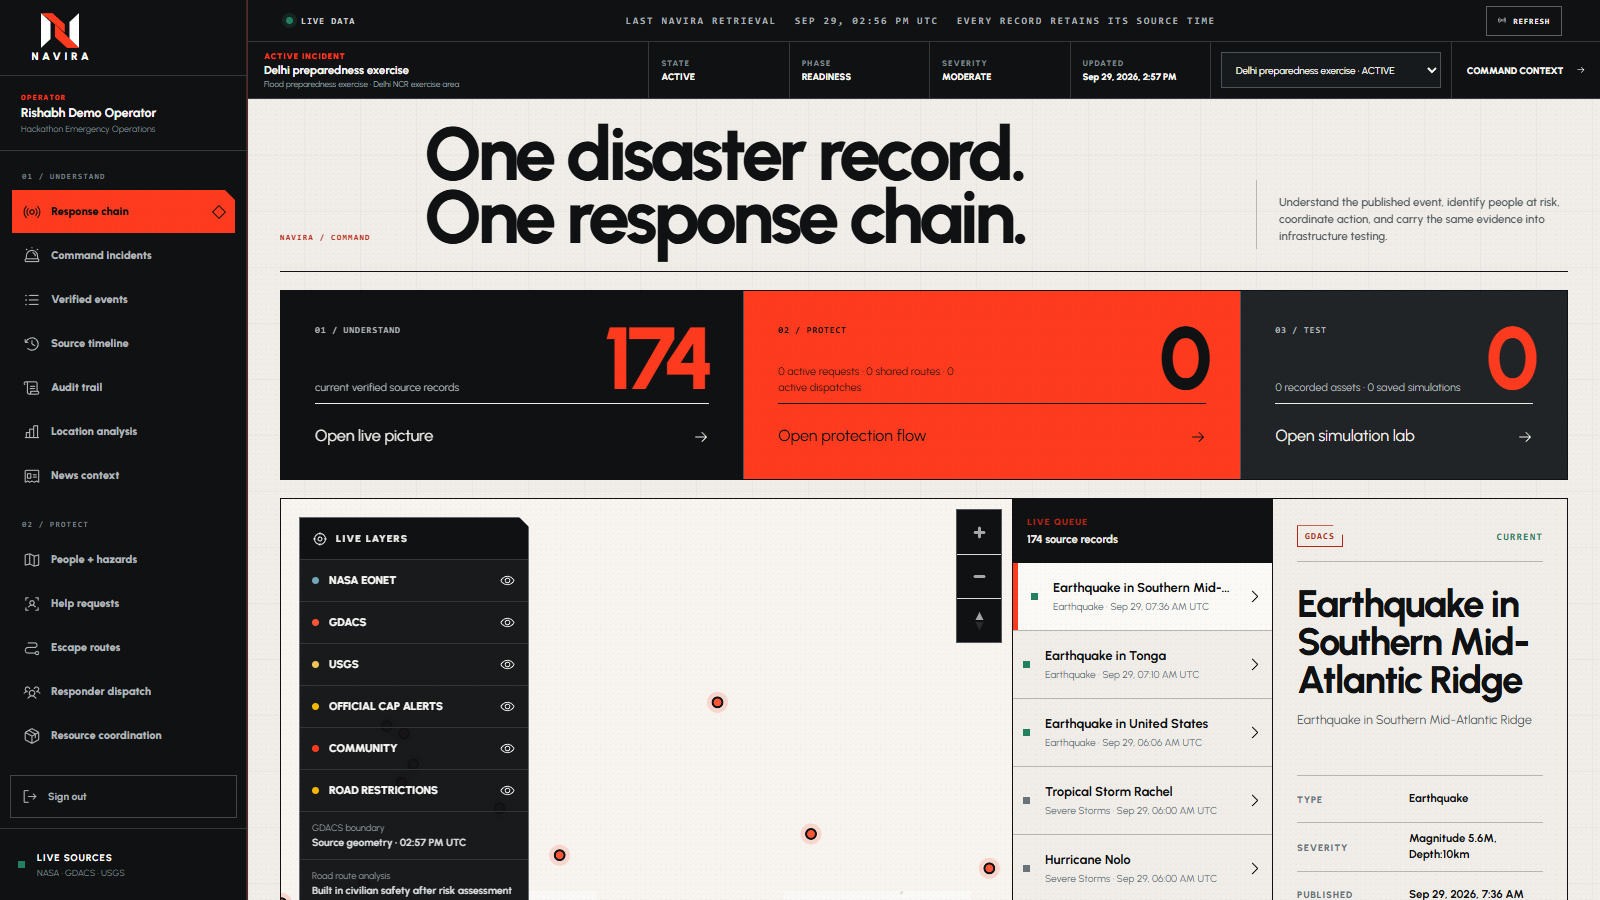
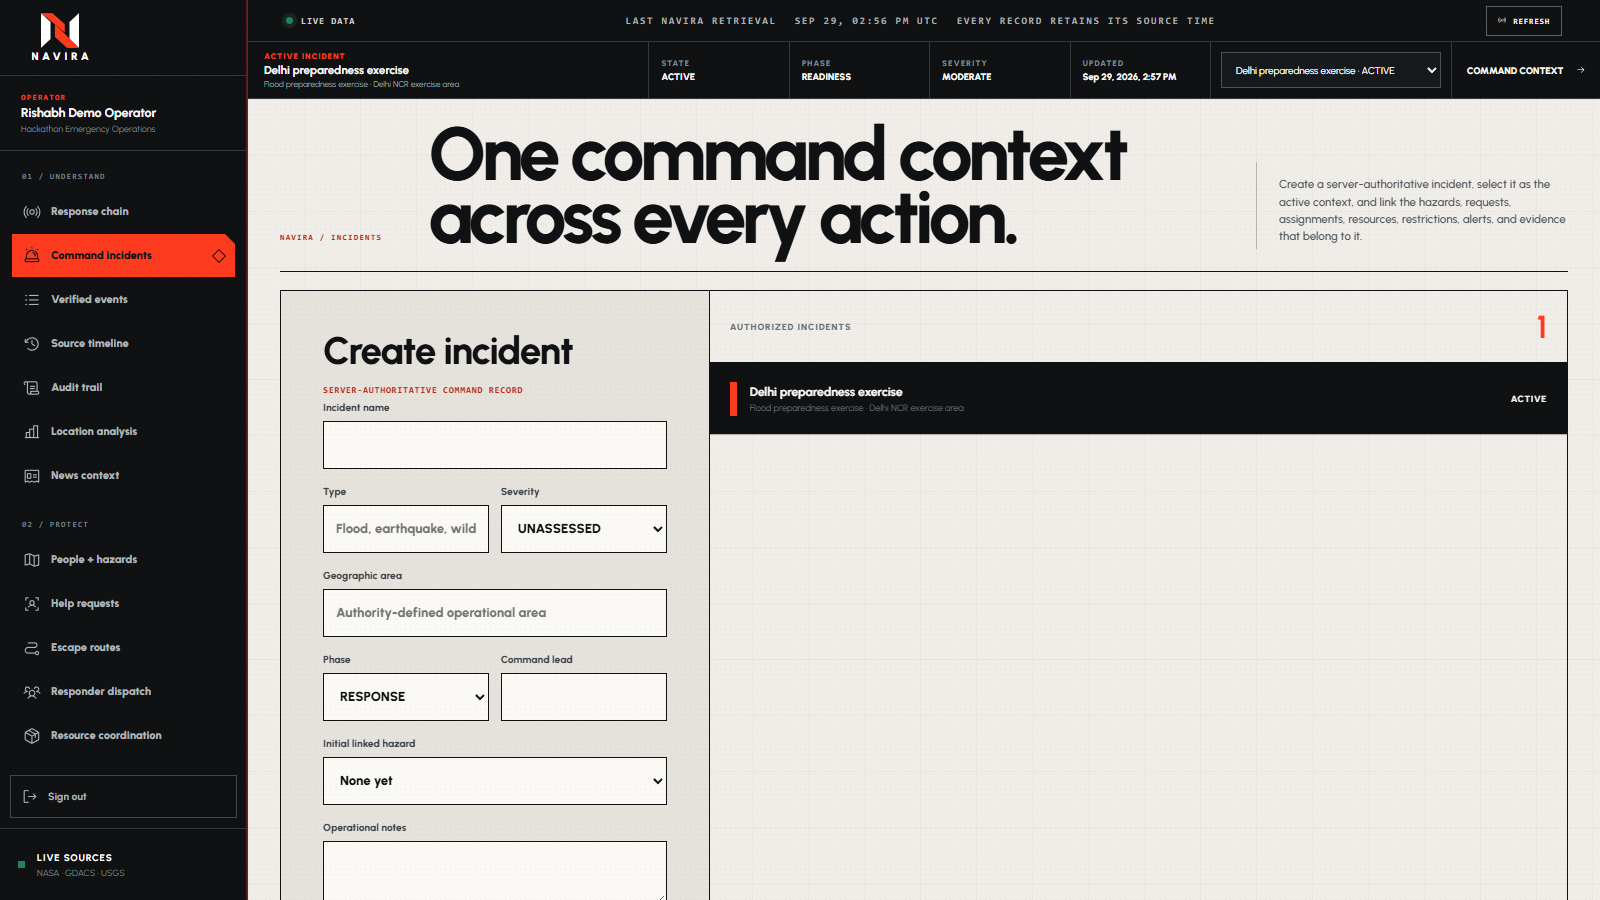
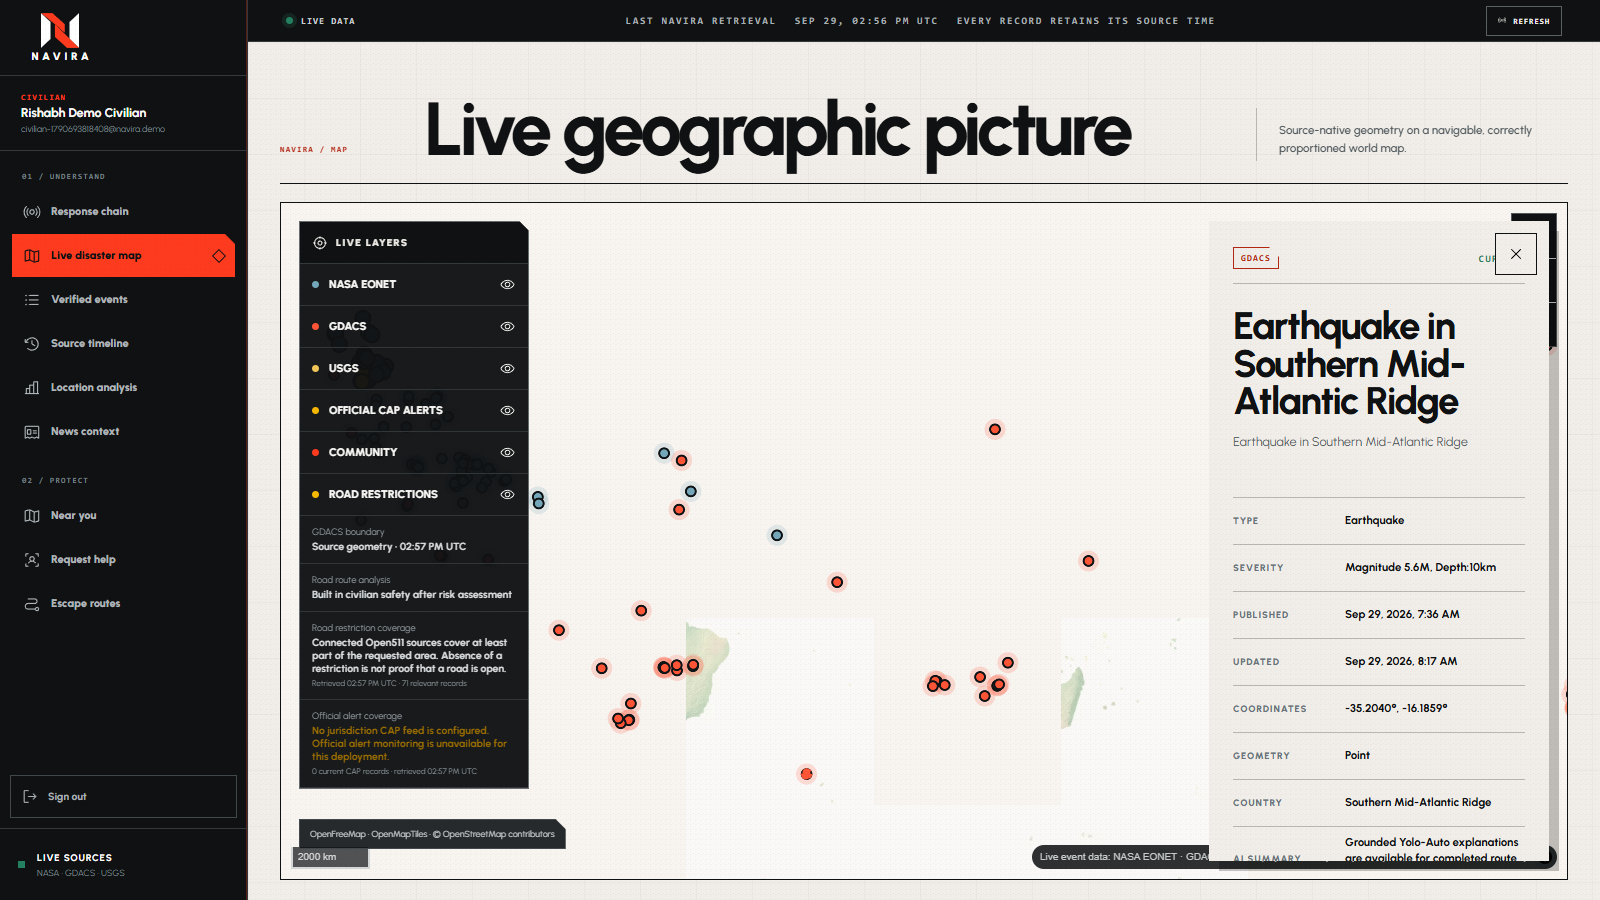
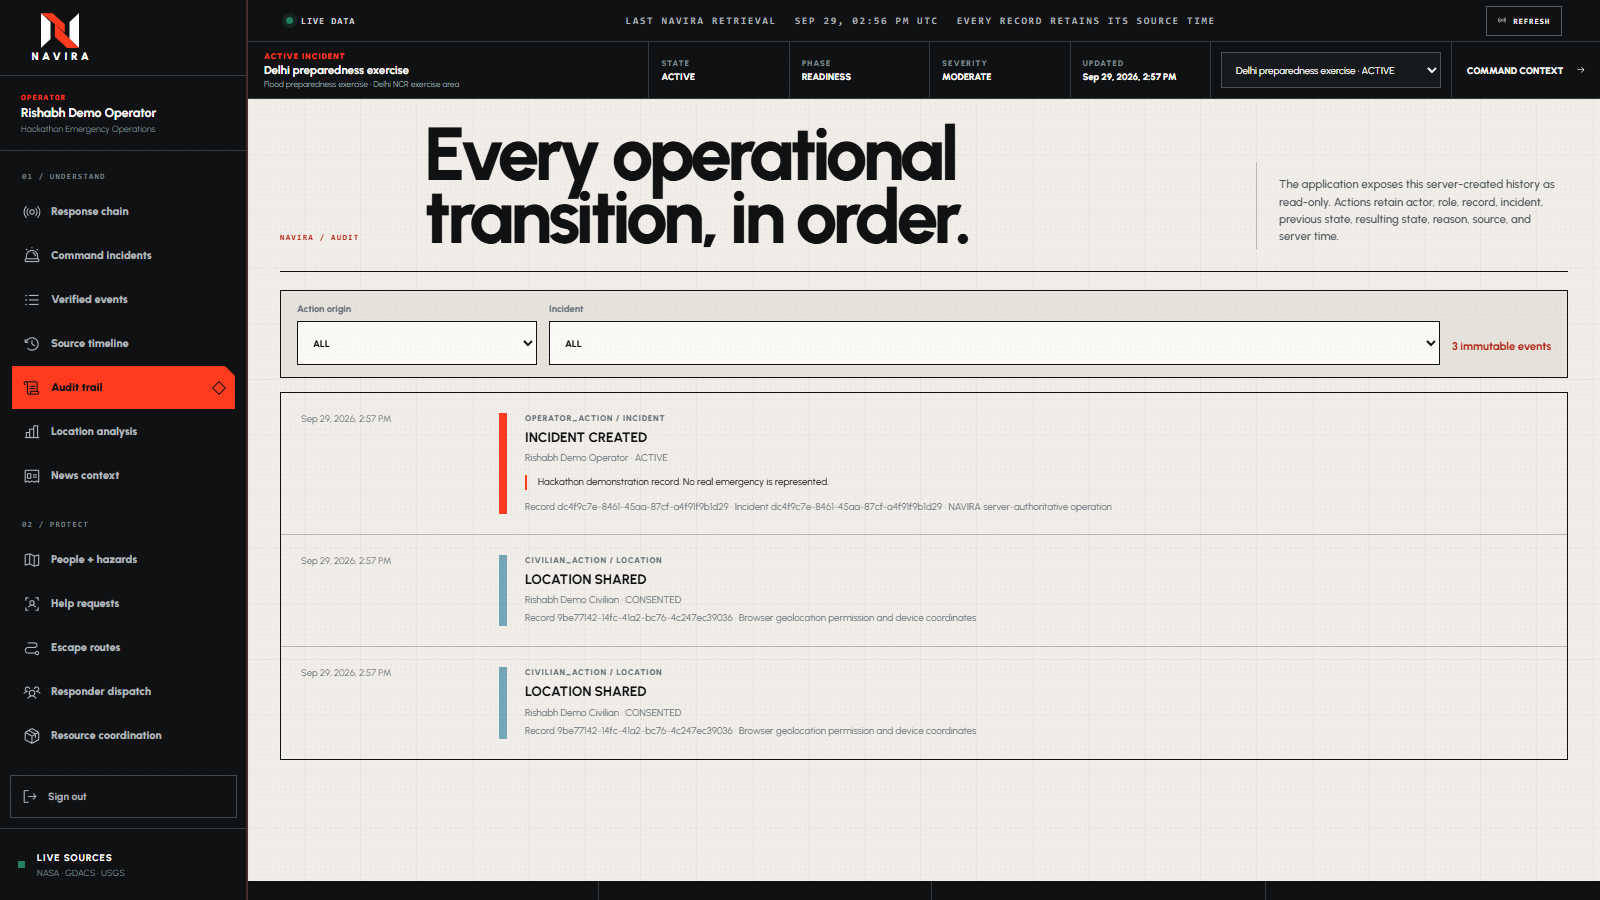
NAVIRA — Disaster response from verified signal to safer action
For login you can use your own Gmail or use the following judge accounts: Civilian: [email protected] | Password: NaviraCivilian#2026 Operator: [email protected] | Password: NaviraOperator#2026
Inspiration
NAVIRA was inspired by the floods in Nepal.
While watching the flooding unfold, I kept thinking about how confusing a disaster must feel for someone actually inside it. Information may exist across maps, government alerts, news reports, and social media, but a person still needs three simple answers:
Am I in danger? Where should I go? How do I get there?
Emergency operators face a different version of the same problem. They need to know who requires help, which incidents are verified, where responders should go, what resources are available, and whether infrastructure could withstand the disaster.
What NAVIRA does
NAVIRA connects three parts of disaster response:
- UNDERSTAND — detect and understand disasters using real geographic information.
- PROTECT — help civilians escape while giving operators tools to coordinate the response.
- TEST — visualize how infrastructure may react to controlled disaster scenarios.
The platform has separate civilian and operator experiences, while both sides share the same verified disaster picture.
Real disaster intelligence
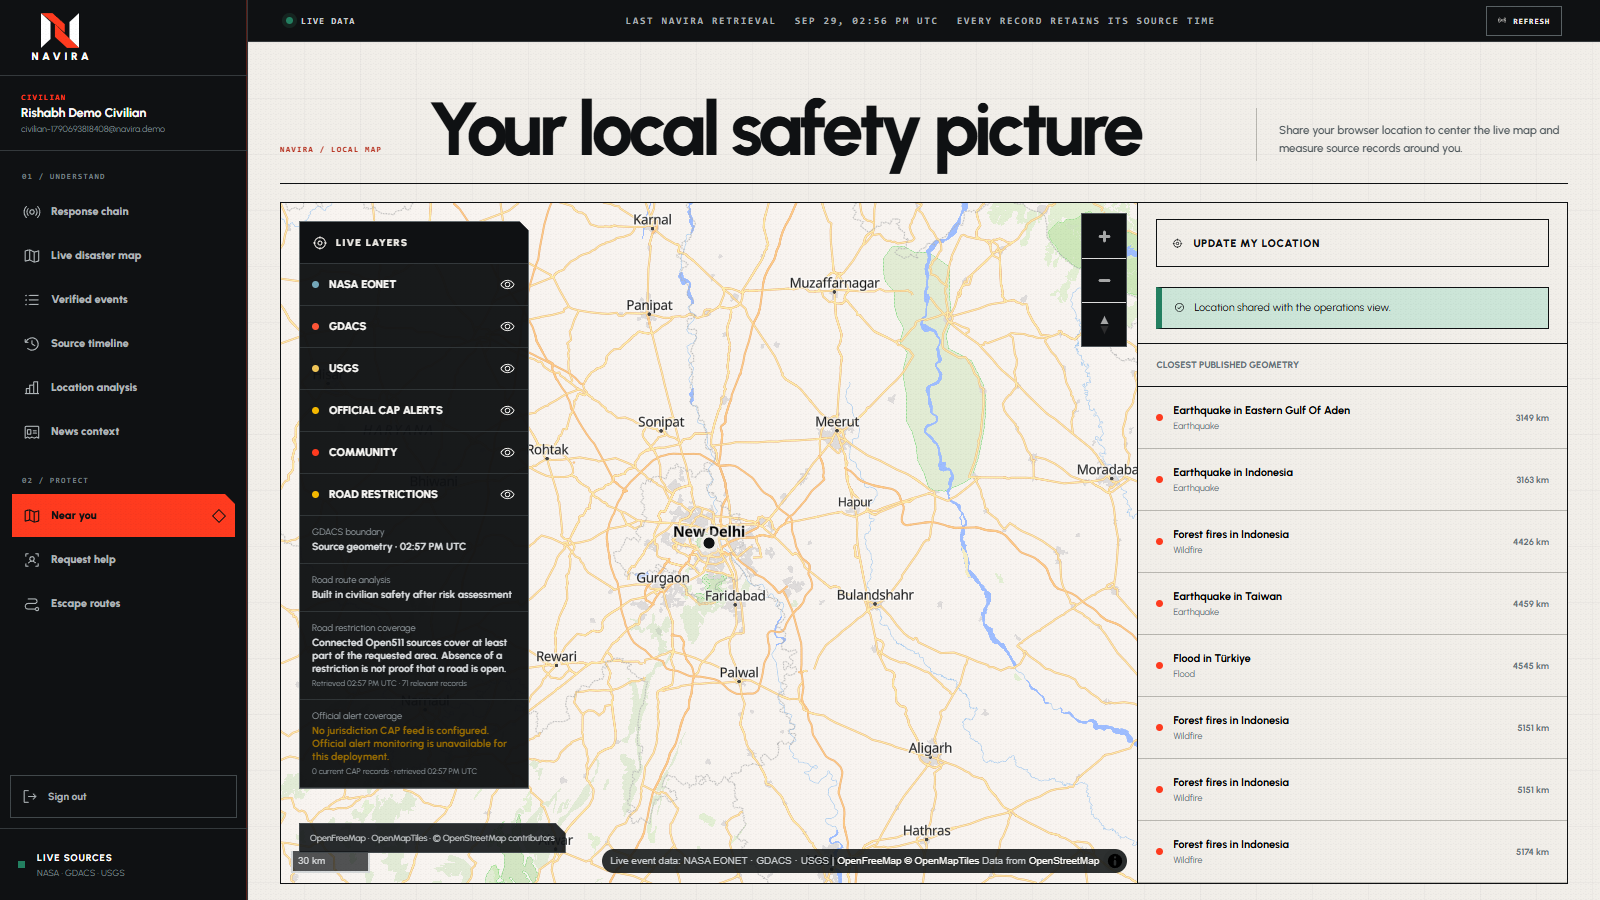
NAVIRA retrieves current disaster records from:
- NASA EONET
- GDACS
- USGS
Events appear on a real interactive MapLibre map using OpenStreetMap-based geography. Records preserve their actual coordinates, timestamps, sources, status, and available geometry.
If information is missing, NAVIRA displays that limitation instead of generating fake data.
Civilian safety
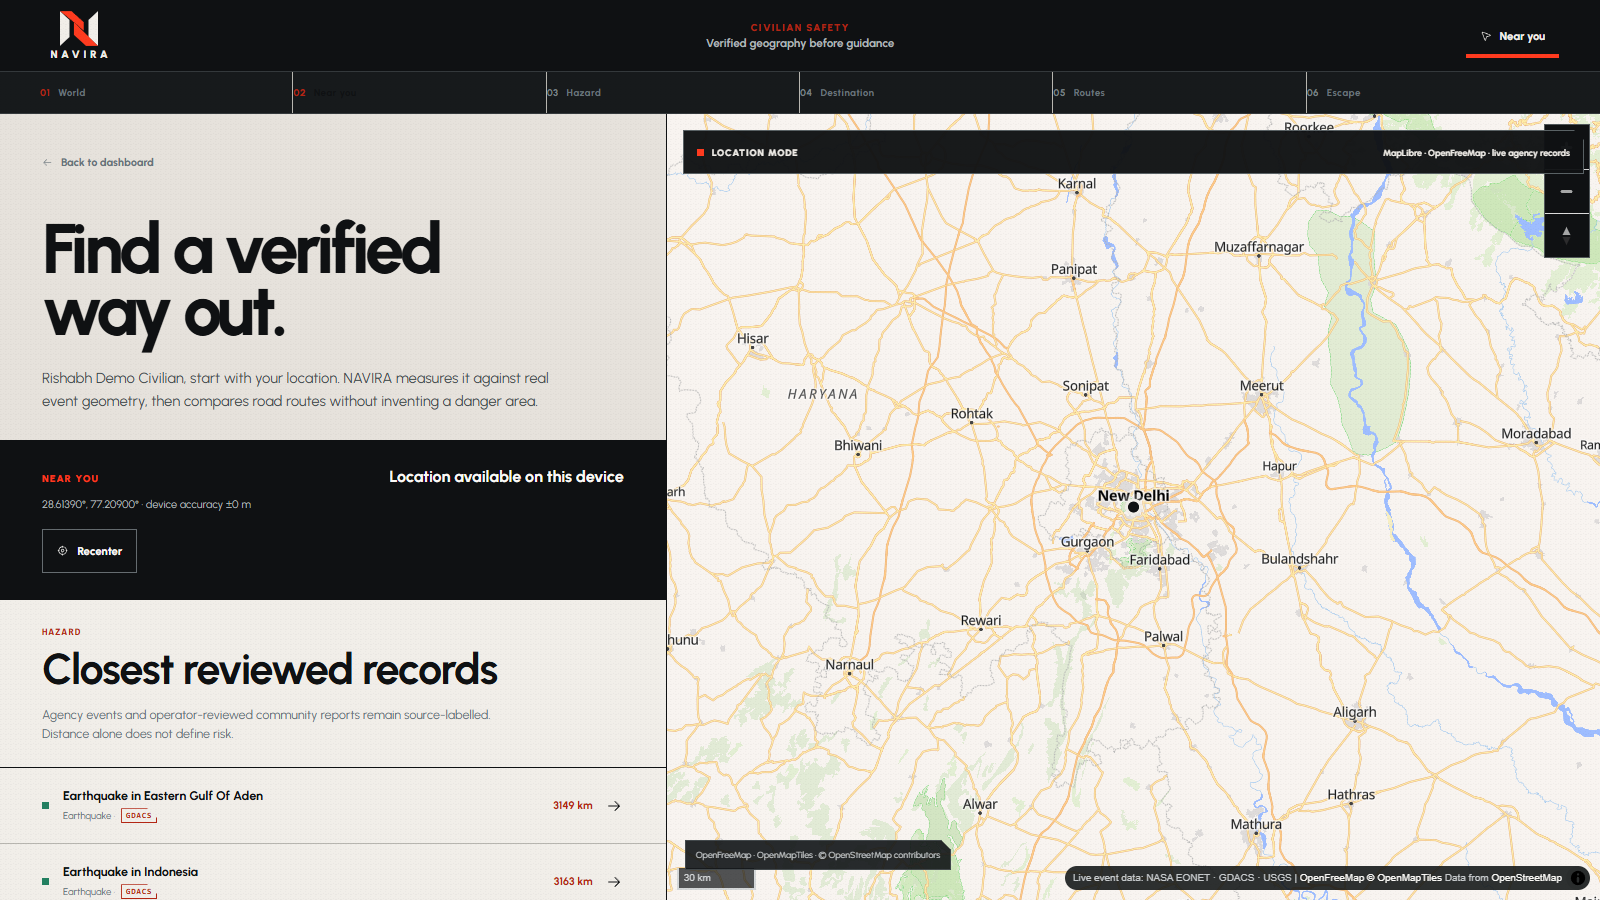
A civilian can activate Near You and give location permission. NAVIRA then:
- Centers the map on the civilian
- Finds nearby verified disaster records
- Calculates the distance to each event
- Checks whether the person's coordinates intersect available hazard geometry
- Explains when the available data is insufficient to determine the danger area
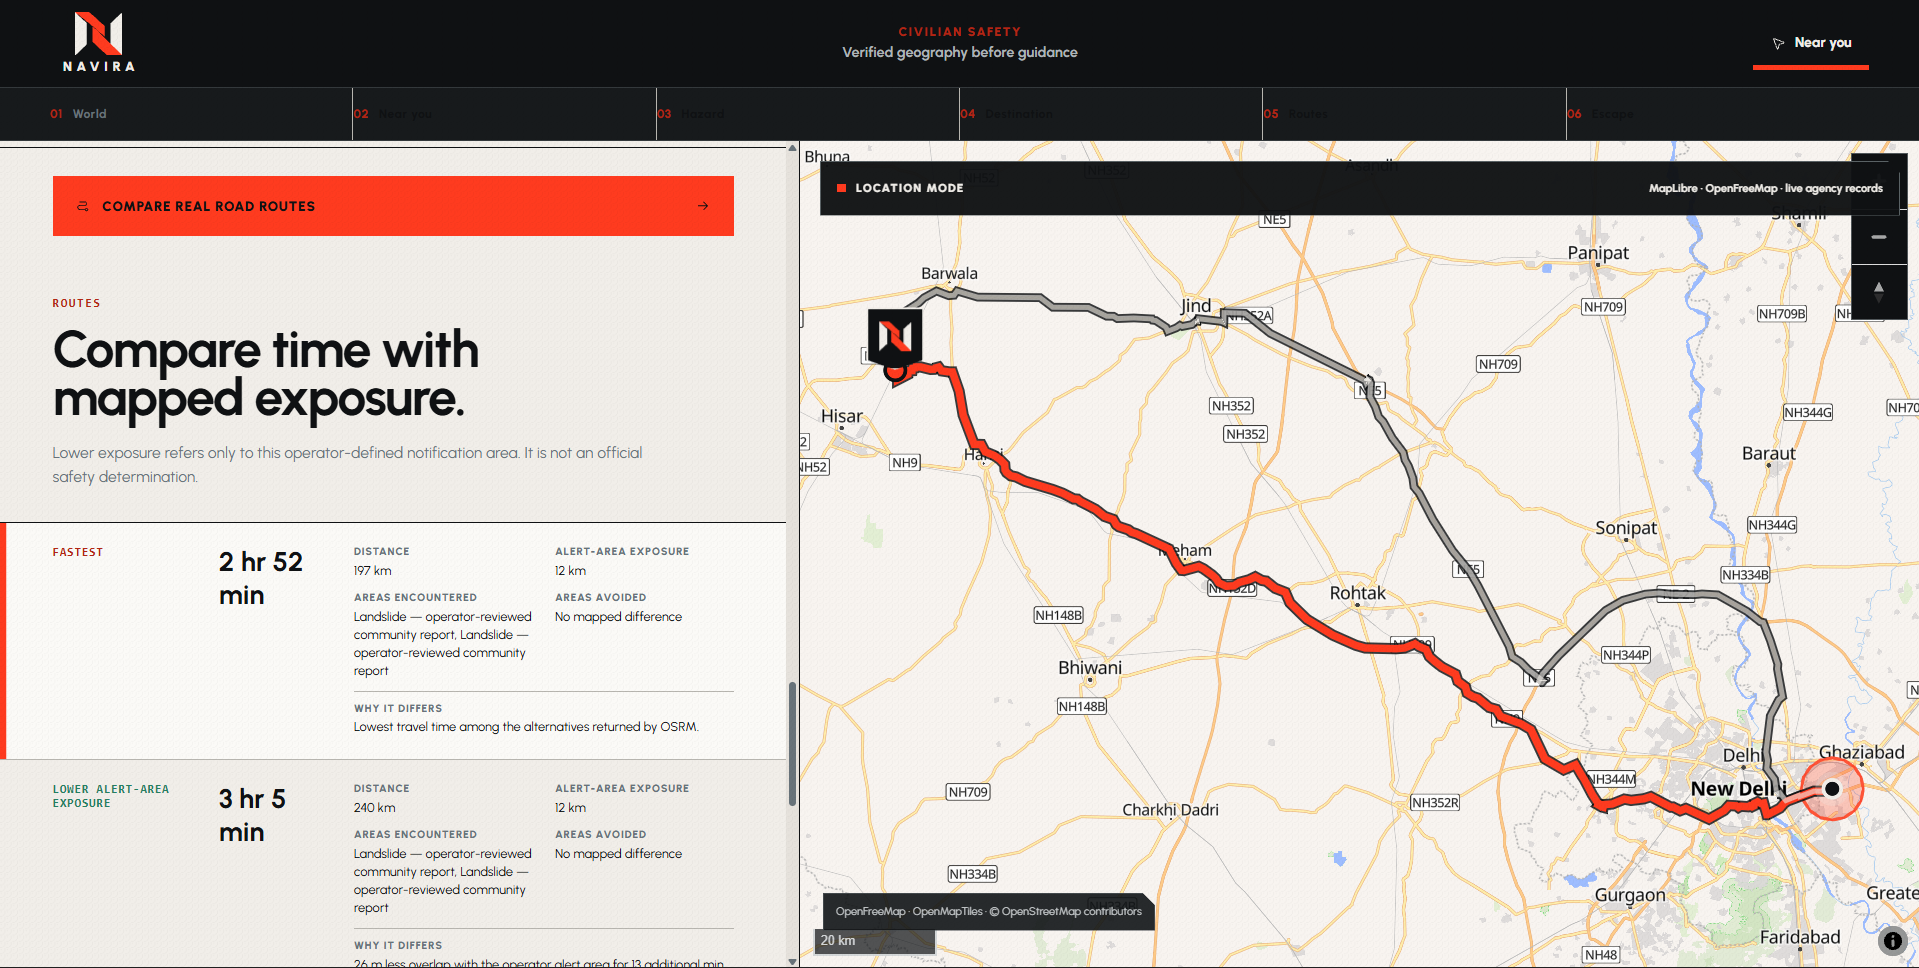
When the geographic evidence supports it, the civilian can enter a destination and compare real OSRM road routes.
NAVIRA distinguishes the fastest route from a route with lower verified hazard exposure. It never calls an alternative “safer” just because it is different.
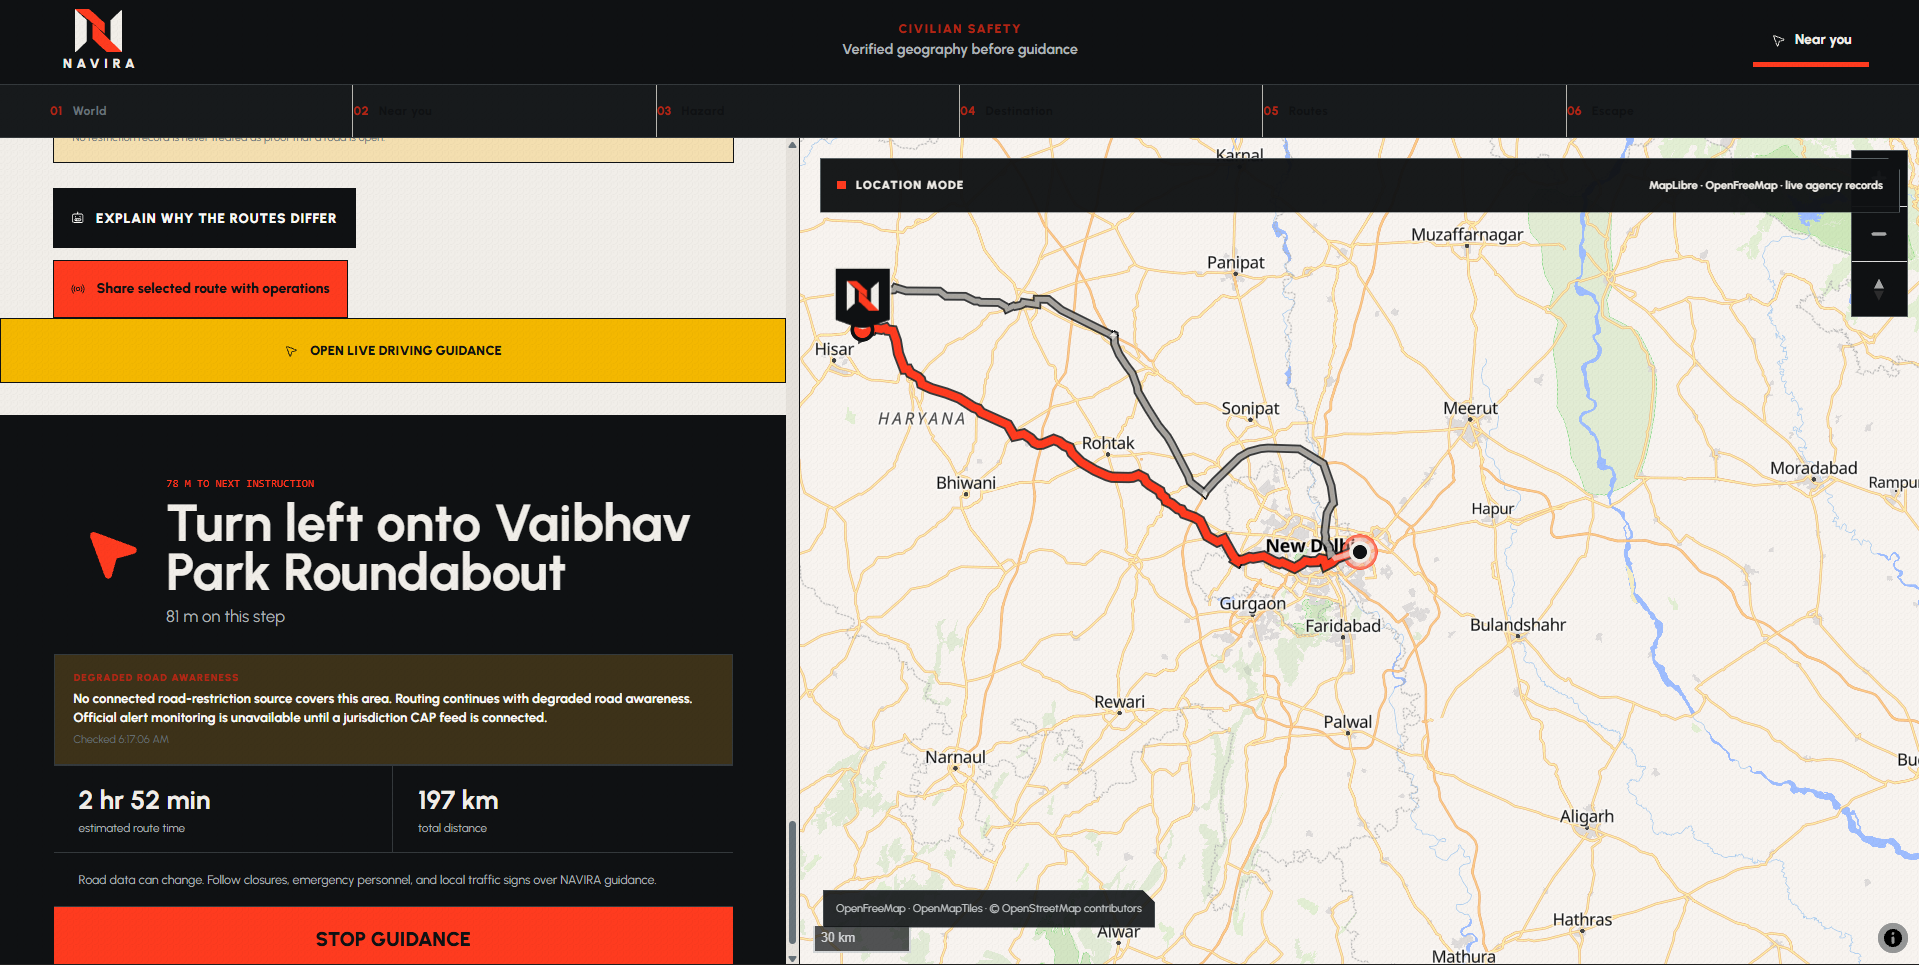
Navigation can monitor changes to connected hazard geometry, official alerts, and road restrictions. If the route changes, NAVIRA explains why.
Help requests and community evidence
Civilians near a qualifying hazard can request help.
They can also take or upload a photograph, select the possible disaster type, and attach their location after giving permission. The report does not immediately become a verified event.
An operator must inspect the evidence first. If accepted, it enters the shared operating map and can help operators identify nearby people who may need assistance.
This human verification step was important to me because an emergency platform should not treat every uploaded image as a fact.
Operator command center
Operators receive a connected workspace for:
- Incident management
- People and hazard visibility
- Civilian help requests
- Evacuation routes
- Responder assignments
- Resource allocation
- Verified evidence reports
- Event timelines
- Location analytics
- News and reporting context
- Operational audit history
Help requests can move through a complete lifecycle:
Verified → Assigned → Acknowledged → Dispatched → En route → On scene → Resolved
NAVIRA also keeps a server-authoritative audit trail so important actions cannot silently disappear. System events, civilian actions, responder actions, and operator actions remain distinguishable.
Infrastructure Simulation Lab
NAVIRA includes a Three.js-based Infrastructure Simulation Lab.
Users can search mapped infrastructure, enter an address, or build their own structure. For image-assisted reconstruction, exterior images go through a human approval stage before they are sent to the AI vision workflow.
The lab supports:
- Imported infrastructure footprints
- Human-verified reference images
- AI-assisted visual interpretation
- Procedural 3D model generation
- Direct face, edge, and vertex editing
- Earthquake, flood, and extreme-wind scenarios
- Deformation, movement, water, wind, crack, and damage visualization
- Before, during, and after states
- Design A versus Design B scenario comparison
The simulator is clearly presented as a visual and heuristic tool. It does not claim that a building is safe, unsafe, or likely to collapse without a validated engineering solver.
How I built it
The frontend was built with React and Vite. MapLibre GL JS renders the geographic map, while OpenFreeMap and OpenStreetMap provide the underlying map data.
Turf.js handles deterministic geographic operations such as distance calculations and point-versus-geometry checks. OSRM provides road-network routing.
The server normalizes data from NASA EONET, GDACS, USGS, CAP feeds, and supported Open511 road-restriction sources. Sensitive credentials and AI requests remain server-side.
Three.js powers the Infrastructure Simulation Lab, and Cannon-es supports physics-based interactions. GSAP is used for intentional interface and simulation motion.
NAVIRA also includes role-based authentication, HttpOnly sessions, server-side authorization, and durable operational storage using Upstash Redis.
AI is deliberately secondary. It can explain already-retrieved route and hazard facts or interpret human-approved infrastructure images. It cannot invent disasters, coordinates, boundaries, routes, severity levels, or evacuation decisions.
Challenges I faced
The hardest challenge was combining sources that all describe disasters differently. One source might provide a point, another a polygon, and another only limited location information. I had to normalize these records without pretending that every event had a complete danger boundary.
Routing was another major challenge. Finding the fastest route is straightforward, but calling a route “safer” requires actual evidence. I built route comparison around overlap with verified hazard geometry and connected road restrictions.
The 3D lab was probably the most difficult technical feature. Turning footprints and approved images into recognizable procedural models required working with geometry, materials, lighting, image validation, model-editing controls, and simulation states.
I also learned that empty states matter. In an emergency product, “no data received” cannot mean “everything is safe.” NAVIRA communicates when road, alert, infrastructure, or reporting coverage is degraded.
What I learned
Before NAVIRA, I mostly thought of maps as visual components. I now understand much more about coordinates, GeoJSON, projections, polygons, routing graphs, spatial intersections, source freshness, and the difference between a missing record and a confirmed safe condition.
I learned how to combine React, MapLibre, Turf.js, Three.js, server APIs, authentication, persistent storage, and external feeds into one connected system.
The biggest lesson was that responsible software is not just about adding more features. Sometimes the correct output is:
“The available data is not enough to determine this.”
That honesty is especially important when people could make real decisions based on what the interface says.
What's next
I would like to connect NAVIRA with more regional emergency-alert, shelter, responder, traffic, and road-closure systems.
I also want to improve offline support, multilingual emergency guidance, accessibility, mobile navigation, and the simulation engine. A future version could connect validated engineering solvers instead of relying only on visual and heuristic simulation.
My goal is for NAVIRA to become more than a collection of maps and dashboards. I want it to demonstrate how the same verified disaster record can move from detection, to civilian protection, to operator action, and finally to infrastructure testing.
Built With
- api
- eonet
- gdacs
- gl
- gsap
- javascript
- maplibre
- nasa
- node.js
- openai-compatible
- openfreemap
- openstreetmap
- osrm
- qwen
- react
- redis
- render
- router
- three.js
- turf.js
- upstash
- usgs
- vite
- xml


Log in or sign up for Devpost to join the conversation.