
Project Overview
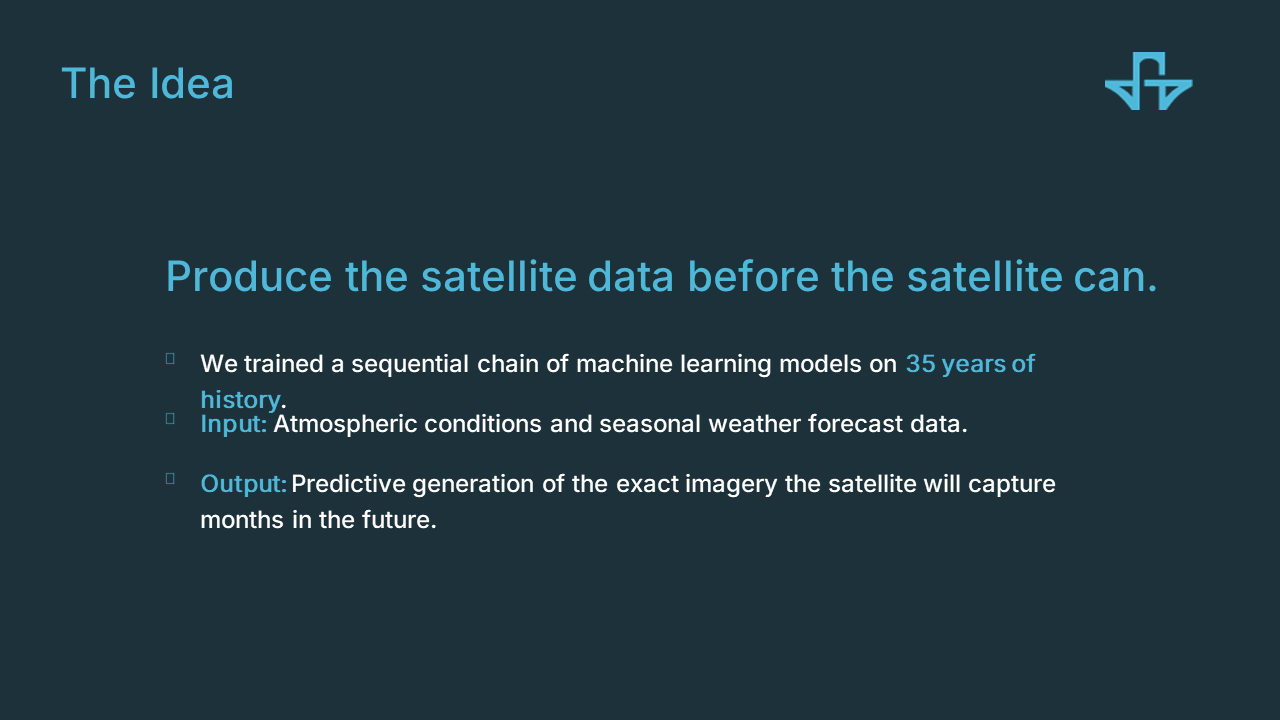
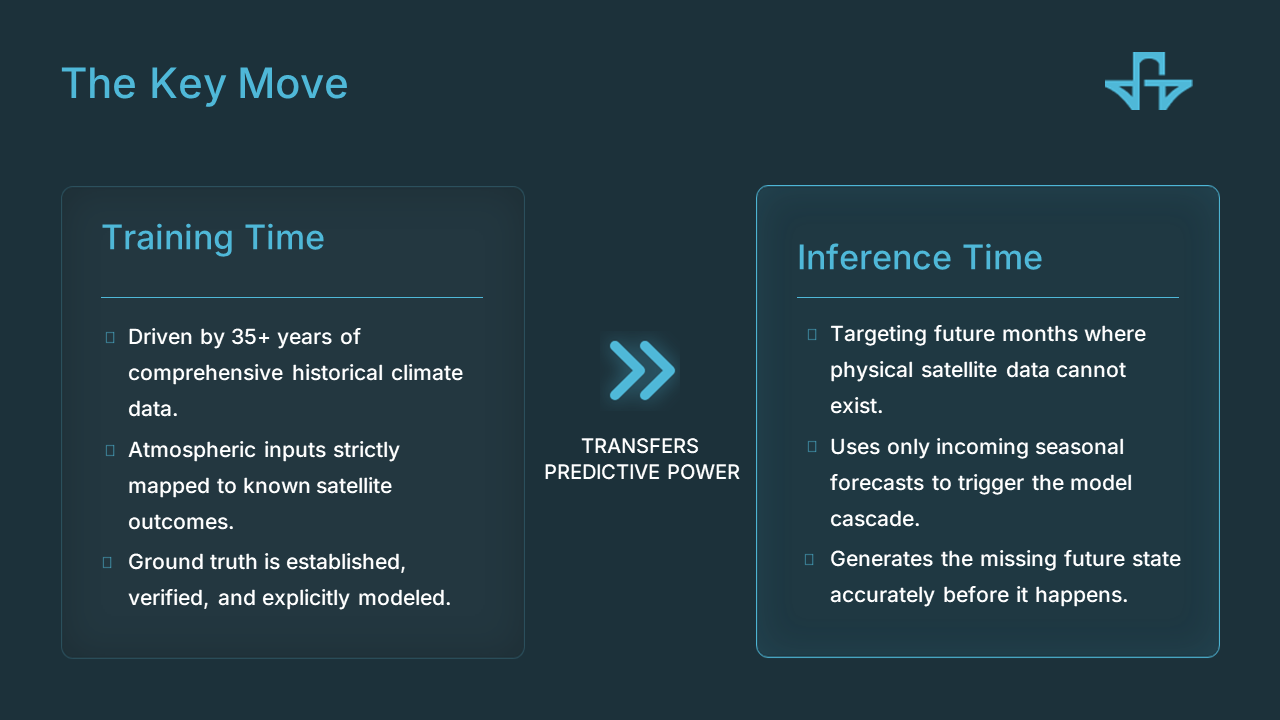
- The Constraint: Seasonal drought forecasts rely on CHIRPS rainfall and MODIS vegetation, which are only available for past months. Satellites cannot photograph the future.
- The Cascade Bridge Solution:
- Trains XGBoost regressors to synthesize satellite indicators from atmospheric variables.
- Drives a drought classifier (built on 51 satellite-derived features) up to three months ahead using ECMWF SEAS5 seasonal forecasts.
- Distills the satellite record during training, eliminating the need for a live satellite feed at forecast time.
- Intended Users: Organizations acting before a food-security emergency:
- ICPAC and national meteorological agencies (issuing regional outlooks).
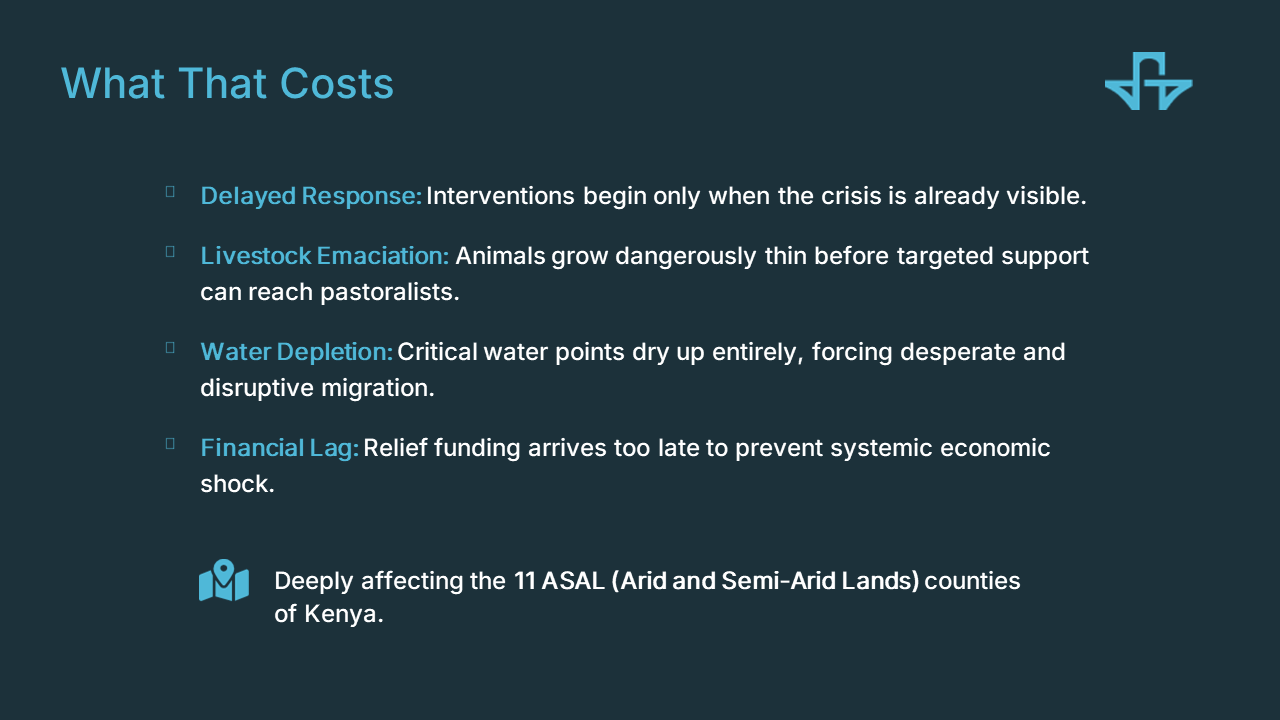
- County drought committees in Kenya's ASALs (pre-positioning water trucking and fodder).
- Anticipatory-action funds (releasing money on a trigger).
- Note: This adds a forecast layer to existing monitoring systems like ICPAC's Drought Watch or HUSIKA.
- Coverage Area: 11 counties across 3 ASAL clusters:
- Turkana, Marsabit, Samburu, Isiolo, Wajir, Mandera, Garissa, Kitui, Makueni, Machakos, and Tharaka-Nithi.
- Transparency & Ethics:
- Forecasts are explicitly labeled as experimental.
- The dashboard publishes base rates, baselines, and confidence intervals alongside every metric.
- Principle: An early warning system that overstates its own confidence is worse than none.
Solution Details
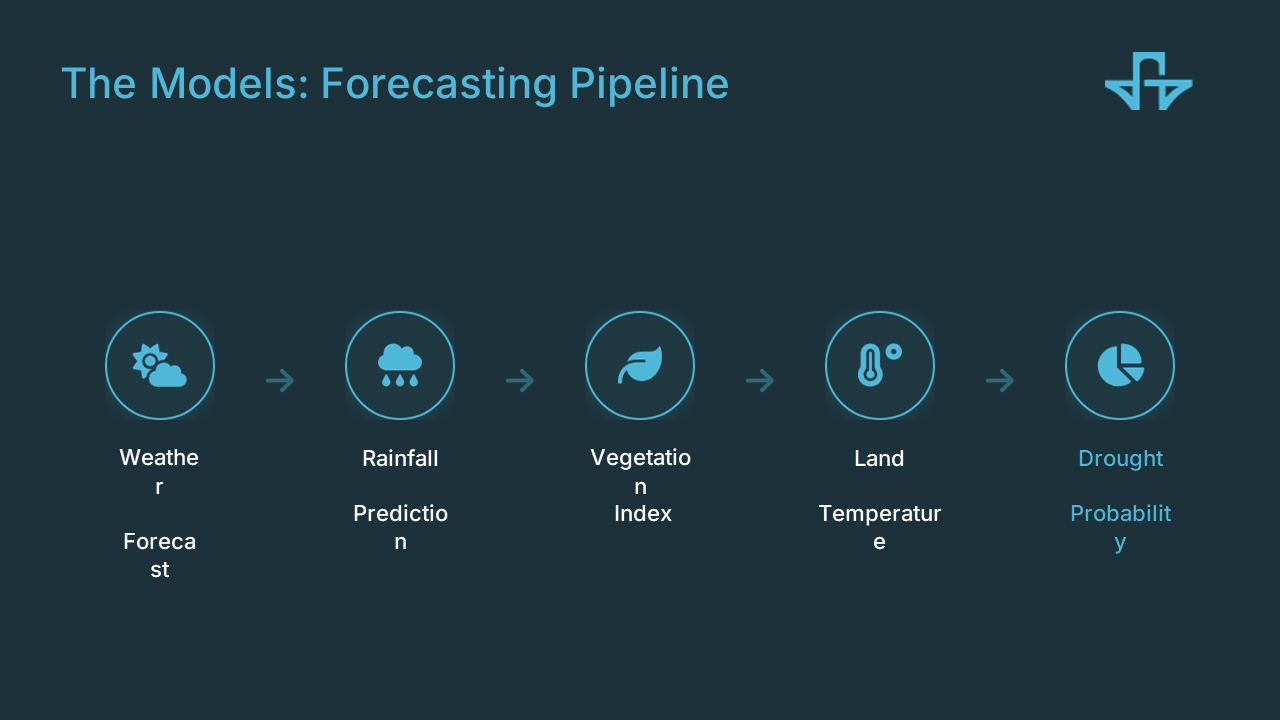
- Core Mechanism: Overcomes the lack of future satellite data by chaining four XGBoost regressors:
text SEAS5 (51 ensemble members, atmosphere only) Bridge 1: ERA5 vars -> CHIRPS rainfall proxy Bridge 2: + CHIRPS proxy -> MODIS NDVI proxy Bridge 3: + NDVI proxy -> LST day / night proxies -> 51 features -> XGBoost classifier -> P(drought) - Pipeline Processing:
- Physical Ordering: Each bridge consumes the previous one's output (rainfall drives greenness → greenness moderates surface temperature).
- Derived Indices: SPI (gamma-fitted), SPEI (log-logistic), VCI, TCI, and VHI.
- Adjustments:
- Bias correction maps the SEAS5 anomaly onto the ERA5 climatology.
- PET uses the Hargreaves method.
- Soil moisture relies on a disclosed persistence assumption (as SEAS5 does not provide it).
- Decision Logic:
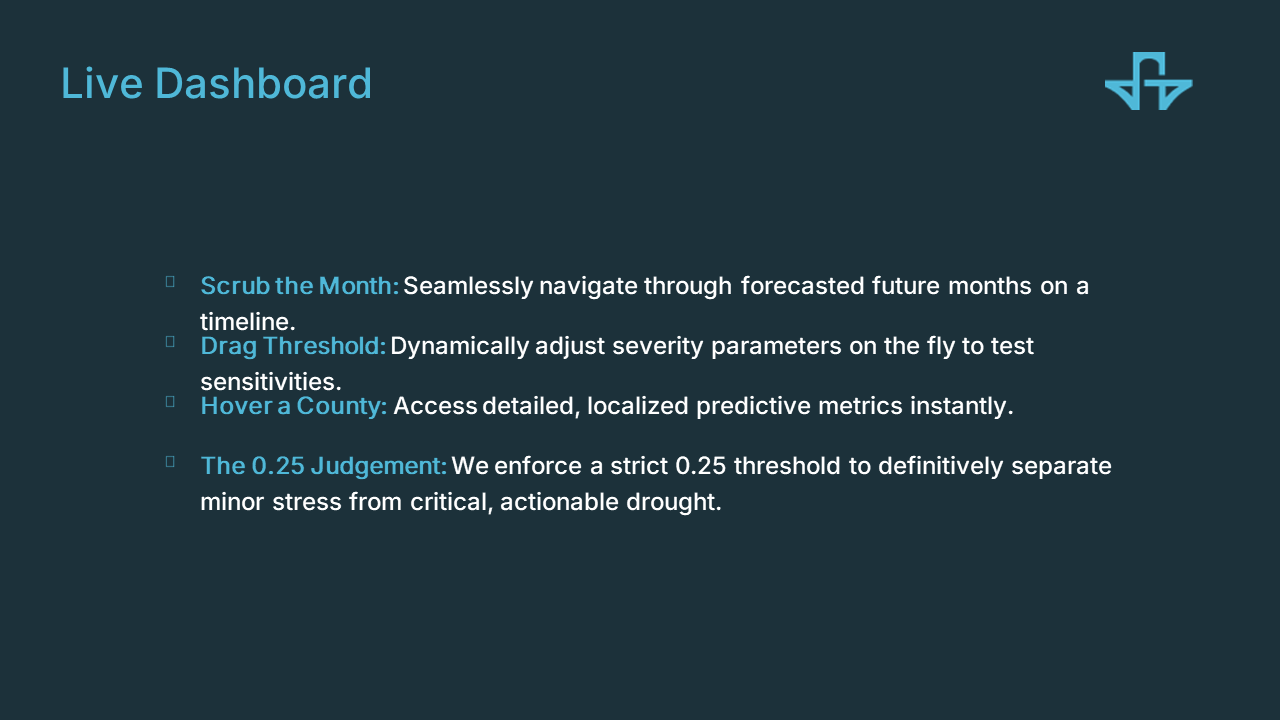
- Default Threshold: Set at 0.25 (rather than 0.5), encoding the judgment that a missed drought costs roughly three times as much as a false alarm.
- Customizability: A dashboard slider allows different stakeholders to read probabilities at their own risk tolerance. Changing the threshold changes the decision, never the forecast.
- LLM Advisory Layer:
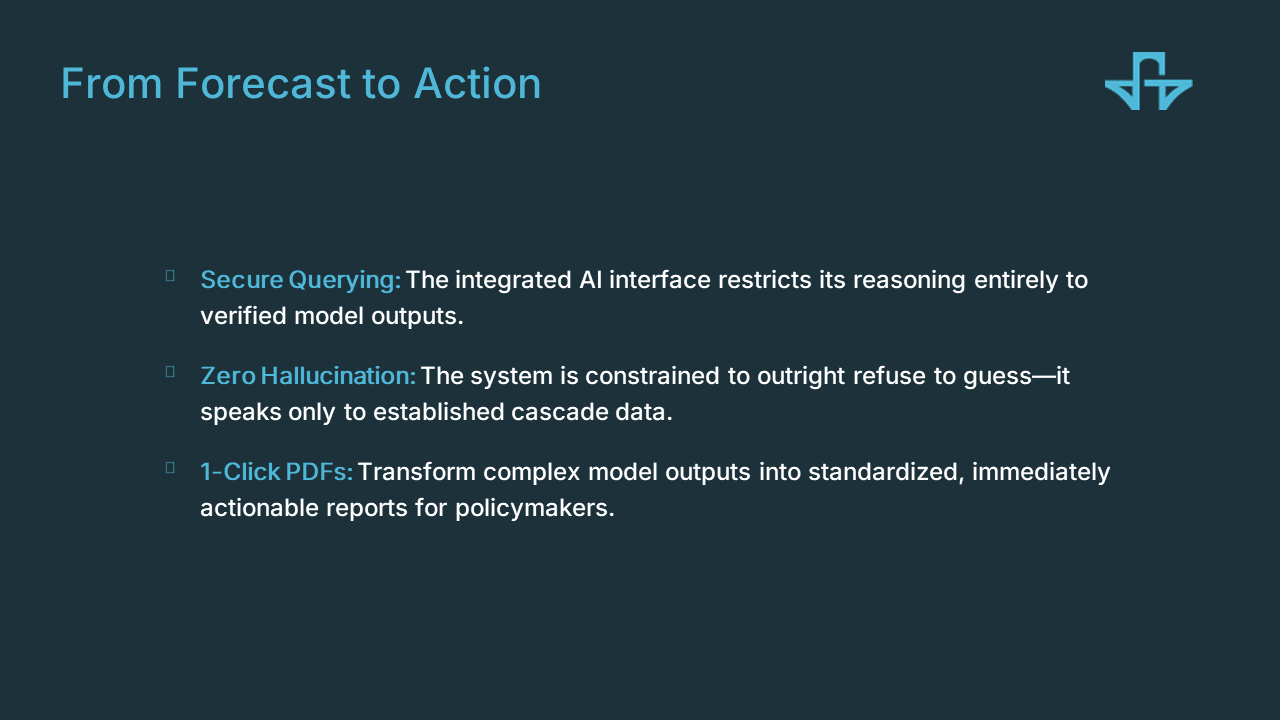
- Uses Groq to transform the forecast into an advisory format.
- Features grounded Q&A and generates county bulletins exportable to PDF.
- Data Integrity: The model writes the prose, but all tabular numbers are rendered directly from the forecast JSON to ensure a mis-stated figure cannot reach the data.
- Technology Stack:
- Backend & Data: Python 3.11, XGBoost 2.0.3 (CPU), xarray/cfgrib, pandas, scipy.
- Infrastructure: AWS S3/EC2, boto3.
- Frontend: Static dashboard with MapLibre GL, Cloudflare Pages + Pages Functions.
- Inference: Groq.
- Baseline Comparison:
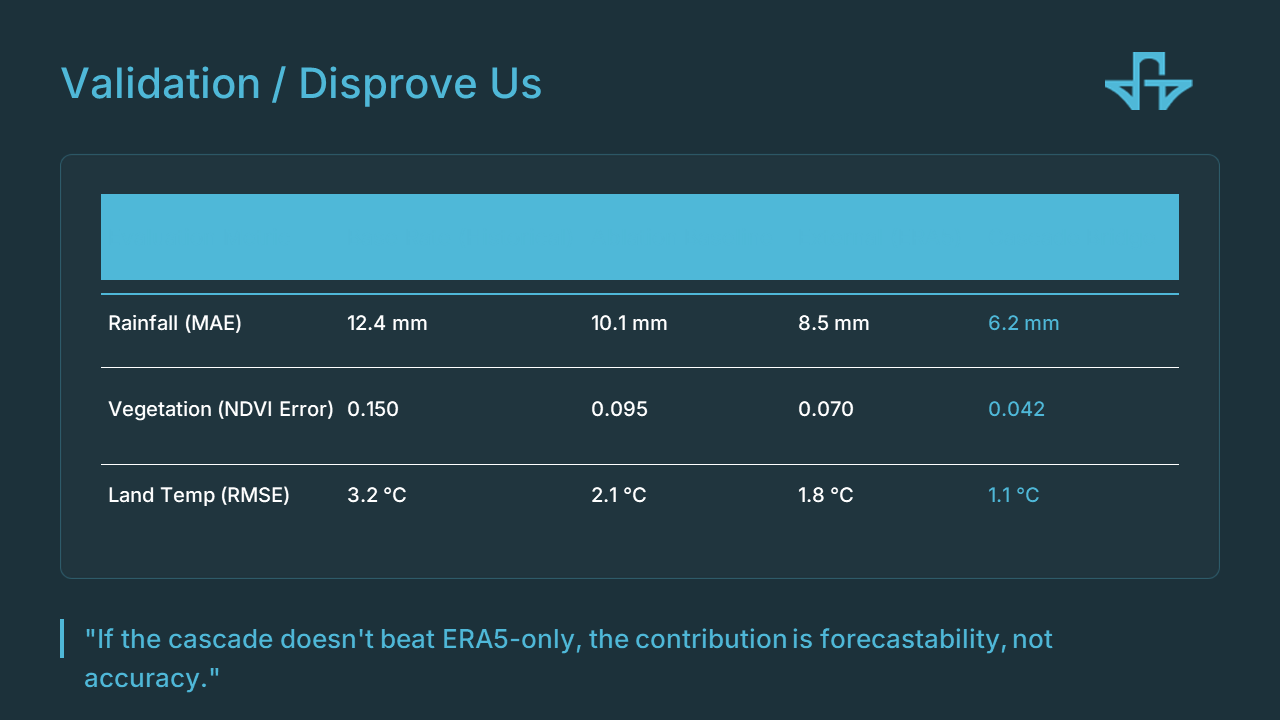
- Publishes the ERA5-only baseline (the classifier without the bridges) to transparently show whether the bridges add predictive value over their own inputs.
Built With
- amazon-web-services
- aws-ec2
- cfgrib
- chirps
- cloudflare-pages
- cloudflare-workers
- ecmwf-seas5
- era5
- geojson
- geopandas
- geospatial
- groq
- javascript
- llama
- machine-learning
- maplibre-gl
- modis
- numpy
- pandas
- parquet
- python
- scikit-learn
- scipy
- xarray
- xgboost


Log in or sign up for Devpost to join the conversation.