-
-
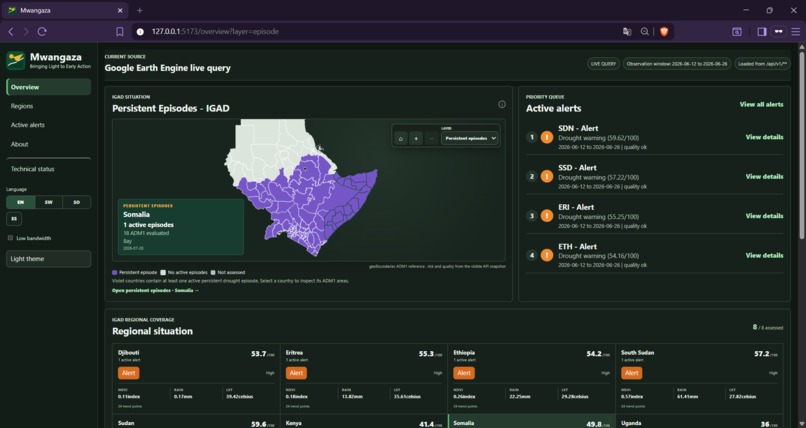
IGAD-wide view separating active persistent episodes from evaluated inactive areas.
-
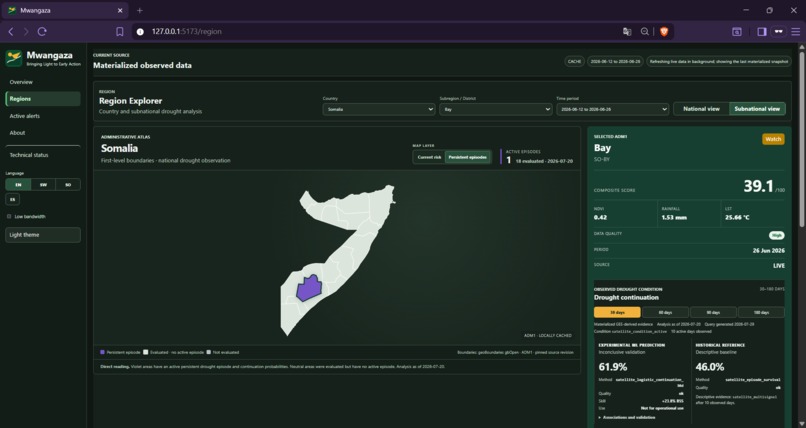
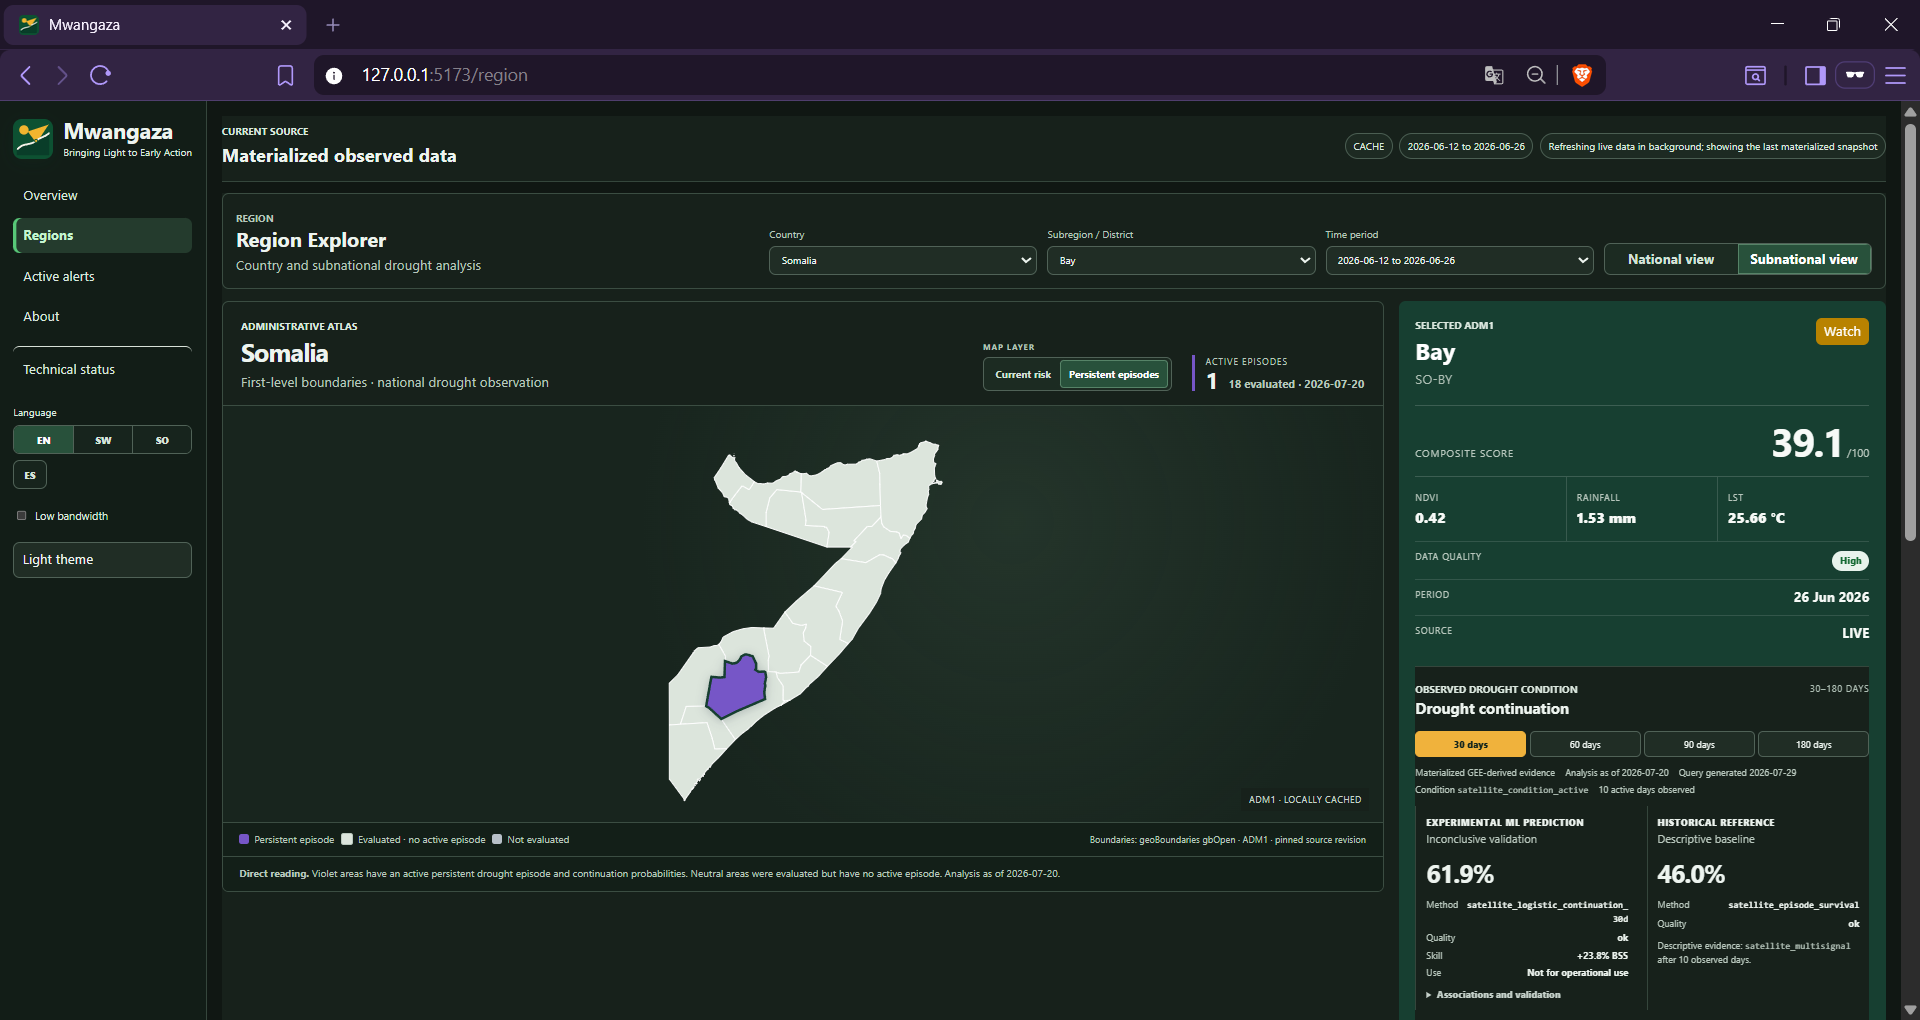
ADM1 drilldown comparing experimental ML continuation estimates with historical reference.
-
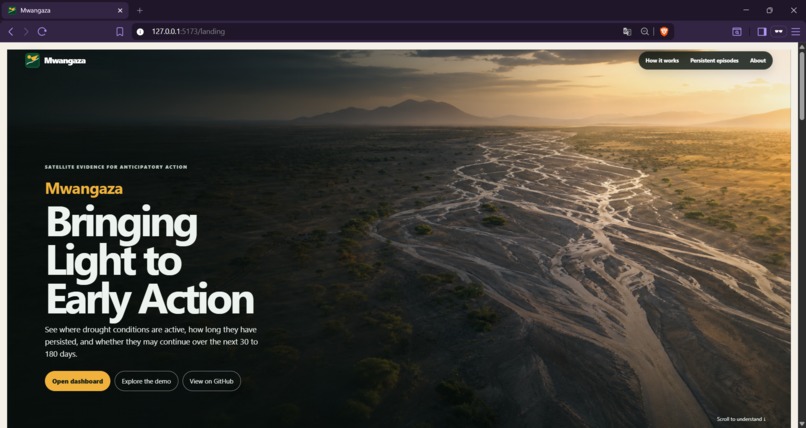
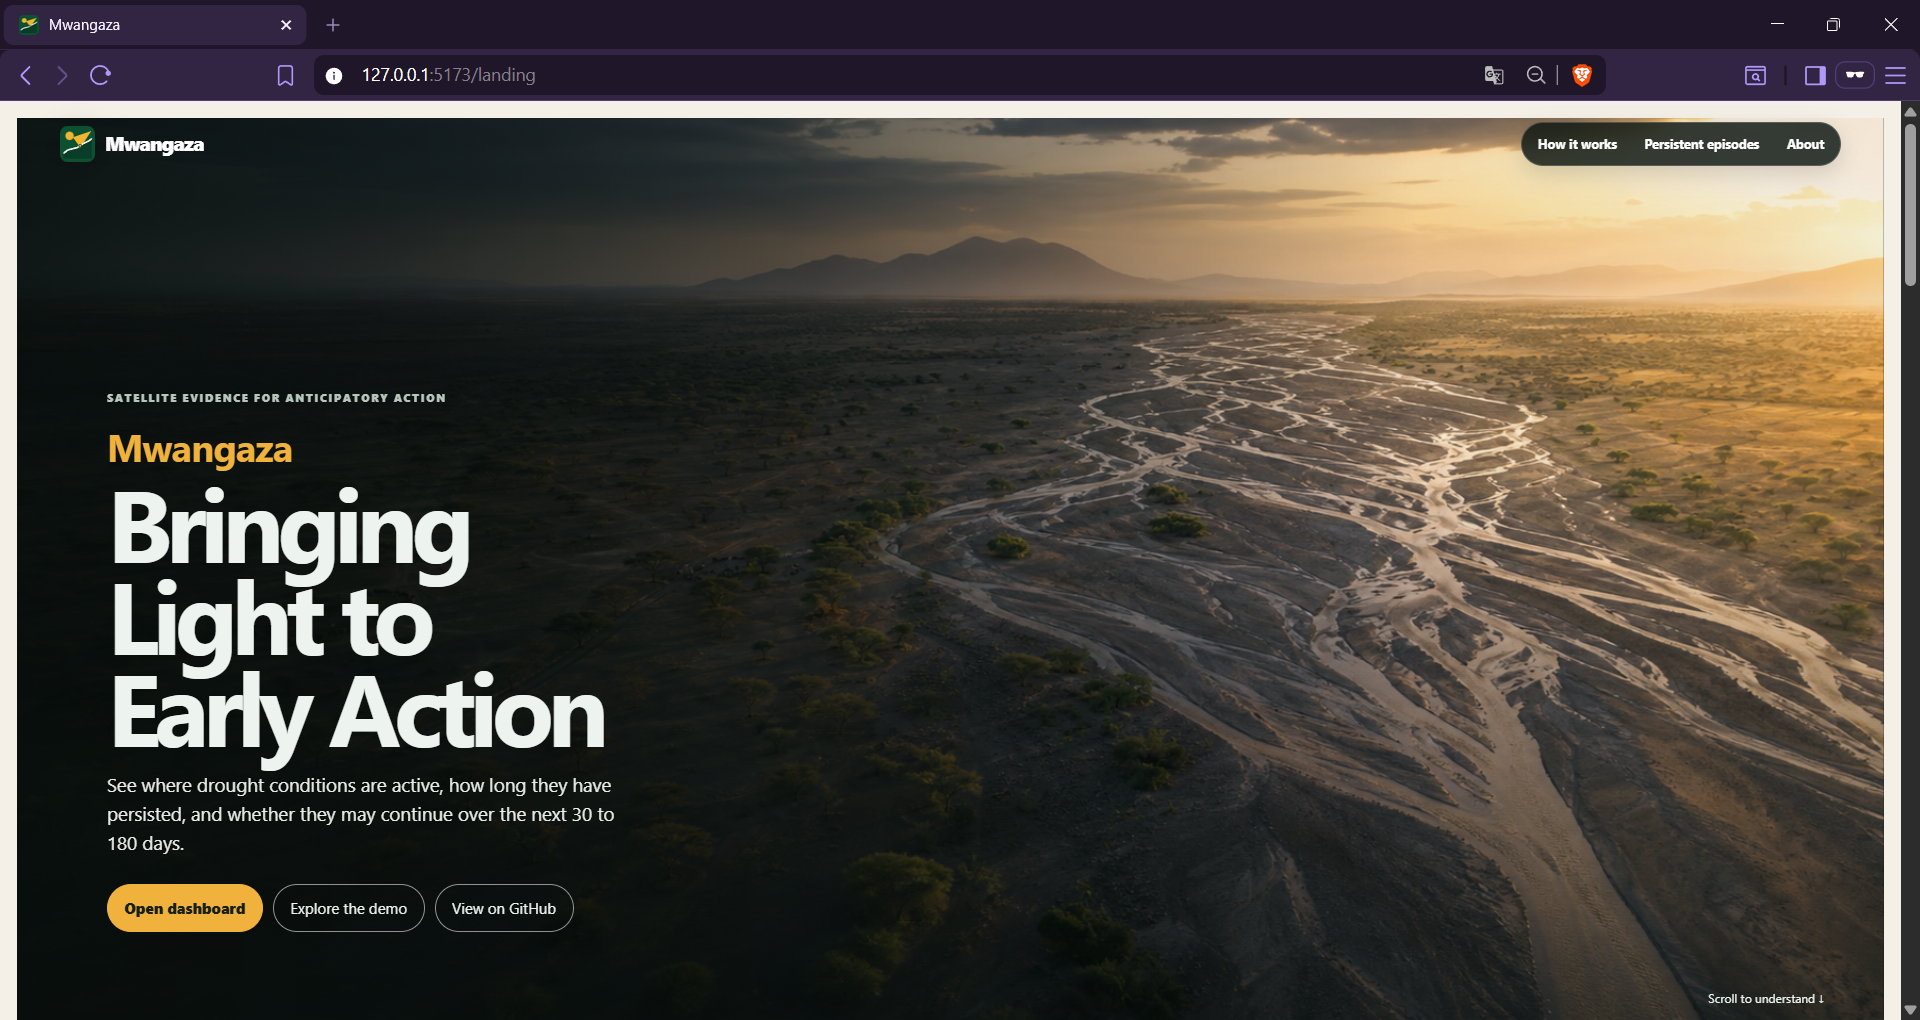
Mwangaza — satellite evidence for anticipatory drought action.
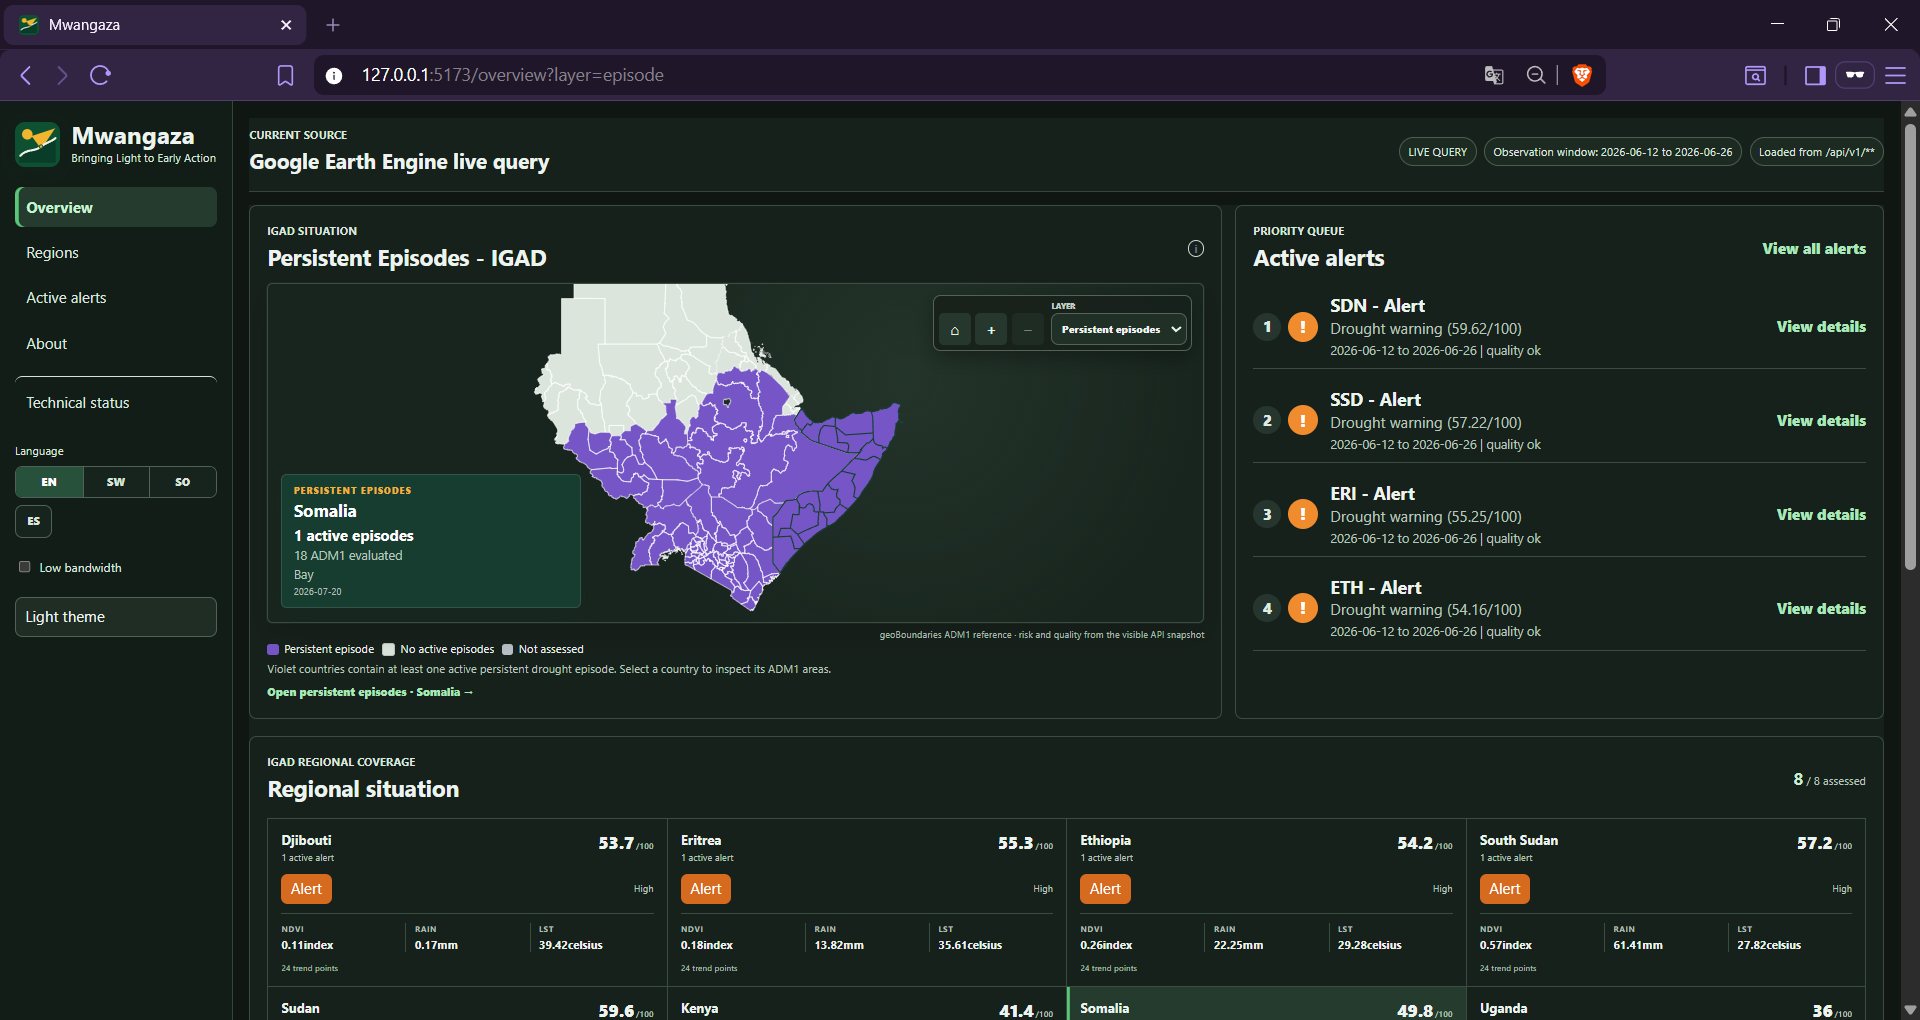
Project Overview
Inspiration
Drought monitoring often tells decision-makers what conditions look like now, but not whether an active condition will remain long enough to require anticipatory action. Sparse official reporting and inconsistent geographic coverage also make regional prioritization difficult.
What Mwangaza does
Mwangaza is a satellite-powered drought decision-support prototype for regional analysts, disaster-risk teams, humanitarian planners and local authorities across IGAD.
It applies one transparent method to all 121 ADM1 areas in eight IGAD countries. Every area is evaluated for an active multisignal drought condition. Active episodes receive continuation outlooks at 30, 60, 90 and 180 days. Inactive areas remain explicitly “not applicable” instead of displaying a misleading probability.
The interface provides an IGAD-wide persistent-episode map, country and ADM1 drilldowns, indicator trends, data-quality and freshness metadata, prioritized alerts and early-action recommendations.
Mwangaza helps users answer three questions quickly:
- Where is a drought condition currently active?
- How long has that condition persisted?
- Is the same episode likely to continue?
Solution Details
How we built it
Mwangaza processes MODIS vegetation and land-surface-temperature data, CHIRPS rainfall and FLDAS soil-moisture evidence through Google Earth Engine. A Python pipeline aggregates the signals by ADM1, constructs historical baselines and identifies active drought conditions.
Every signal retains its effective observation date, availability date, age and quality. This prevents a recently executed query from being presented as a recent observation.
For active episodes, an experimental machine-learning model estimates continuation probability and is displayed alongside a separate historical reference. Walk-forward backtesting always hides future observations before making each estimate. NDMA drought phases are used for external validation where available, while FEWS NET remains contextual impact evidence rather than a drought-phase label.
The results are served through a Python API and presented in a React and TypeScript interface.
Challenges and lessons learned
The main challenges were sparse official labels, asynchronous satellite updates, changing administrative boundaries and avoiding future-data leakage.
We learned that machine learning should not automatically replace a strong historical baseline. Mwangaza therefore shows both, labels ML as experimental and keeps uncertainty and provenance visible.
What is next
The next step is operational validation with regional analysts, scheduled data refreshes and additional independently verified drought episodes for stronger calibration.
Built With
- analysis
- api
- app
- chirps
- earth
- engine
- fastapi
- fldas
- geojson
- geospatial
- learning
- machine
- modis
- progressive
- pytest
- python
- react
- rest
- scikit-learn
- typescript
- vite
- vitest
- web

Log in or sign up for Devpost to join the conversation.