Inspiration
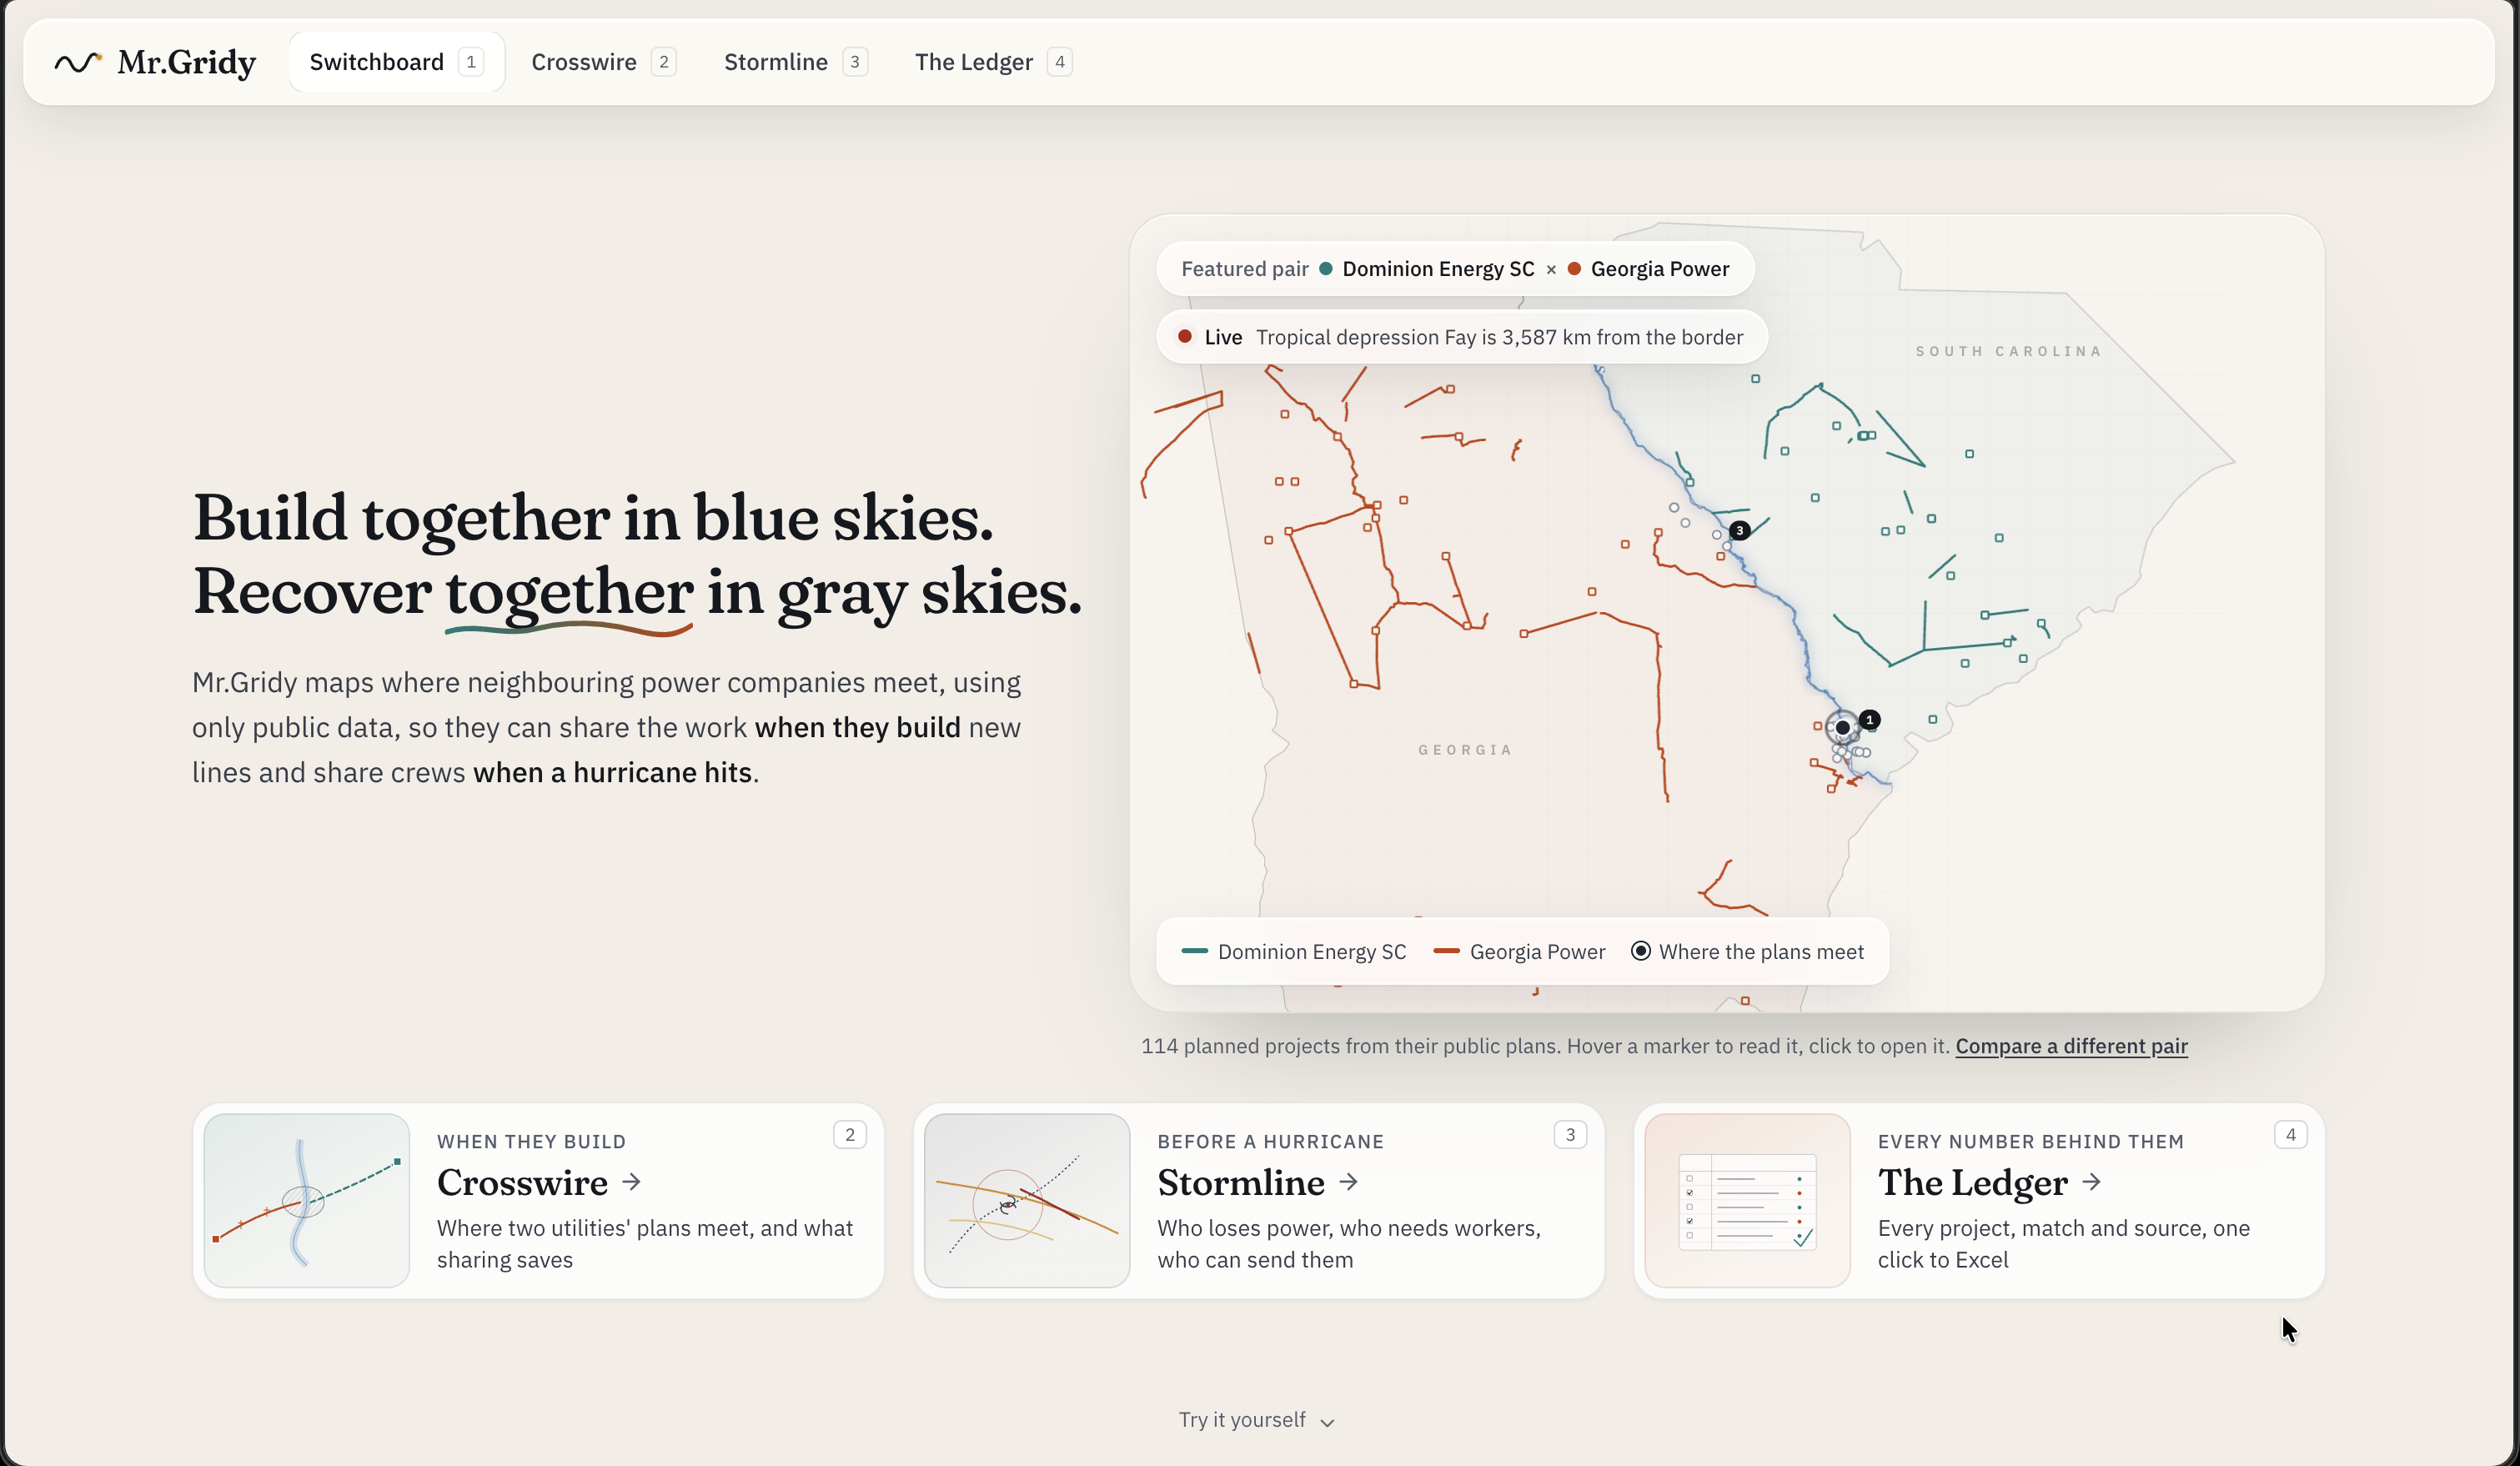
Georgia Power and Dominion Energy South Carolina sit on opposite sides of the Savannah River. Both are building new power lines in the same area, over the same years, and neither can easily see what the other is planning. The plans are public, but they're buried in 100-page PDFs that nobody reads side by side.
So you end up with two crews, two staging yards and two sets of permits, sometimes just a few miles apart. Then a hurricane comes through and hits both grids at once. Each company scrambles to fix its own lines, while the crews that could help are sitting a river away.
Either way, the waste shows up on everyone's power bill. We built Mr.Gridy so neighbouring utilities can work together both before they build and after a storm.
What it does
Mr.Gridy has two jobs.
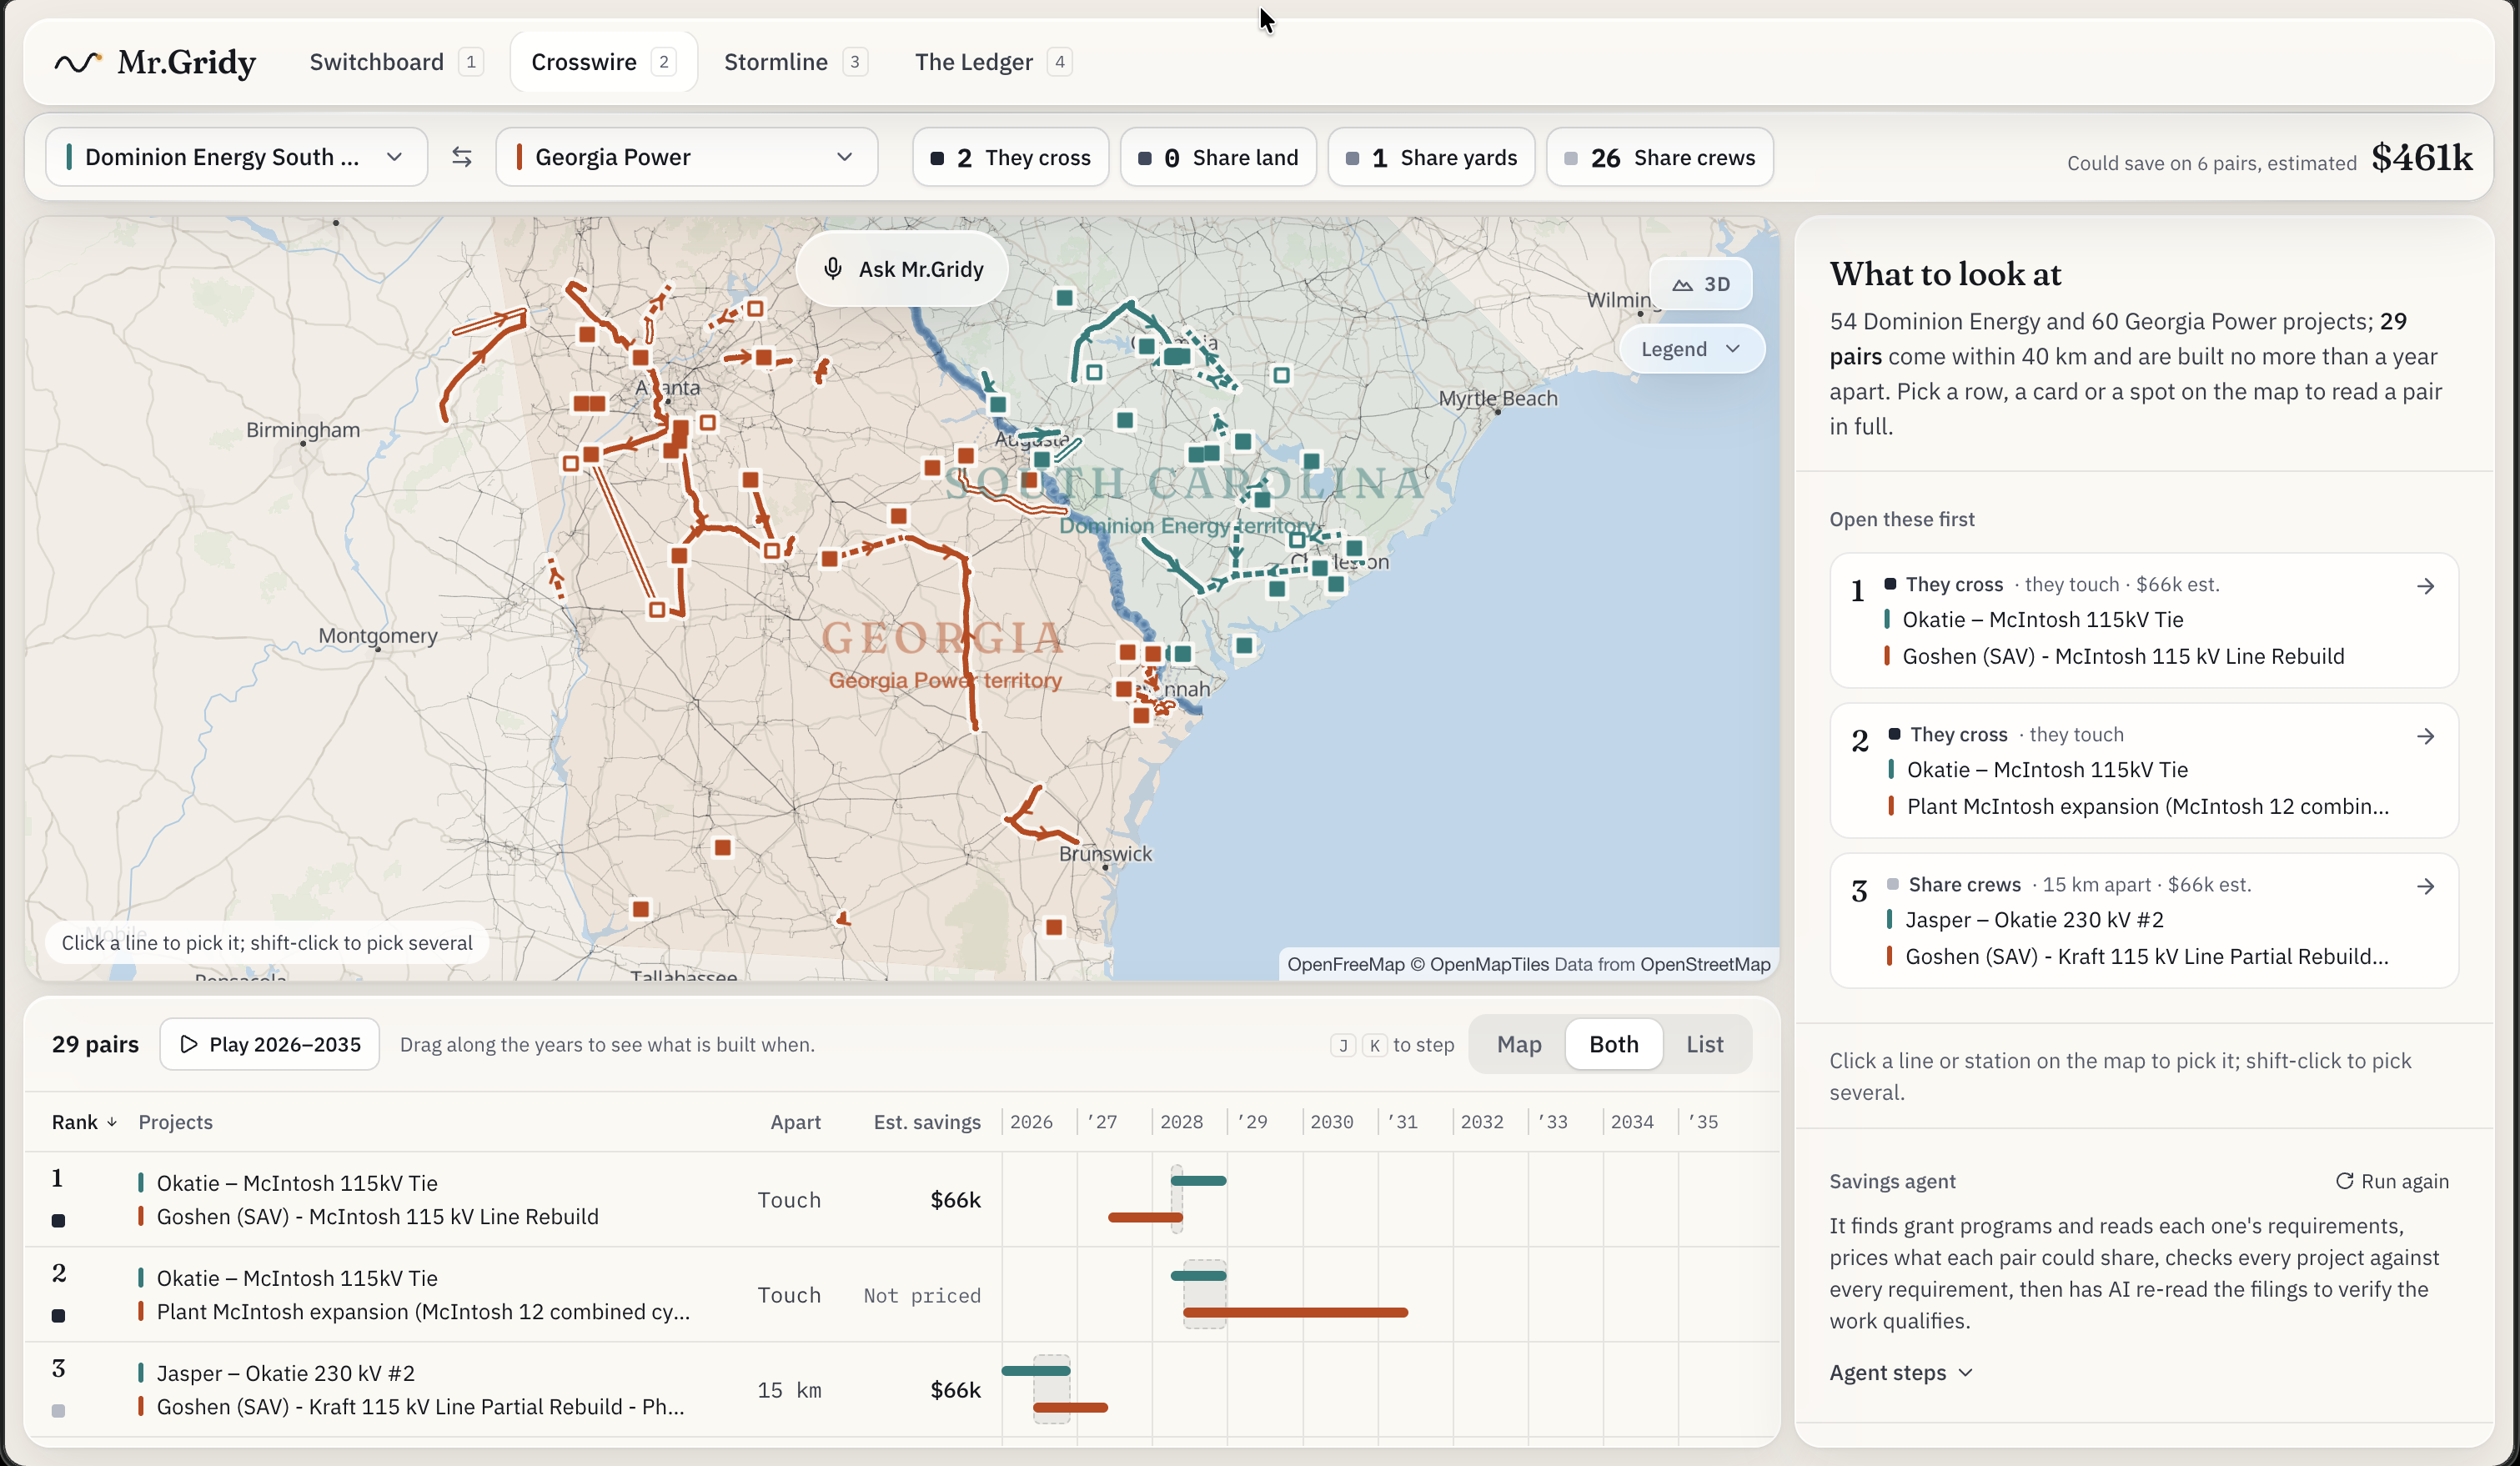
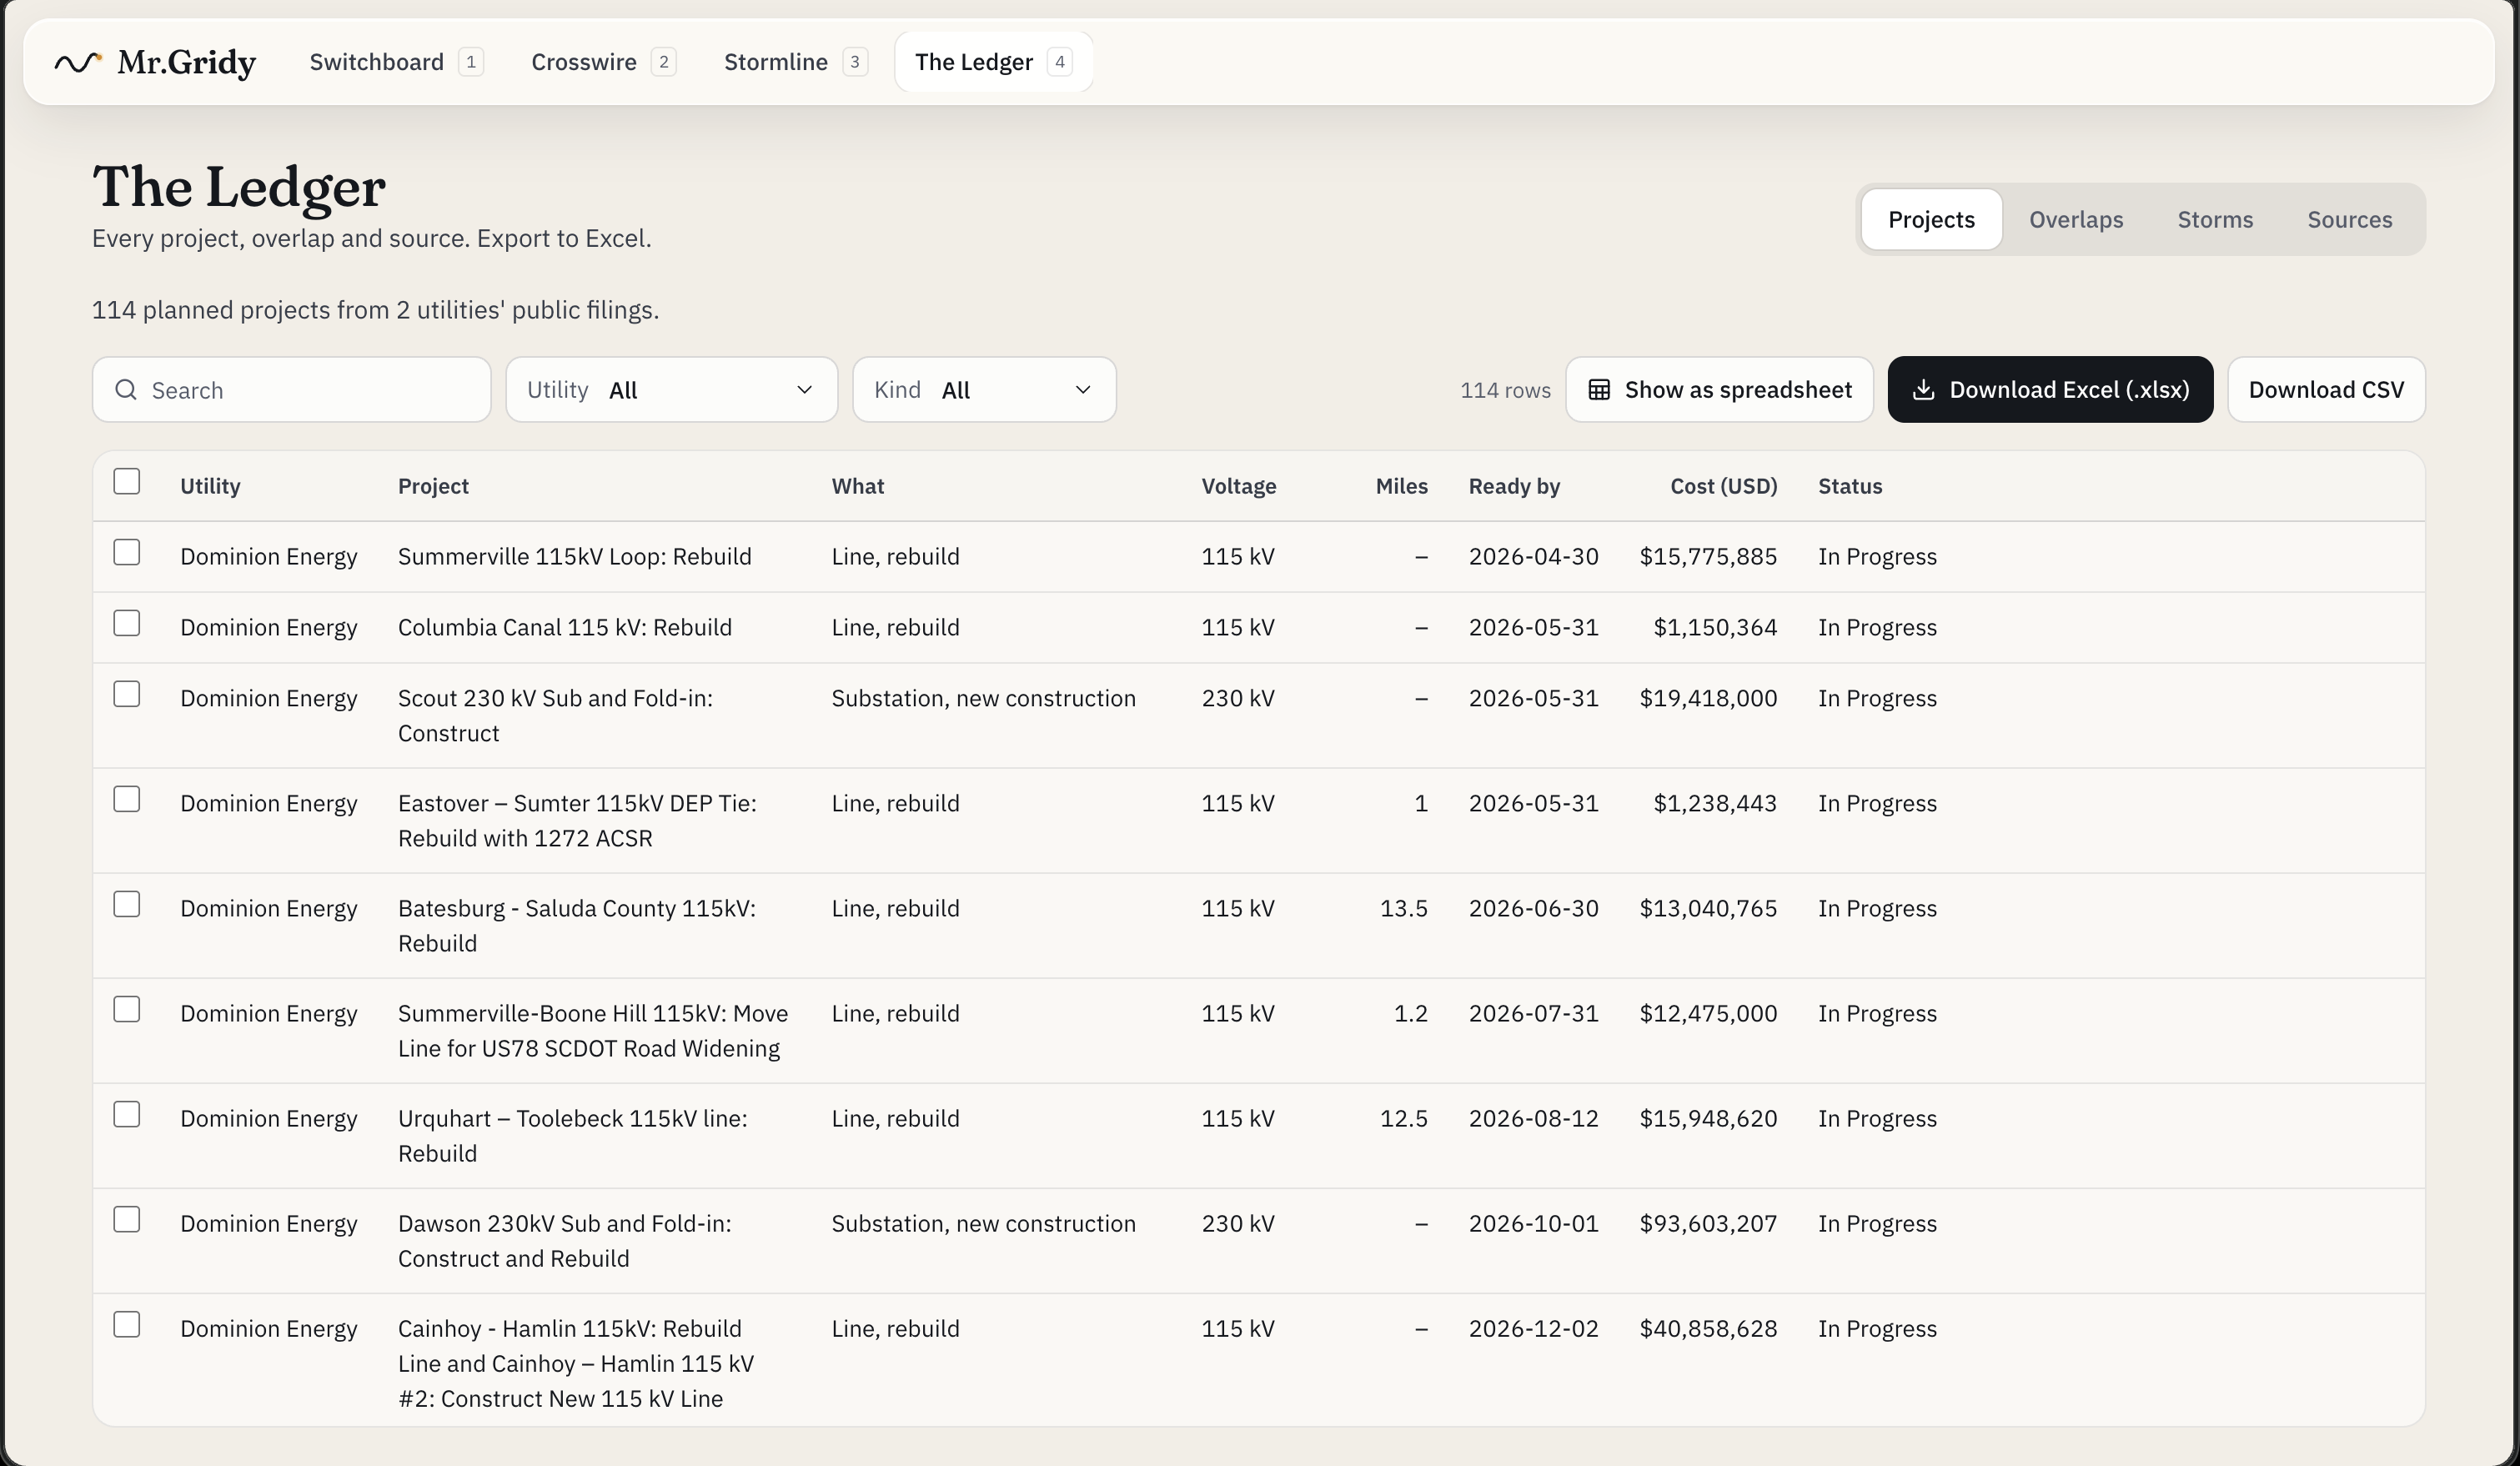
1. Before they build: find where the plans overlap. Mr.Gridy reads both utilities' public construction plans and puts every project on one map and one calendar. It then flags projects that are close together, being built at the same time, or both. For Dominion and Georgia Power it compared 114 real projects and found 50 overlaps, including 2 power lines that actually cross. For each one, it tells you what the two companies could share, like crews, a staging yard or permits, and roughly how much that saves.
You aren't stuck with our two utilities, either. Type in any utility's name and our AI agent finds its public plan, reads it and maps every project in about a minute.
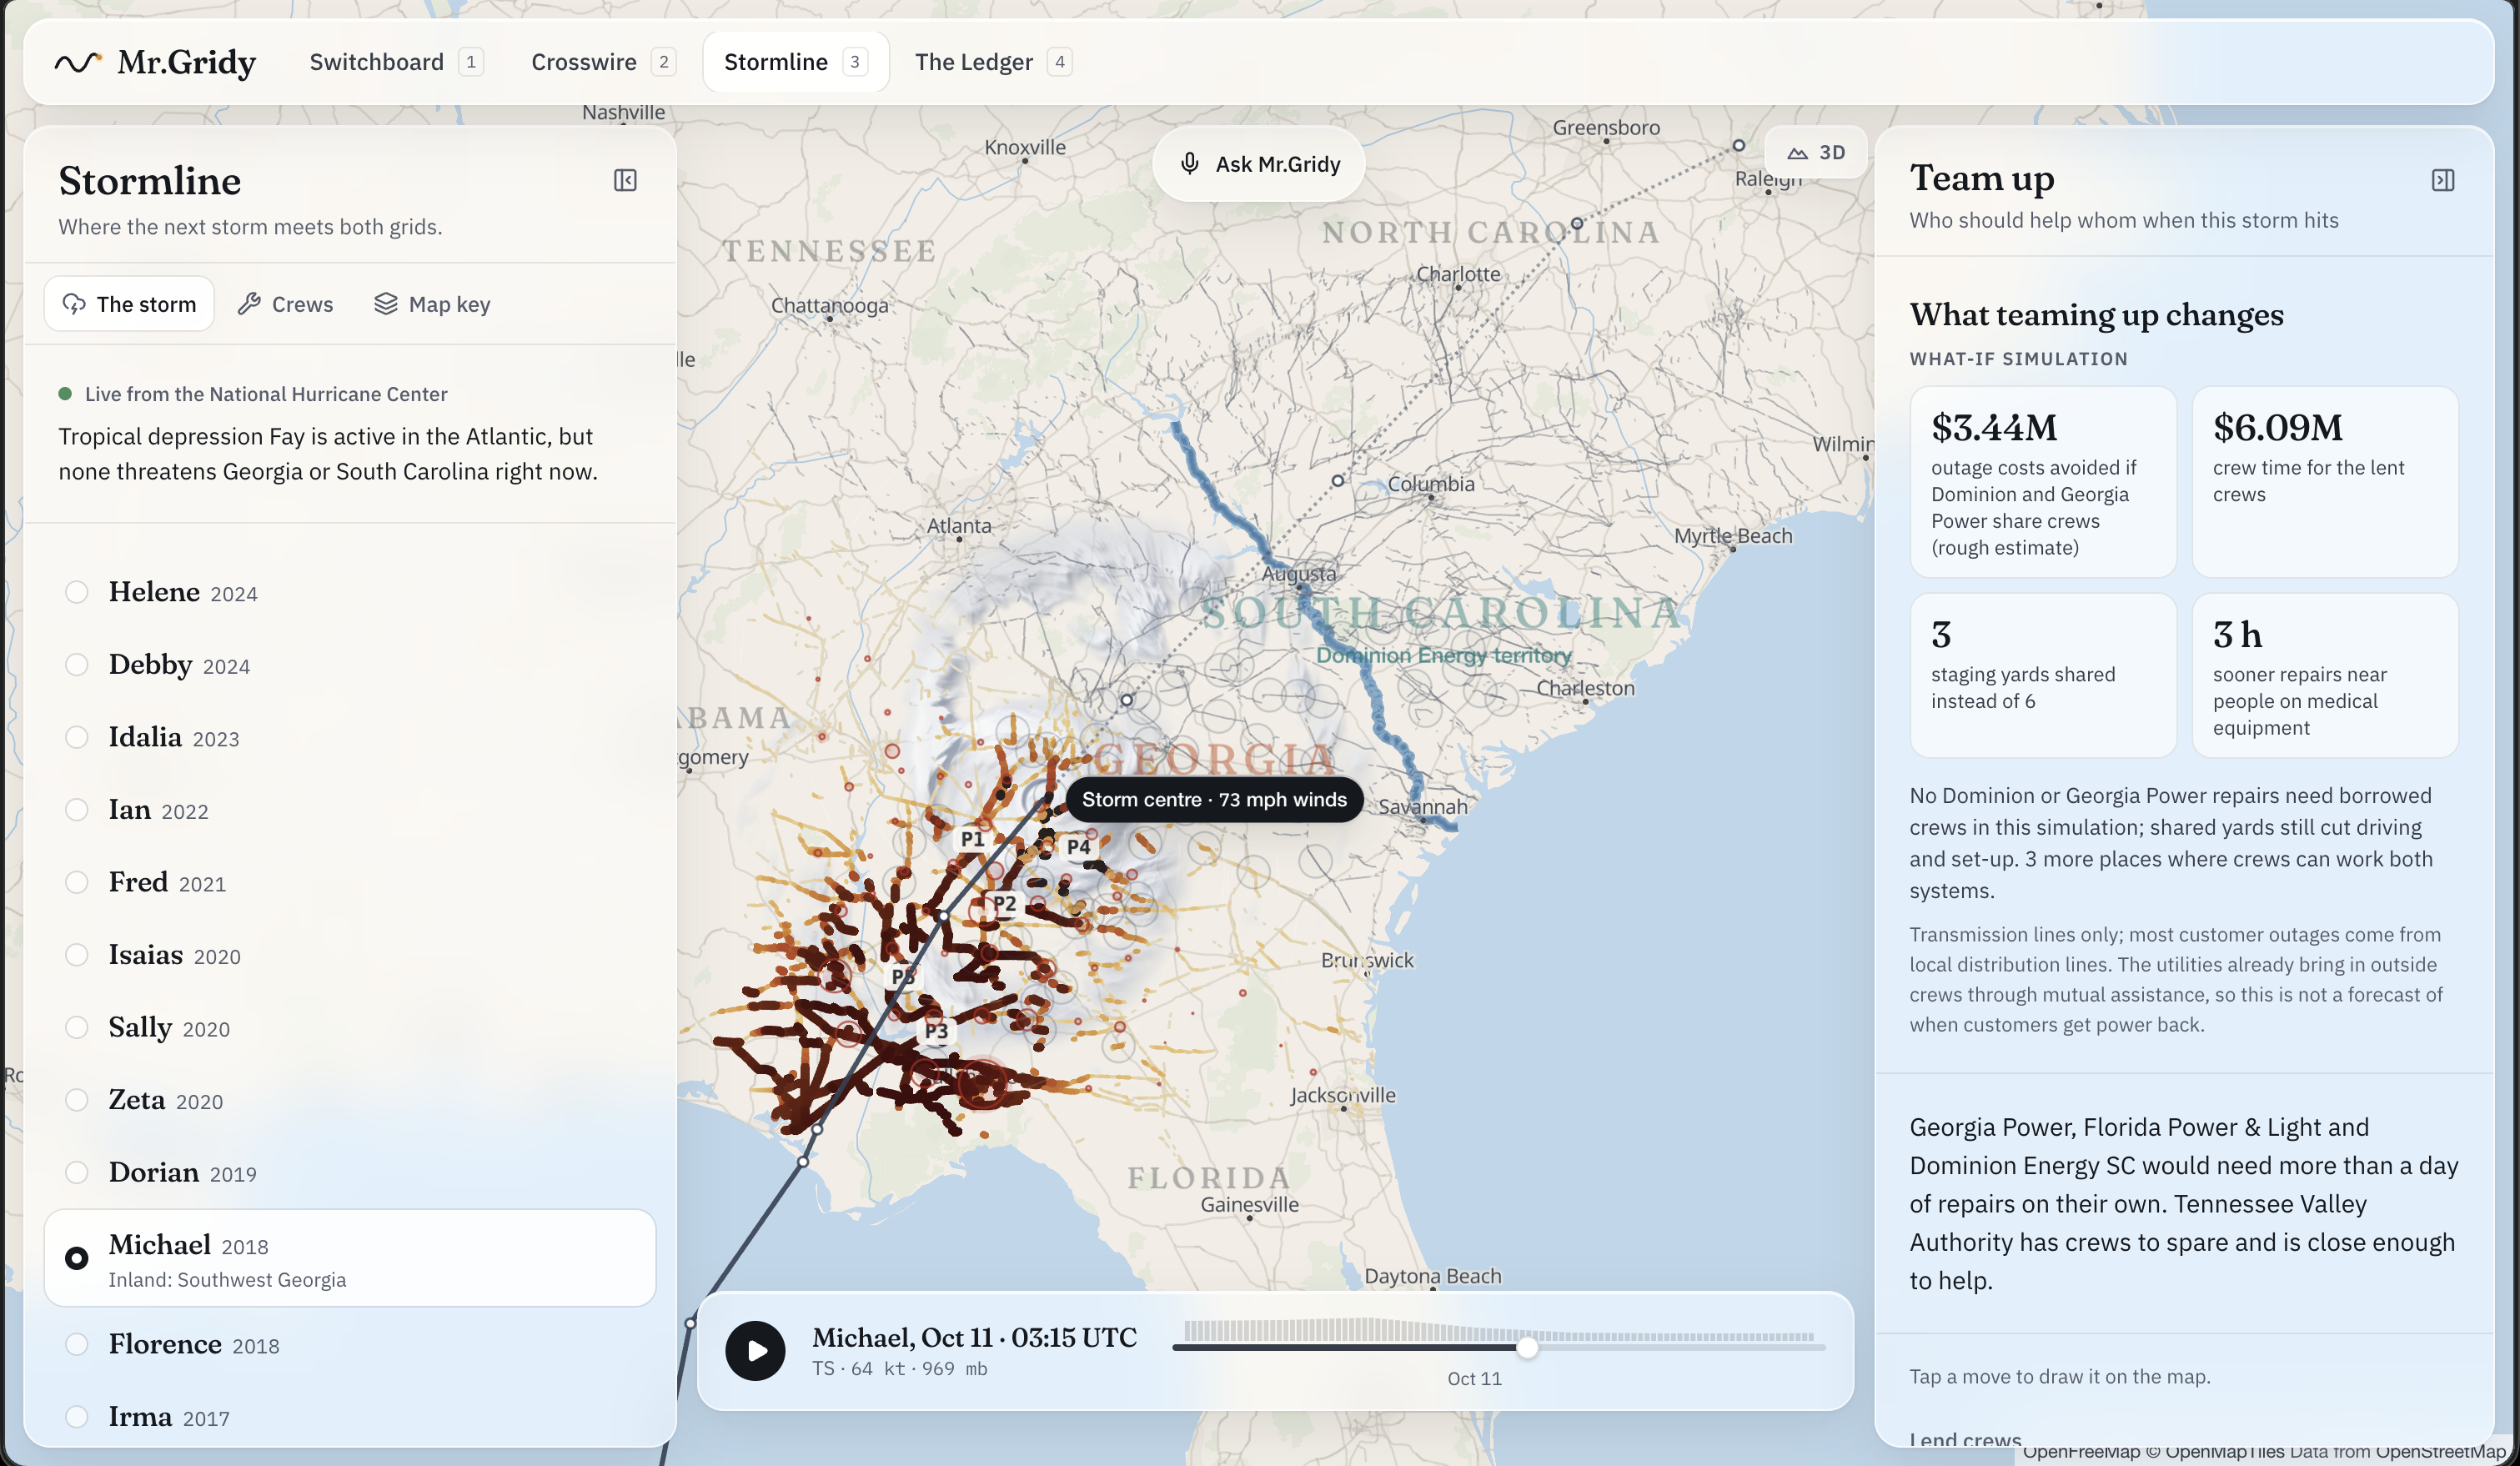
2. When a hurricane hits: predict the damage and plan the response. Mr.Gridy simulates a storm crossing both grids, running 10,000 simulations on a GPU to predict which power lines are likely to break. It then groups the damage into repair zones, prioritizes the areas with the most vulnerable residents, picks shared staging yards, and tells each company who should lend crews to whom. We replayed 14 real hurricanes to test it. In Hurricane Matthew, sharing crews would have brought power back about 50 hours sooner.
On top of both, there's Ask Mr.Gridy, a voice agent. Just ask for what you want to see, and Mr.Gridy moves the map, opens the right panels and answers from the real data.
Why it matters for the next storm
Mr.Gridy already watches the National Hurricane Center live, and it warns you when a storm heads toward the region. The next step is to run the simulation on the forecast track days before landfall. That would give utilities a head start: they'd know which lines are likely to fail, where to stage trucks and crews, and who should help whom, all before the wind picks up.
Pre-positioned crews mean the lights come back on faster. Sharing crews, yards and equipment instead of paying for everything twice keeps costs down, and those savings keep electricity prices from climbing for everyone.
How we built it
- We wrote a Python pipeline that reads each utility's plan PDFs. It places each project on the map along real OpenStreetMap power lines, then measures how close each pair of projects gets and how many months they overlap.
- Our hurricane model runs in PyTorch on a GPU. It uses real NOAA storm tracks and published engineering data on when poles, towers and trees fail in high winds.
- Gemini powers our agents. Given just a utility's name, it searches the web for the public plan, reads the PDF and pulls out every project in a fixed format. It also hunts down grant programs that could fund shared work. Every fact the agents return is pulled from real data and linked back to its source, down to the page number. Nothing is made up.
- ElevenLabs runs the voice agent, which has 28 tools that control the app. It also reads storm briefings to crews in English and Spanish.
- Tiger Data stores hour-by-hour outage history from the Department of Energy and powers the live outage charts.
- DigitalOcean App Platform hosts the Next.js app and redeploys it on every push.
Challenges we ran into
The hurricane model was the hardest part. There's no public map of which power lines break in a storm, so we had to build one. For each storm, we worked out how strong the wind gets at every point along the track, and how that changes once the storm moves over land. Then we had to figure out what that wind actually does to a line. A wooden pole, a steel tower and a tree falling onto the wires all fail differently, so we had to research a lot to find a failure curve for each.
Accomplishments that we're proud of
- It gets the plans right. Mr.Gridy parses messy utility filings into clean projects on a map.
- The hurricane model holds up. Tested on storms it had never seen, it predicted outages better than a wind-only model for 9 of the 14 storms. The app shows the real outages hour by hour next to the model, so anyone can see how close it gets.
- Every number can be checked. Our Gemini agent researches, finds the plans, parses them and searches for grants. Every number in the app links back to its public source, and the whole thing exports to Excel in one click.
- It covers the whole cycle, from planning new lines years ahead to getting the power back on after a storm.
What we learned
- The data utilities need to coordinate is already public. It just had never been put on one map.
- How to build an AI agent that researches, reads documents and brings back correct data. We learned to have it search the web for sources, pull the facts into a structured format, and back every fact with citation to the original source.
- Timing matters as much as distance. Plans slip often, so overlaps need to be re-checked every time a new plan comes out.
What's next
- Run the storm model on live forecasts so crews can move before landfall.
- Send automatic alerts when a new plan creates an overlap.
- Cover every region in the U.S., not just the Southeast.
Built With
- digitalocean
- elevenlabs
- gemini
- nextjs
- openstreetmap
- python
- pytorch
- tigerdata
- typescript


Log in or sign up for Devpost to join the conversation.