-
-
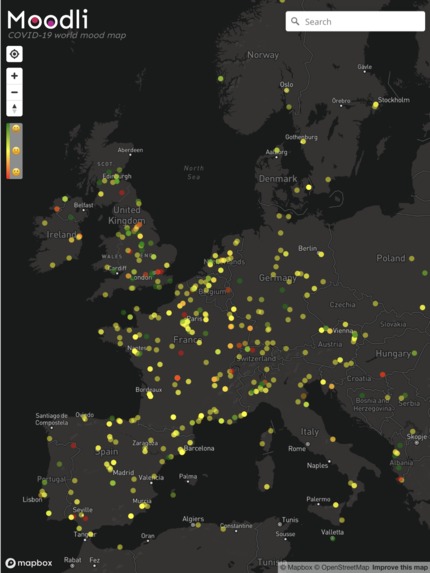
Map with moods
-

Team mood
-

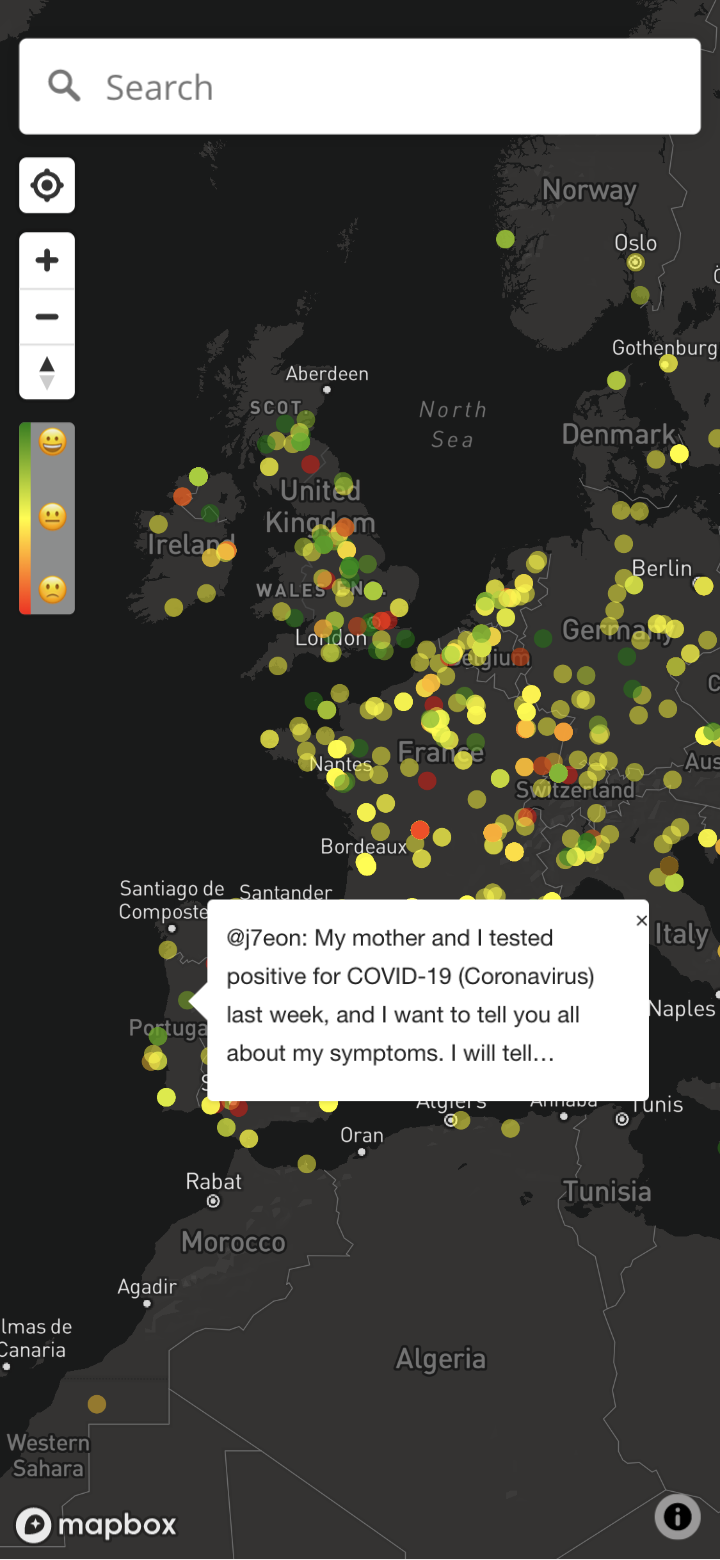
Map with moods on mobile
-

Who are we?


Inspiration
Emotions are triggered by the conscious or unconscious perception of an event or situation and lead to a change of the physiological and psychological state as well as social behavior. In the uncertain and unpredictable times of Corona, it is important to maintain the mental and physical well-being of the population and a solitary spirit.
What it does
The goal of the project is to use Twitter tweets to identify the emotional state of the population and the causing factors. This enables authorities to intervene in a targeted manner (communication, actions to be taken, etc).
How we built it
We build up a pipeline starting at getting live data from Twitter. The next step is to find the location for each Tweet and do pre-processing of the content in JavaScript. Which leads to our next step the sentiment analysis, where a sentiment model, implemented in python, predicts a sentiment of the content. Each Tweet with its sentiment is then visualized on our world map.
Challenges we ran into
We are processing a lot of data. That's why we were not able to use any API, because we blast the free contingent (quota) in minutes.
Since Twitter is not providing the coordinates of a tweet, we had to write a script that extracts the given location data of each tweet (which can be something like Mars, next to you, or my home) and try to match them with their coordinates using an offline database.
Accomplishments that we are proud of
We are proud of making the whole web app working in less than 72 hours, including the daunting work of text analysis and coordinate correlation. Our website is available for the world and everyone can profit from the data provided.
What we learned
- Getting things into production is possible within 72 hours.
- APIs are great, but they won't be for free if you really want to get something done.
- NPL is not as scary as we thought.
- People around the world are having negative emotion about Covid19.
What's next for Moodli
Due to latency problem, we can only render 1000 data points at a time. Therefore, we would like to improve on it and be able to render more points in the future.
We want to expand the data used for visualization. So far we can only use English Tweets, because our focus was to get a prototype running. In the next steps other languages can be included, next to getting data from other sources like Facebook,Instagram, and etc.


Log in or sign up for Devpost to join the conversation.