-
-
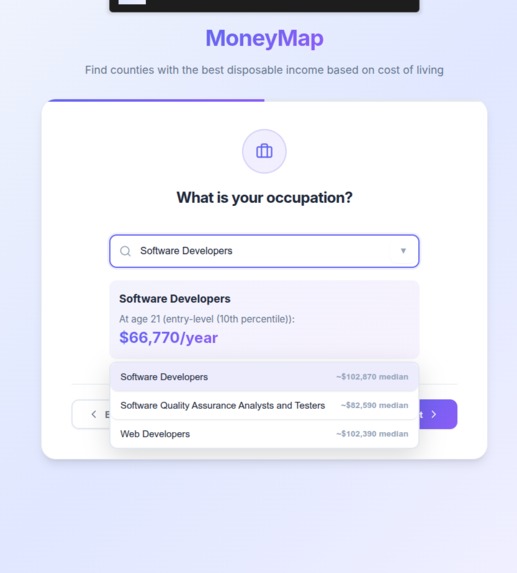
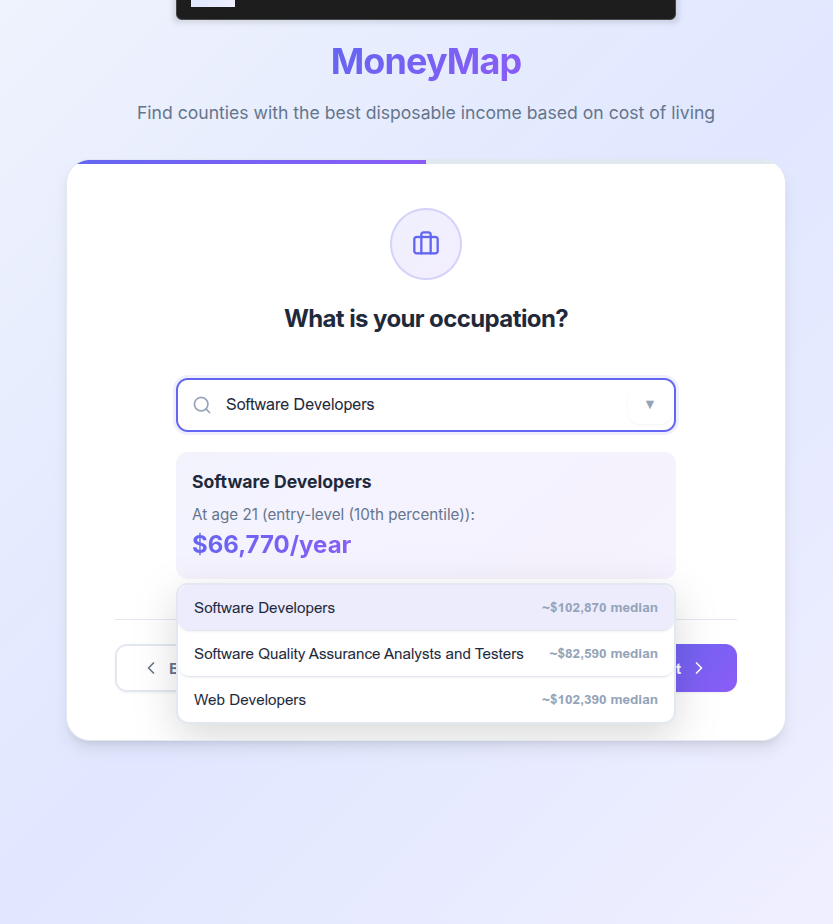
The fuzzy-search occupation selector
-
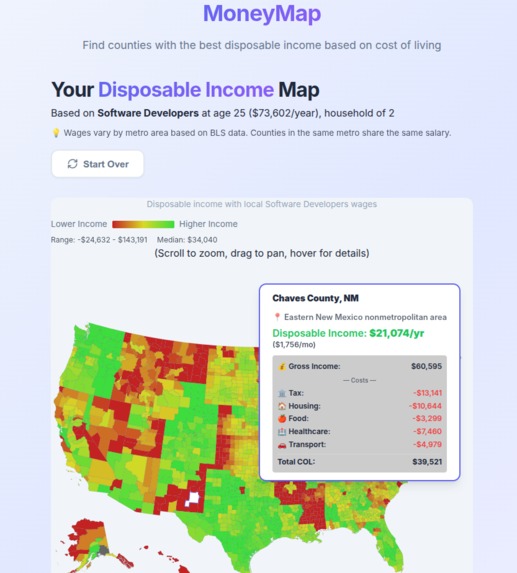
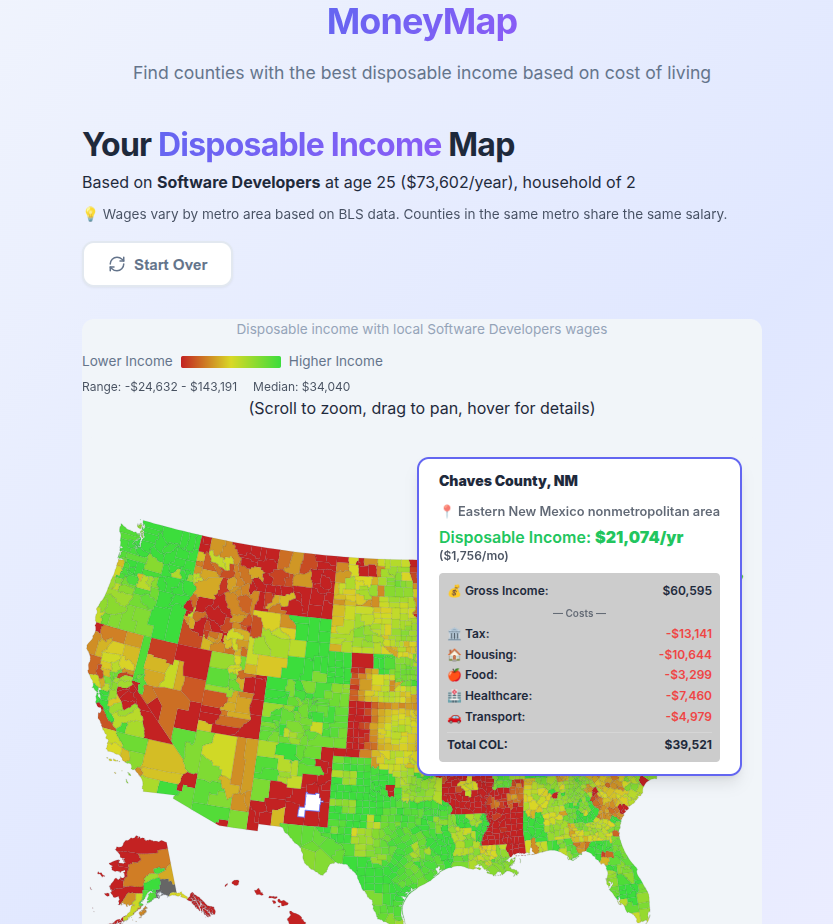
The final map visualization
Inspiration
Managing major life decisions like buying a home or planning a vacation often feels overwhelming, especially when financial tools are fragmented, generic, or disconnected from real constraints like salary, commuting distance, and lifestyle goals. We took these factors and made them into an interactive map for people to see how much disposable income they would have in different counties of the US.
What it does
🗺️ Interactive Map Interface: Visualizes recommendations geographically so users can compare neighborhoods, prices, and travel time at a glance.
💡 Personalized Insights: Recommendations adapt dynamically to user inputs, making financial planning feel practical instead of abstract.
How we built it
Frontend: A React-based interactive UI with map visualizations and real-time filtering.
Backend: A Python-based script that processes user inputs and runs affordability and distance calculations.
Data Layer: Public datasets covering housing prices, income statistics, geographic boundaries, and travel-related costs.
Mapping & Visualization: County-level and regional data layered onto maps to make recommendations immediately understandable.
Challenges we ran into
🧩 Data integration: Combining datasets with different granularities (county, city, region) required careful normalization. Locally storing data for performance was also difficult.
⏱️ Performance tradeoffs: Rendering large geographic datasets while keeping the interface responsive was non-trivial.
🎯 Balancing simplicity and realism: We had to decide how complex recommendations should be without overwhelming users.
🔄 Edge cases: Accounting for extreme salaries, rural areas, and unusual commute constraints took extra thought.
Accomplishments that we're proud of
Built a fully interactive, map-based financial advisor within a short hackathon timeframe.
Successfully connected financial logic with geographic visualization, making abstract numbers tangible.
Created a foundation that could realistically scale into a real consumer product.
What we learned
Finding good data is difficult :( But EXTREMELEY IMPORTANT :)))
What's next for MoneyMap
Having even more factors that affect the interactive map's data, such as retirement, loan payments, etc.

Log in or sign up for Devpost to join the conversation.