-
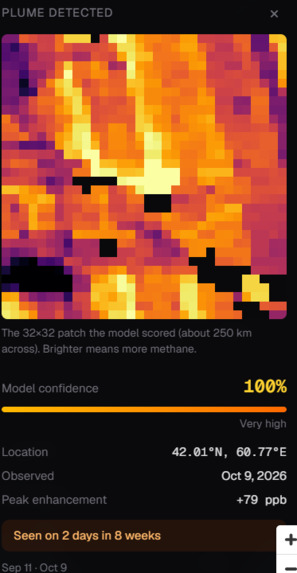
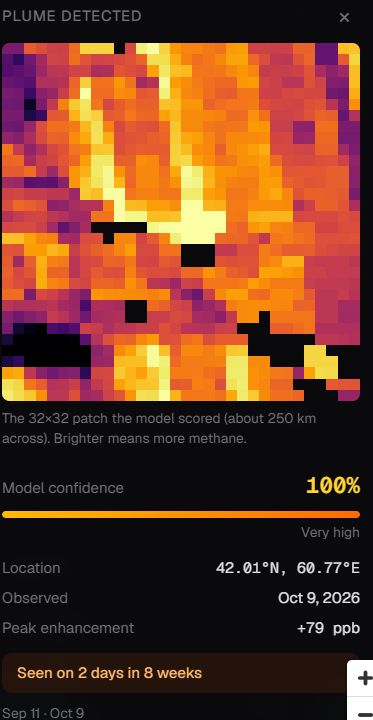
Methane Plume Details
-
-
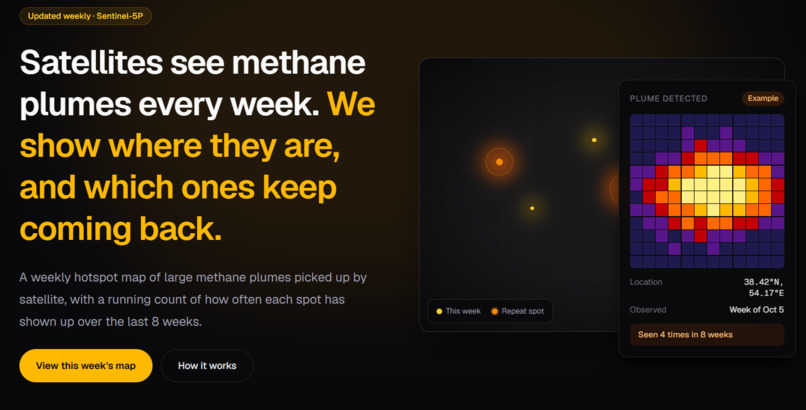
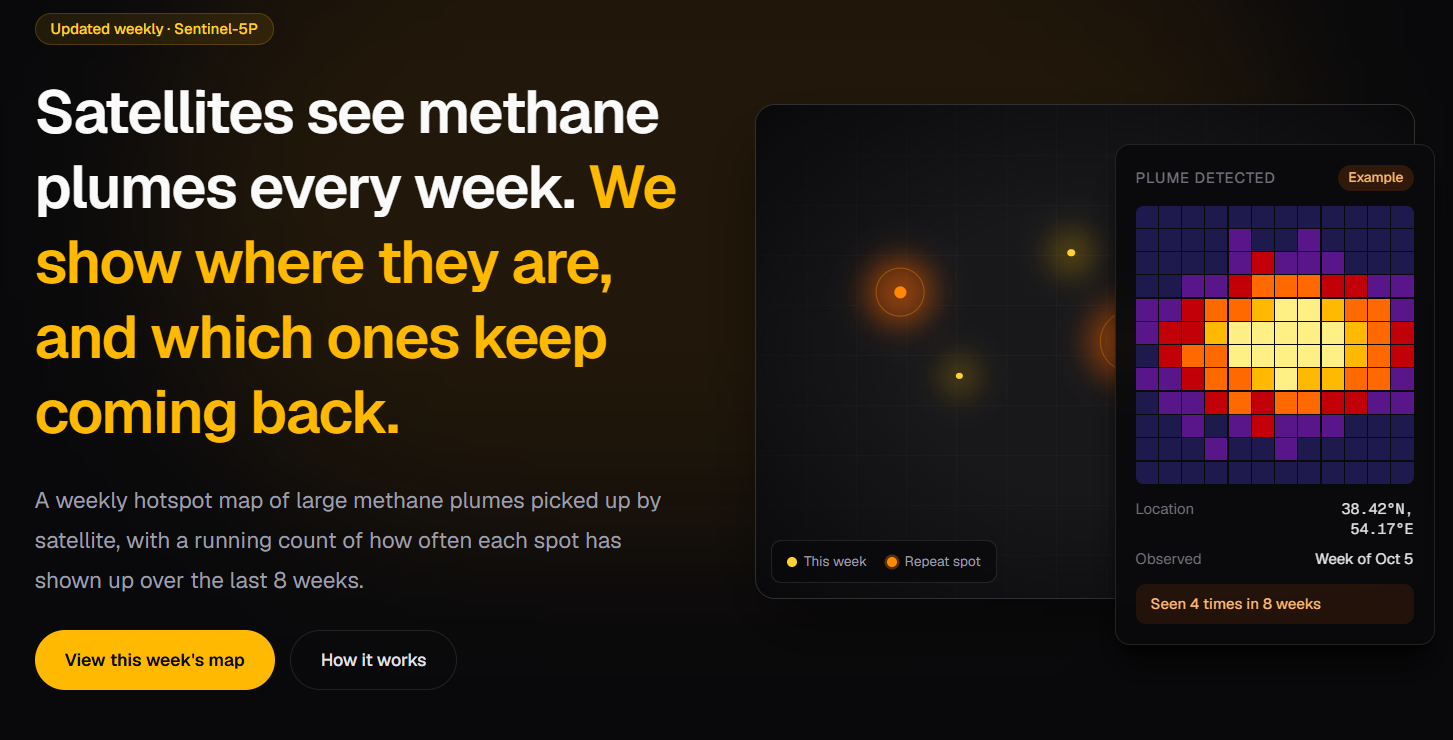
Landing Page
-
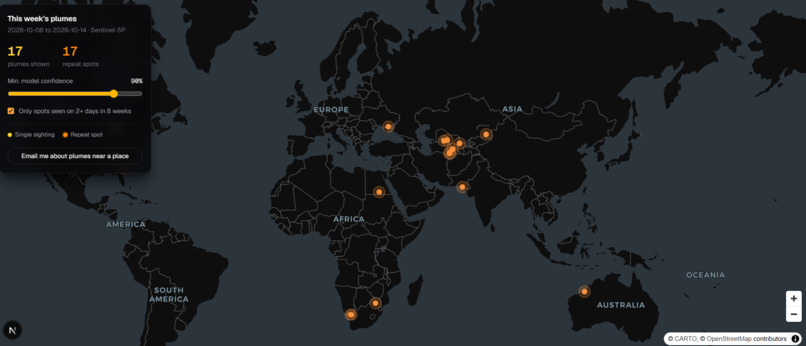
Interactive Map
-
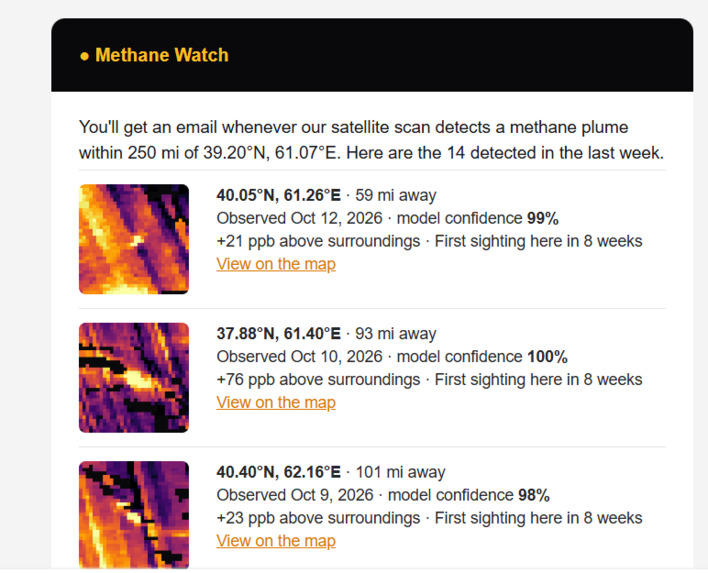
Weekly Email Digest
Inspiration
Methane has no colour and no smell. A gas well can leak for months and the family living a mile away will never know. Neither will the regulator, the journalist, or the town council.
That should be impossible to ignore, because methane traps more than 80 times as much heat as CO₂ over its first 20 years in the air. It is behind roughly a third of the warming we have already felt. Every heatwave, every failed harvest, every wildfire season that starts earlier than the last has some methane in it.
The cruel part is that we can already see it. Sentinel-5P, a European satellite, photographs the methane over the whole planet every day, and the data is free. But it sits in scientific archives and research CSVs that only specialists can read. The leaks are being recorded and almost nobody is looking at them.
We kept thinking about one question: what if anyone could look up and see what the satellites see?
What it does
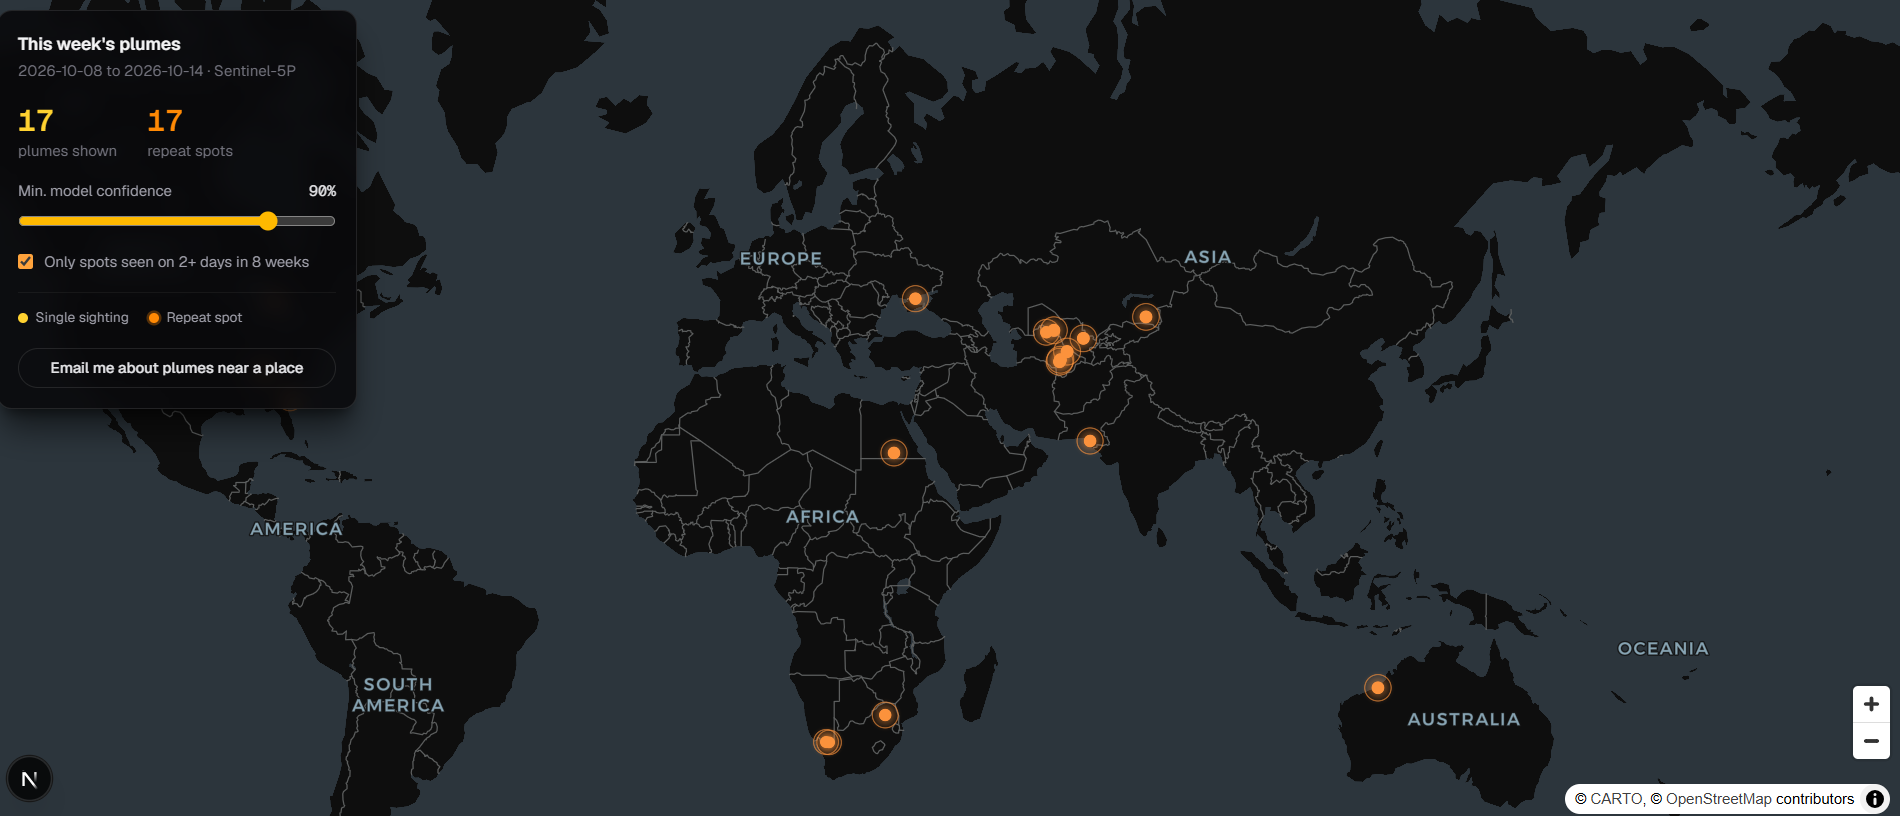
MethaneWatch turns raw satellite data into a map that anyone can read in ten seconds.
- A weekly hotspot map. Every large methane plume detected from orbit, pinned to where it happened.
- "Seen 4 times in 8 weeks." A one-off leak is an accident. A leak that comes back week after week is a choice. MethaneWatch tracks how often each spot reappears, so the chronic offenders stop hiding among one-off events.
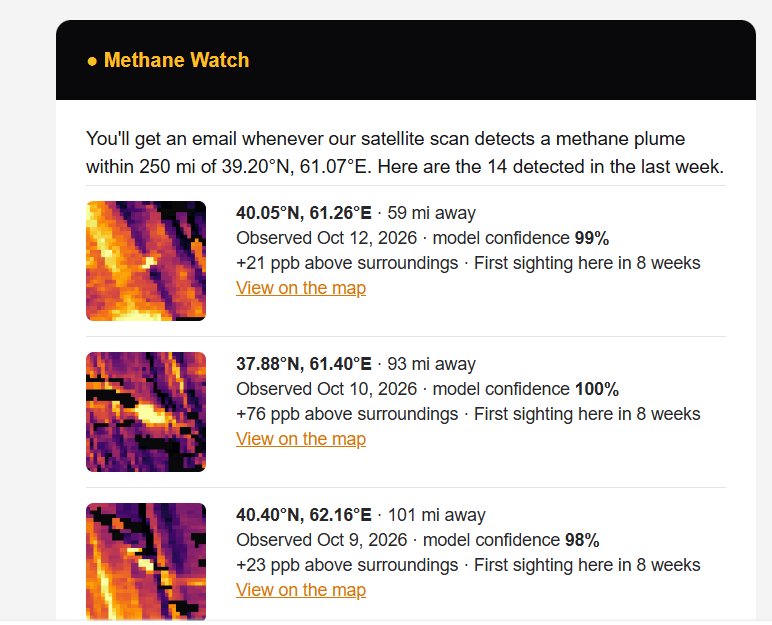
- Alerts for the places you love. Click your hometown, your kid's school, your farm. Pick a radius. MethaneWatch emails you when a plume is detected inside that circle. For the first time, people who live near these sites can find out without waiting for anyone's permission.
- Honest by design. Every page states that the feed runs about a week behind and that locations are approximate (~7 km). We would rather earn trust than overclaim.
How we built it
- Our own detector. We trained a convolutional neural network (PyTorch) on Sentinel-5P methane patches, labelled with SRON's expert plume detections. Its job is to tell a real plume apart from noise, clouds and gaps in the data.
- We scan the whole planet. Through Google Earth Engine we pull a day of global methane readings, cut it into thousands of overlapping 32×32 windows from the Arctic down to the Southern Ocean, and score every one. When a window looks like a plume, we re-centre on its peak and score it again, so each detection is exactly what the model saw.
- FastAPI backend. It serves the detections, model metrics, alert subscriptions and a weekly email digest.
- Next.js frontend. It has an interactive Leaflet map, plume cards with the satellite heatmap of each detection, and repeat-spot tracking that groups detections within 15 km across an 8-week window.
Challenges we ran into
- Space is messy. Clouds, sun glint and gaps between satellite passes leave much of each image blank. We had to teach the model when to say "I don't know" instead of guessing, so we only score windows that are at least half real data.
- One plume, many alarms. A single leak can light up several neighbouring windows. We built merging logic so one leak counts as one detection, not ten.
- Global scale on hackathon time. Scanning the planet means hundreds of Earth Engine requests that hit quotas and timeouts. We added retries and parallel tile fetching to make it hold up.
- Telling the truth. The hardest design problem wasn't technical. A map of red dots can easily frighten people with things that aren't true. We worked to make every number on screen traceable to the data, and every limitation visible.
Accomplishments that we're proud of
- Our detector scored 88.6% precision, 85.5% recall, an F1 of 0.870 and a ROC-AUC of 0.944 on 646 patches it never saw during training. When it says "plume", it is usually right.
- It works end to end, from satellite pixels to a map pin to an email in someone's inbox.
- Our repeat-spot logic matched a brute-force recount exactly, with zero mismatches on live data. If MethaneWatch says a spot keeps coming back, it does.
- Above all, we made something a non-scientist can open and understand at once.
What we learned
- Climate data isn't scarce. Attention is. The most powerful thing we built wasn't the model. It was the sentence "Seen 4 times in 8 weeks."
- Honesty builds trust. Stating our limits openly made the product stronger, not weaker.
- Satellite data is wonderful and messy, and most of the real work is in the gaps.
What's next for MethaneWatch
Behind every pin on our map there may be a community breathing what leaks along with the methane, and a fix that is often fast and cheap once someone knows where to look. We want to be the ones who make sure someone looks.
- Closer to real time. Shrink the week-long lag so alerts arrive while a leak can still be stopped.
- Sharper locations. Combine high-resolution satellites to go from "within 7 km" to the exact facility.
- An AI analyst. Plain-language weekly briefs and per-plume explanations grounded strictly in the data. We've built it, and it is waiting to go live.
- Tools for the people who can act. Exports and reports for journalists, local governments and regulators, so a recurring dot on a map becomes a question someone has to answer.
The atmosphere keeps a record of every leak. MethaneWatch makes sure people can read it.
Built With
- fastapi
- google-earth
- next
- sentinel
- torch

Log in or sign up for Devpost to join the conversation.