-
-
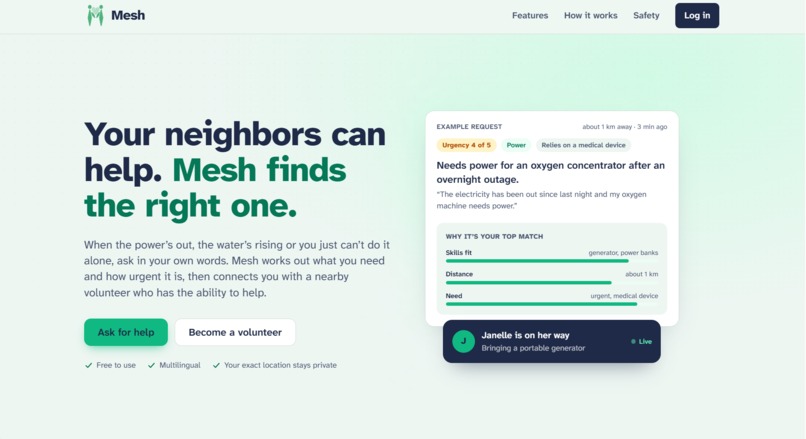
Landing page
-
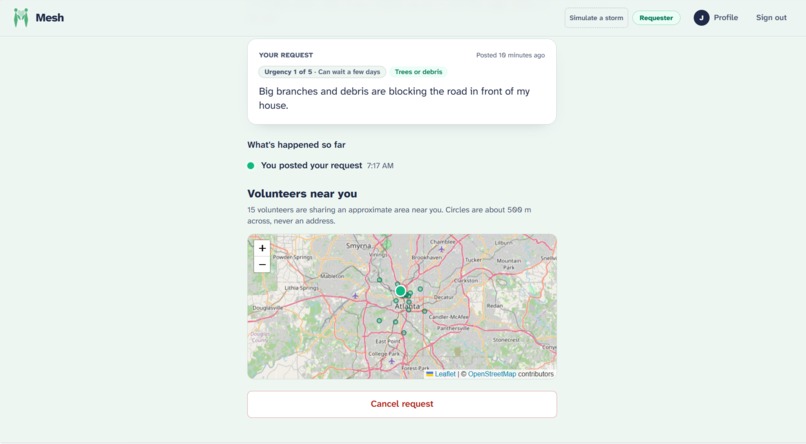
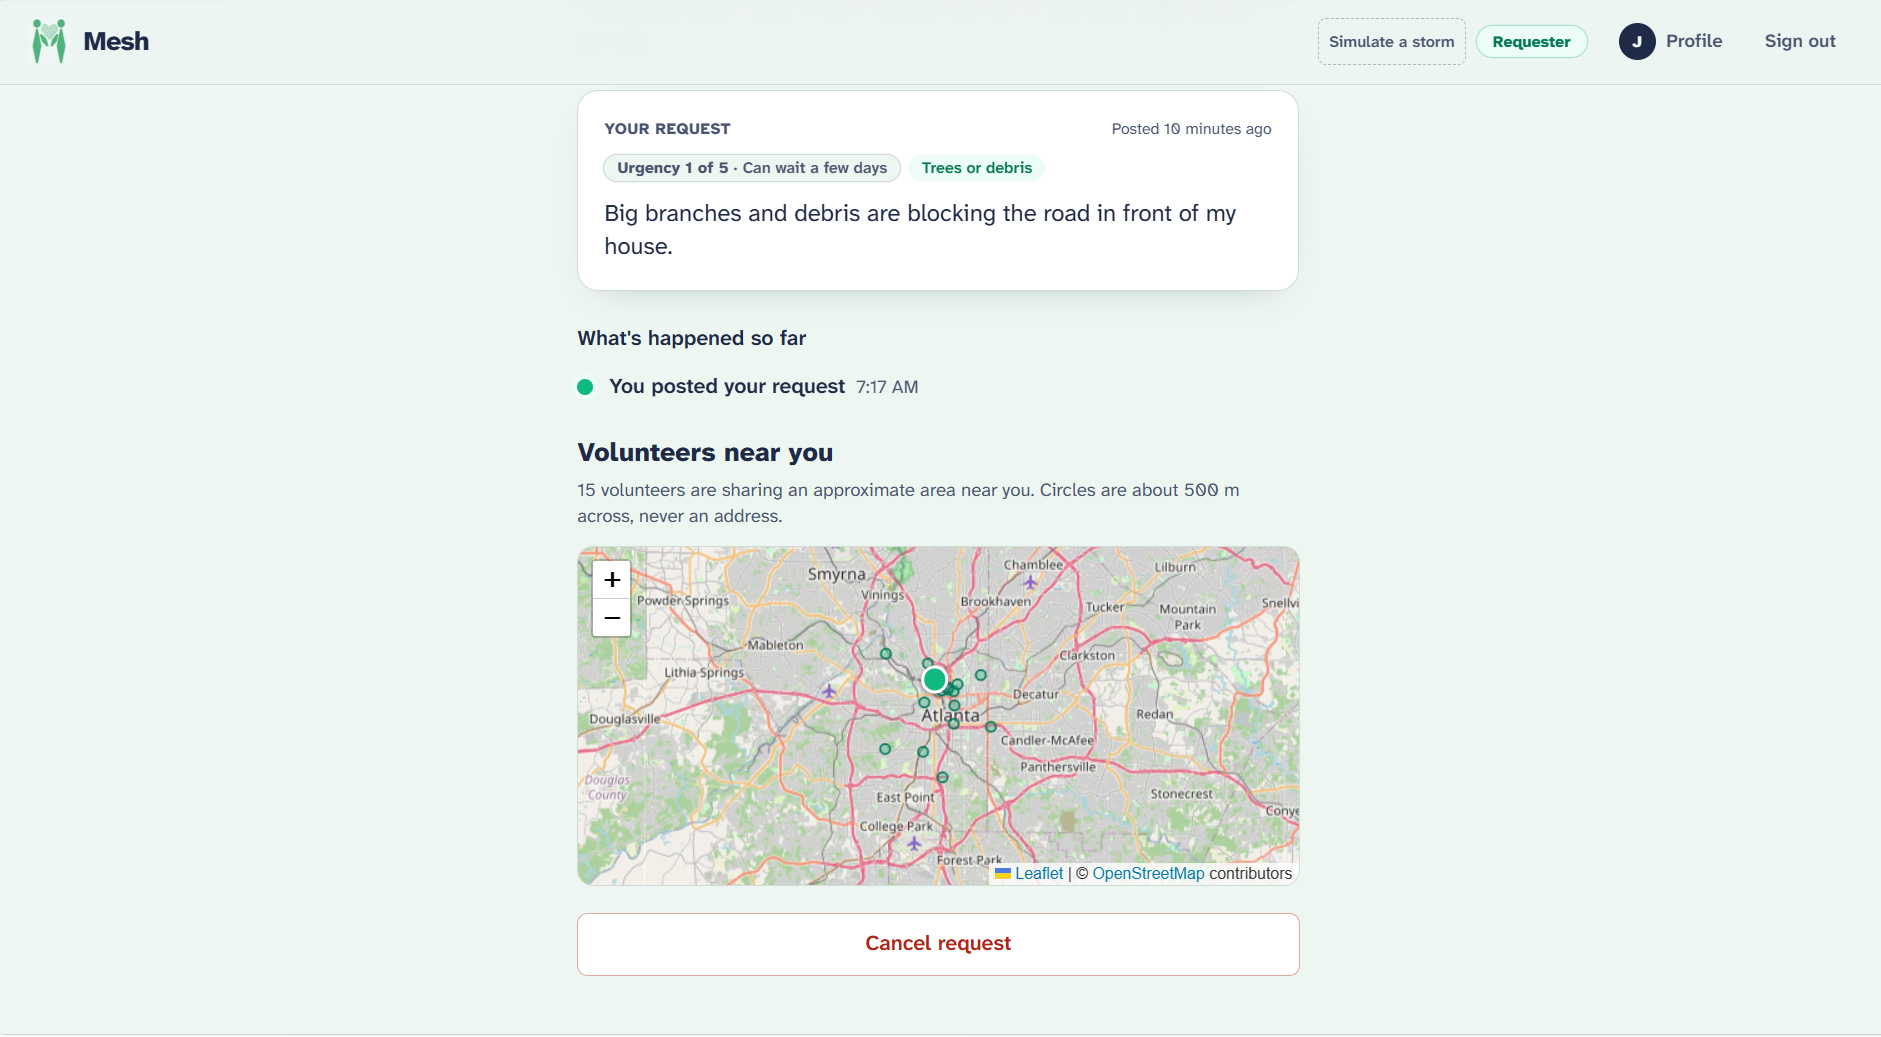
Requestee's UI
-
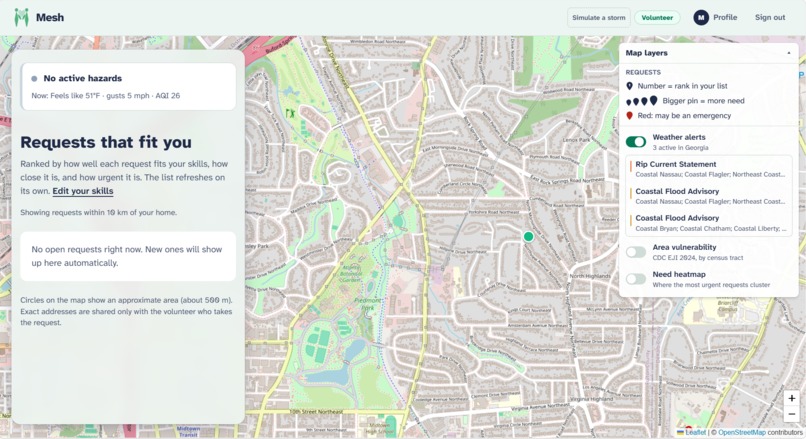
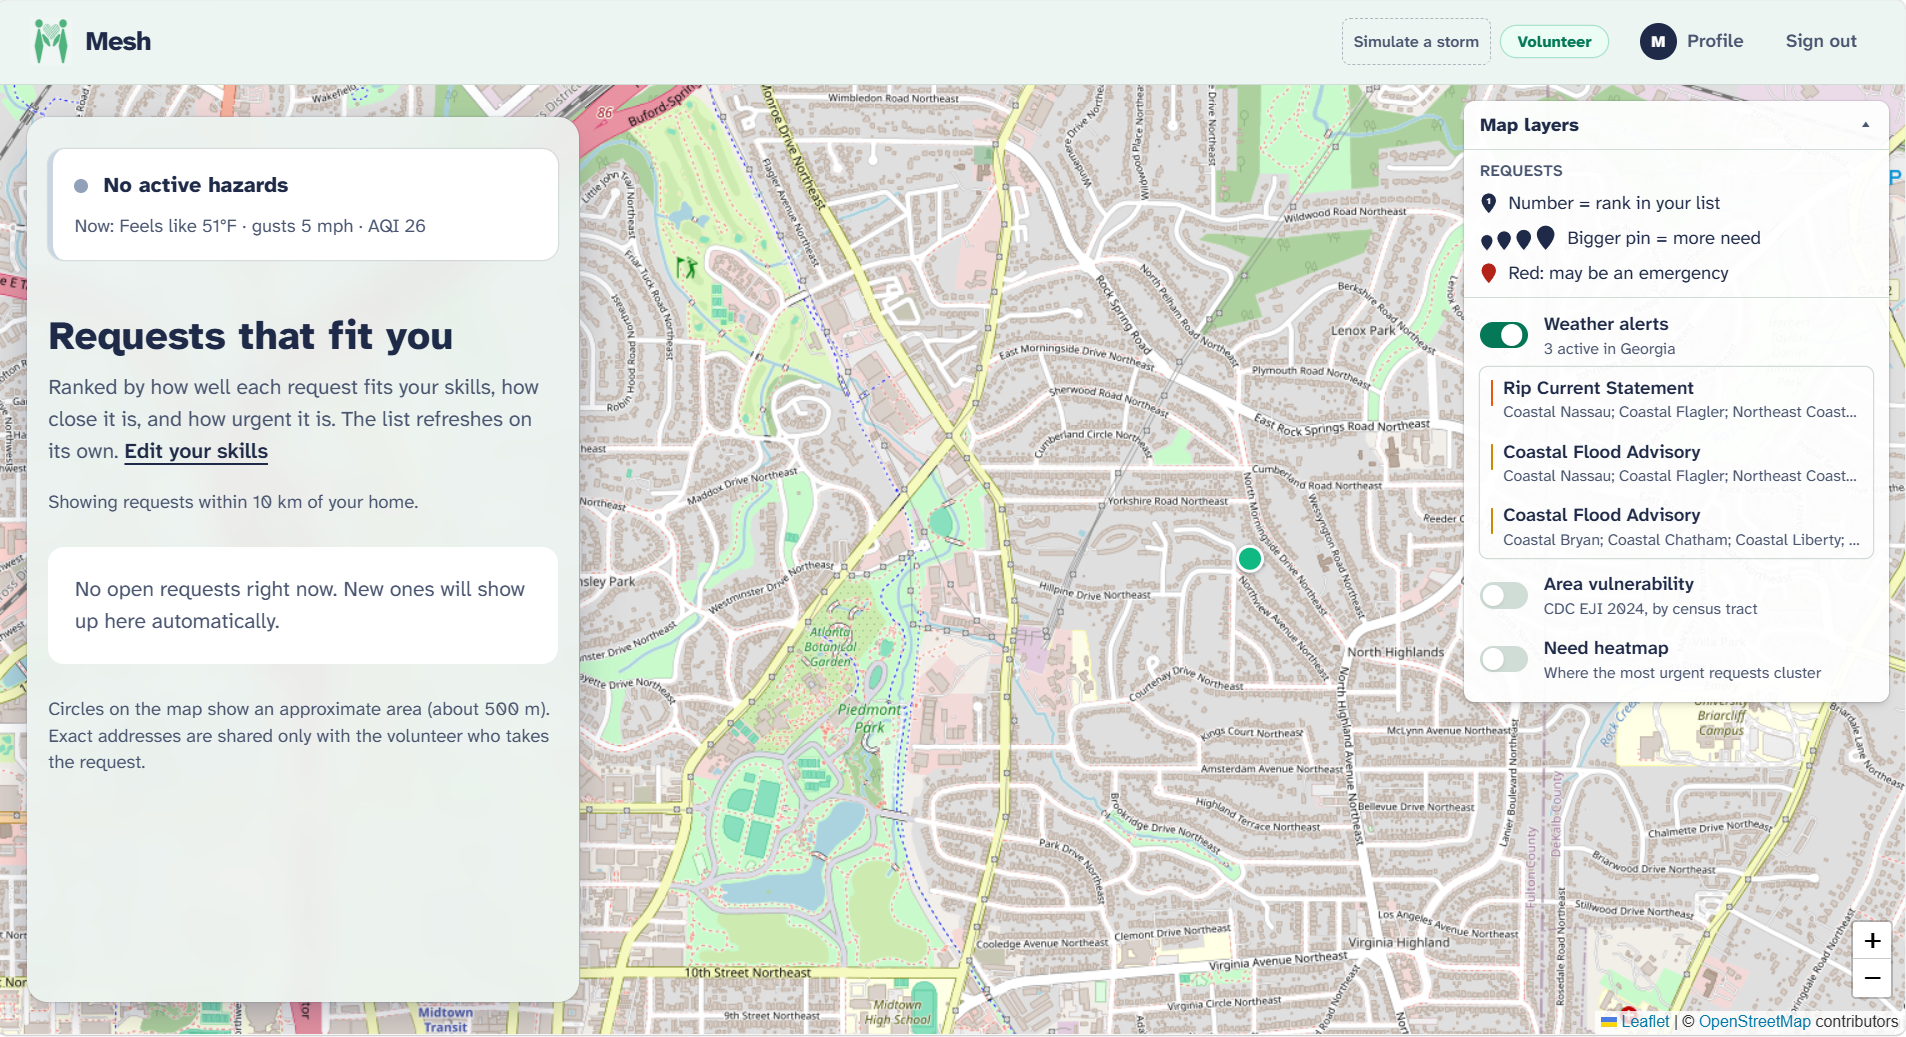
Volunteer's UI
Inspiration
When a hurricane or severe storm hits Georgia, the help people need is usually already on or down the street. One neighbor could have a chainsaw, another having generator, and someone down the road is a nurse. But the person with a tree on their power line has no way to find them, and the neighbor with the chainsaw doesn't know who needs it. Local resources exist. Coordination doesn't.
We started this weekend building a climate-vulnerability map on top of the CDC Environmental Justice Index. Halfway through, we realized a map only visualizes where people are vulnerable. It doesn't help organize action for anyone. So, we piloted Mesh; a way to connect the people who need help with the neighbors who can give it, and to use vulnerability and hazard data to decide who gets help first.
What it does
Mesh is a mobile-first web app for weather-disaster relief. It works like a delivery app, but for help.
- Requesters describe what they need in plain language, like "tree on my power line, I use an oxygen machine."
- AI triage (Meta's Muse Spark) turns that into structured data: category, urgency (1–5), flags like
medical_device, and a short summary. - Volunteers set up a profile with their skills, resources, and what they can offer. Mesh ranks open requests by how well each one fits what that volunteer can actually do.
- A volunteer claims a request, which opens a private chat with the requester. Once claimed, both sides can share live location with each other and no one else.
- Every request gets a priority score so the most urgent needs rise to the top. It's a weighted mix of four things:
$$ \text{priority} = \text{urgency} + \text{weather hazard} + \text{neighborhood vulnerability} + \text{time waiting} $$
Urgency comes from AI triage, weather hazard from live NWS alerts and Open-Meteo, vulnerability from the CDC's Environmental Justice Index, and time waiting keeps older requests from being forgotten. The weights are our best guess, not tuned on real data. We weighted urgency highest because it's the most direct signal of need, but the exact numbers are arbitrary starting points that a community organization could adjust. Each request shows a "why this rank?" breakdown, so no score is a black box.
- Safety first: English and Spanish emergency phrases ("can't breathe," "no puedo respirar," "trapped") trigger a full-screen Call 911 screen before anything is submitted. Mesh is not a 911 replacement.
- Privacy: only the claiming volunteer sees a requester's exact location. Everyone else sees a point fuzzed of roughly ~300–500 m, seeded with an HMAC so it can't be reverse-engineered.
How we built it
- Frontend: Vite + React + TypeScript, with Leaflet + OpenStreetMap for maps.
- Backend: FastAPI (Python) with Google sign-in and JWT cookies.
- AI: Muse Spark (
muse-spark-1.3) does two jobs. It triages requests into structured JSON, and it rewrites both requests and volunteer profiles into short lists of needs and capabilities before we embed them. The Meta Model API has no embeddings endpoint, so we embed locally withall-MiniLM-L6-v2via fastembed (384 dimensions, no PyTorch, so it fits a small VM). - Matching: MongoDB Atlas Vector Search (
$vectorSearch, cosine similarity) ranks open requests against each volunteer's profile vector. When Atlas Search isn't available, it falls back to cosine similarity in Python. - Data: CDC/ATSDR EJI 2024 ranks for every Georgia census tract, the Census geocoder, NWS alerts, and Open-Meteo forecasts and air quality.
- Deploy: Docker Compose + Caddy on Vultr, served at mesh-together.tech.
A design rule we held to is that the LLM never produces a score. It only rewrites text and suggests an urgency. Keyword rules set an urgency floor, and the AI can raise it but never lower it. Every number in a ranking comes from code.
Challenges we ran into
- Pivoting mid-hackathon. We threw away our first idea (a vulnerability map) and kept its best part, the EJI data, as one input to the priority score.
- No embeddings endpoint. The Meta Model API doesn't offer embeddings, so we moved to a local model and picked fastembed to stay within Vultr's smallest VM.
- Spark latency. Spark reasons before it answers. At the default effort, a triage call took 10–25 s, and about 875 of 915 output tokens were reasoning. Setting
reasoning_effort: minimalwith JSON output got it to about 2 s with the same or better labels. We also moved embedding into a background task, so saving a profile or posting a request returns immediately. - Privacy vs. usefulness. Volunteers need to know roughly where a request is, but exact addresses of vulnerable people shouldn't be visible to everyone. Deterministic, HMAC-seeded location fuzzing and a viewer-aware serializer solved that.
Accomplishments that we're proud of
- An end-to-end flow that works: request → AI triage → priority score → matching → claim → private chat → live location.
- A priority score anyone can audit, with every factor, weight, and data source shown.
- Real public data doing real work: EJI tract ranks and live NWS/Open-Meteo hazards feed the ranking directly.
- Safety defaults we'd stand behind: the 911 check, the urgency floor the AI can't lower, and location privacy.
What we learned
- AI is most trustworthy when it has a narrow job. Letting Spark rewrite text while code does the scoring made the system explainable.
- Reasoning models have a speed cost you can tune. Picking the right reasoning effort changed our UX more than any prompt change did.
- Vulnerability data is most useful when it drives an action, not just a map.
What's next for Mesh
- A coordinator dashboard where community organizations get a regional view and an AI situation summary.
- Smarter matching that blends skill fit, distance, and need into one volunteer ranking.
- Real-time updates over WebSockets, plus translation between requesters and volunteers.
- Piloting with a community's organization before hurricane seasons.
Built with: https://mesh-together.tech/
Built With
- atlas-vector-search
- caddy
- cdc-environmental-justice-index
- census-geocoder
- claude-code
- docker
- fastapi
- fastembed
- google-oauth
- leaflet.js
- meta-muse-spark
- mongodb
- nation-weather-services-api
- open-meteo
- openstreetmap
- python
- react
- sentence-transformers
- typescript
- vite
- vultr

Log in or sign up for Devpost to join the conversation.