Specimen Integrity Black Box (SIBB)
A journey-trust layer for the clinical lab, built on Splunk with a human-gated AI agent.
Splunk Agentic Ops Hackathon submission.
1. The problem
Hospitals are excellent at asking "is the test result correct?" and almost blind to the question that comes before it: "can this sample even be trusted?"
A blood tube travels through a pneumatic transport network, fridges, queues, and manual handoffs before an analyzer ever touches it. Along the way it can be shaken past tolerance, stalled in a blower fault, rerouted, left in a deep receiving queue, or handed off without a custody scan. The analyzer still returns a clean, in-range number. Quality control still says PASS. The result flows to the doctor - and nobody ever checked the journey.
This pre-analytic blind spot is where the majority of avoidable lab errors are born. The telemetry that would expose it already exists, scattered across transport logs, station sensors, queue states, and operator scans. It is simply never correlated into a single verdict before the result is released.
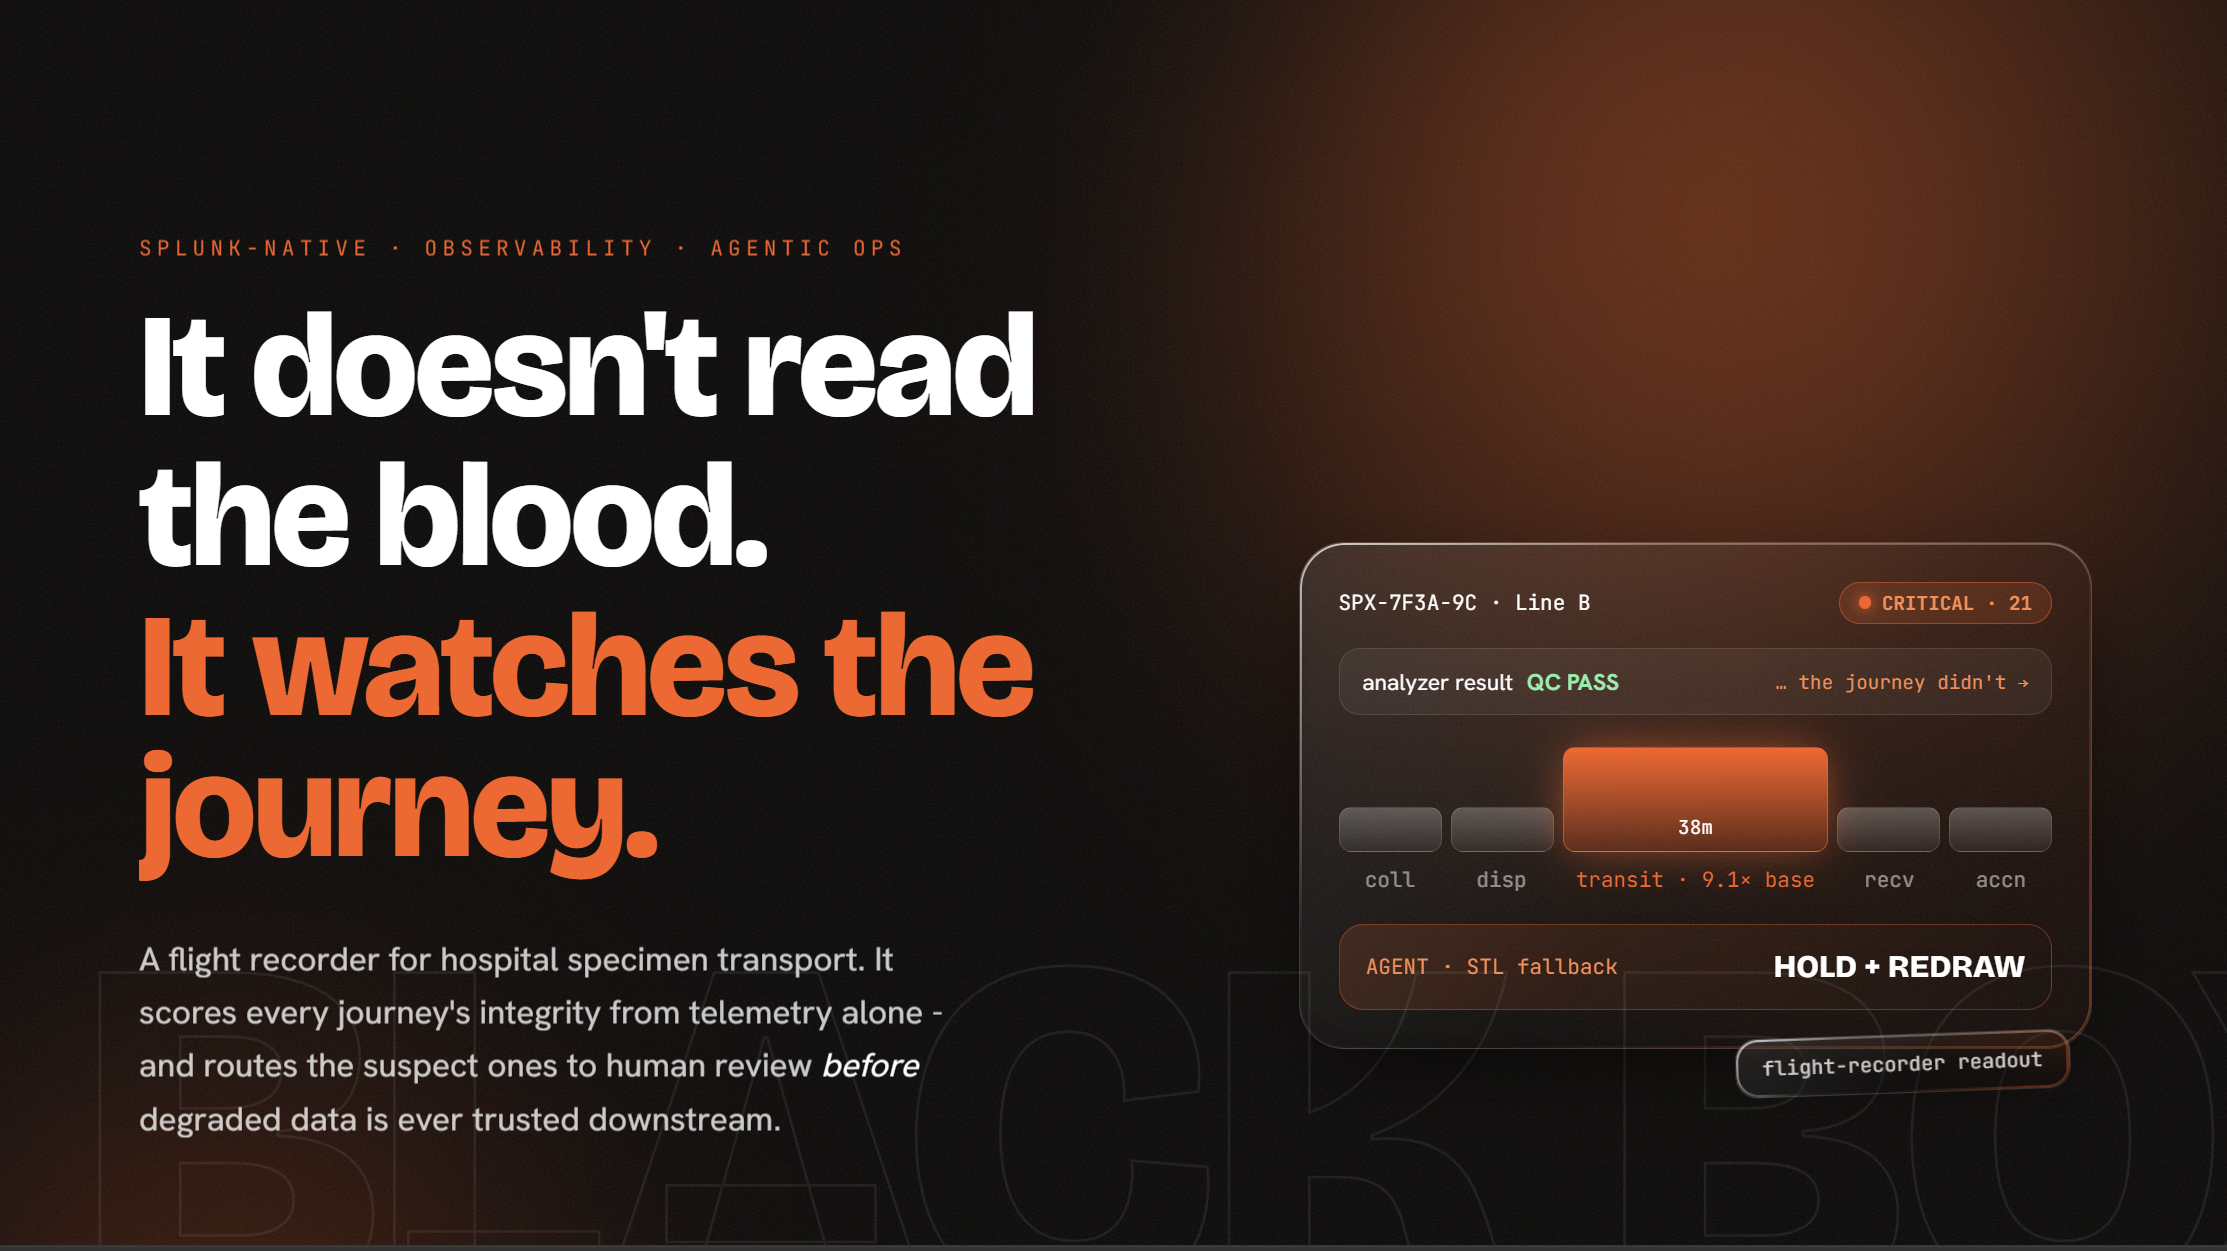
SIBB closes that gap. It watches the journey, not the blood, and produces one decision: can this specimen's result still be trusted, or should a human intervene before it goes downstream?
2. What the product does
For every specimen journey, SIBB assembles the full cross-index story, scores it, and assigns a trust band:
| Band | Meaning | Default action |
|---|---|---|
NORMAL |
Journey integrity verified | RELEASE (auto) |
CONCERNING |
Custody/queue anomaly needs a human check | HOLD - CONFIRM CUSTODY |
CRITICAL |
Physical integrity likely compromised | HOLD + REDRAW |
Clean journeys release on their own. Only suspect ones surface to a human, in an operations console, with every claim backed by a real Splunk event. A reviewer approves exactly one bounded, reversible action, and that decision is written back into Splunk so the platform owns the audit trail.
Two design rules define the product:
- It is never a diagnosis. SIBB makes no clinical claim about the patient or the result value. It only judges whether the journey can be trusted.
- It does not cry wolf. A six-minute delay that matches a known 07:00 shift-change pattern is released, not escalated. Suppressing the false alarm is treated as half the job.
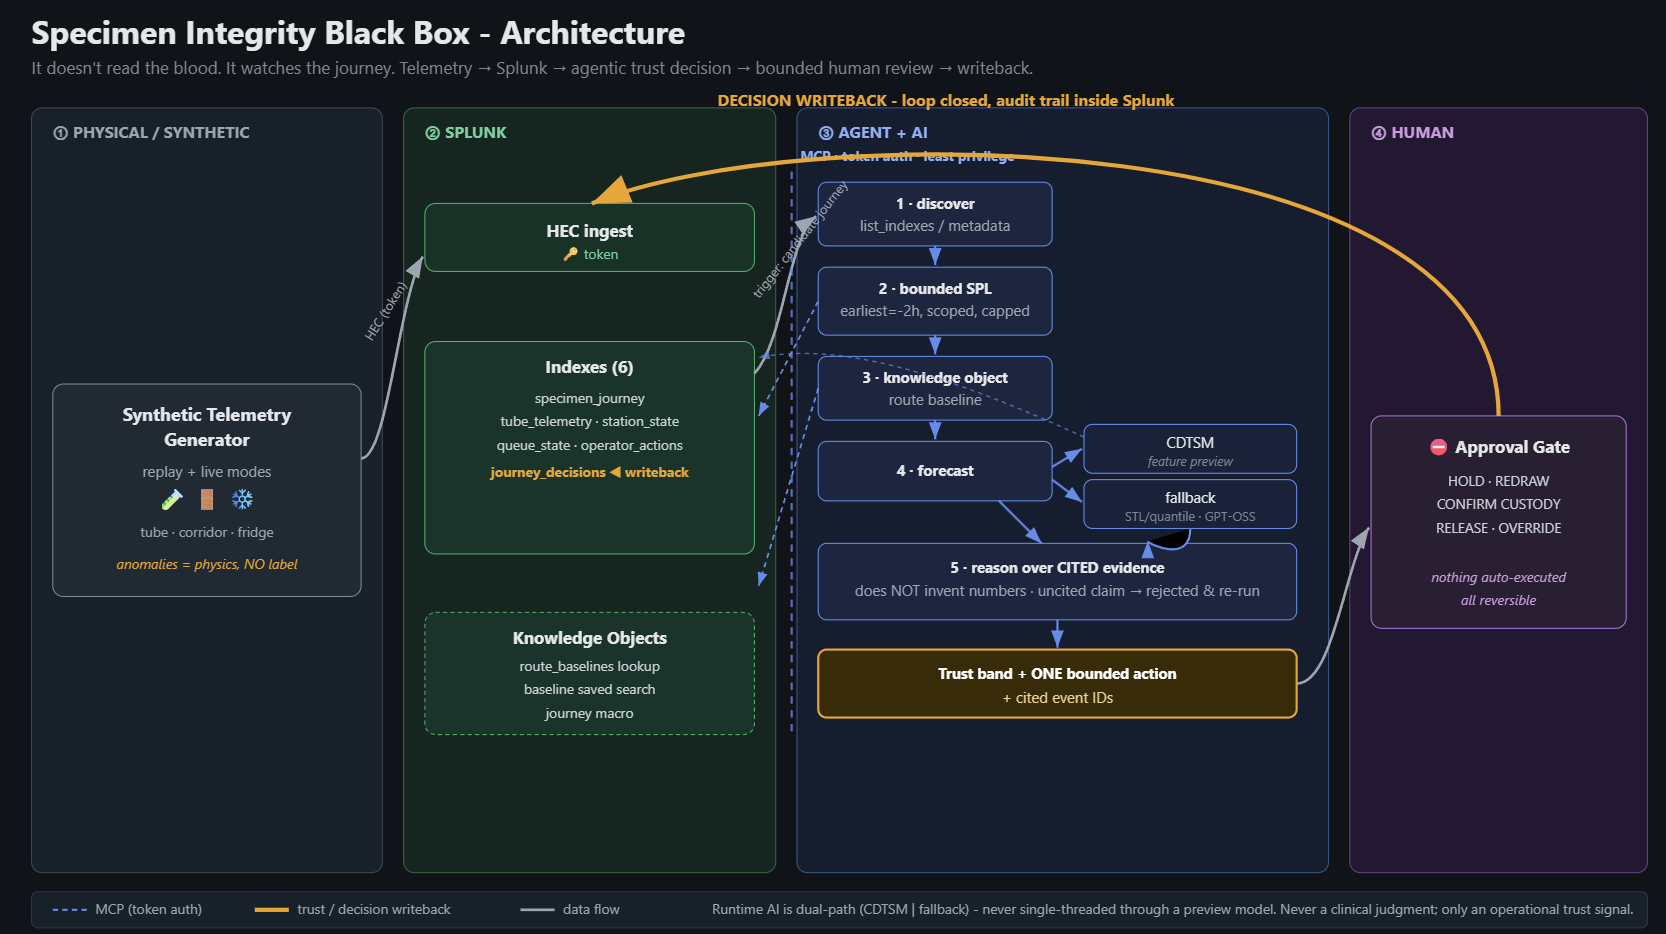
3. How SIBB handles a journey (end to end)

- Discover the Splunk environment (indexes + metadata).
- Bounded SPL query for this one specimen across all journey indexes - never an unbounded scan.
- Pull the route baseline from a lookup (expected p50/p95 transit, scan window, known-benign context).
- Forecast expected transit with a dual path: a saved-search quantile forecaster, with a deterministic fallback so it never depends on a preview model.
- Reason over the cited evidence with a hosted model, which classifies the band and writes a rationale where every claim resolves to a real event ID.
- Human gate + writeback: nothing executes on its own; an approved decision is appended to
journey_decisions.
4. Where we use Splunk
Splunk is the system of record, the query engine, the forecaster, the knowledge base, and the audit log - not just a dashboard. Every number SIBB reasons over comes out of Splunk.
4.1 Indexes (the journey, decomposed)
| Index | What it holds |
|---|---|
specimen_journey |
Milestones per specimen: drawn, dispatched, received, etc., with route_id, carrier_id, dest_node |
tube_telemetry |
Pneumatic carrier physics: transit_sec, shock_index, blower faults, reroutes, arrive/depart events |
station_state |
Per-station environmental state (e.g. fridge door, temperature) |
queue_state |
Receiving-queue depth and oldest-wait times |
operator_actions |
Manual scans and handoffs (and their absence) |
journey_decisions |
Writeback target - every agent verdict, cited, with reviewer and reasoning source |
4.2 HEC ingest + typed parsing
Synthetic-but-physical telemetry is ingested over HTTP Event Collector with token auth. props.conf types the sibb:* sourcetypes for clean, index-time-correct JSON:
INDEXED_EXTRACTIONS = jsonKV_MODE = jsonTIME_PREFIX = "ts":"with a matchingTIME_FORMAT
4.3 Knowledge objects
| Object | Type | Role |
|---|---|---|
route_baselines.csv |
Lookup (transforms.conf) |
Per-route p50/p95 transit, scan window, and known_benign_context (e.g. shift_change_0700) that drives false-alarm suppression |
baseline_recent_by_route |
Saved search (cron */10) |
Recent transit quantiles per line for fallback forecasting (stats median()/perc95() ... eval forecast_source="stl_quantile_fallback") |
candidate_integrity_reviews |
Saved search (cron */5) |
Surfaces compound-risk journeys (join telemetry + lookup baseline; flags time_risk/shock_risk) for the agent to pick up |
journey(1) |
Macro | Cross-index assembly of a single specimen's full journey |
journey_decision_writeback_fields |
Macro | Canonical field set for the writeback contract |
4.4 SPL we actually run
Bounded, single-specimen queries - stats median()/perc95() for baselines, join to correlate carrier telemetry with journey milestones, lookup for route baselines, eval/where for risk flags, table/sort/dedup for shaping. No unbounded scans.
4.5 REST management API + least-privilege tokens
The agent talks to Splunk over the REST management API on :8089 with a scoped bearer token (minted via authorization/tokens, short TTL, single audience). It uses:
| Endpoint | Use |
|---|---|
search/jobs/export |
Run bounded SPL, stream results |
data/indexes |
Discover environment |
saved/searches |
Read the forecaster + candidate reviews |
authorization/tokens |
Mint least-privilege agent tokens |
HEC services/collector/event |
Writeback to journey_decisions |
4.6 Resilient dual-path forecasting
Transit forecasting never hard-depends on any one engine. The primary path uses a Splunk saved-search quantile forecaster; if that is unavailable, a deterministic Splunk-native fallback (stl_quantile_fallback) computes expected/p95 from recent history. The forecast source is recorded on every decision, so the audit trail always shows how the number was produced.
4.7 Writeback - closing the loop in Splunk
When a human approves, the decision (band, score, recommended action, rationale, evidence event IDs, reasoning source, reviewer hash) is written back via HEC into journey_decisions. The console reads it straight out of Splunk - the platform, not the app, owns the record.
5. AI features
The hosted model is the reasoning brain, but it is fenced in by hard guardrails so it can never invent facts.
5.1 Real multi-step agent over MCP
SIBB is not a single prompt. It is a multi-step agent whose only path to Splunk is a token-authenticated MCP server exposing a least-privilege tool surface:
| MCP tool | What it does |
|---|---|
list_indexes |
Discover available indexes |
get_index_metadata |
Index field/structure metadata |
run_search |
Execute a bounded SPL query |
get_lookup |
Read a knowledge-object lookup (e.g. route baselines) |
get_saved_search_result |
Read the forecaster / candidate-review output |
forecast_transit |
Dual-path expected-transit forecast |
write_decision |
Human-gated writeback to journey_decisions |
5.2 Runtime hosted-model reasoning - Gemini 3.5 Flash on Vertex AI
The classification step is a live Gemini 3.5 Flash call on Vertex AI at runtime (reasoning_source = hosted_model:vertex:gemini-3.5-flash), authenticated with a service-account token. The model receives only Splunk-retrieved evidence and returns a trust band, recommended action, and rationale.
5.3 The citation contract (the core safety feature)
- Numbers come from Splunk, not the model. Every quantitative claim (transit seconds, queue depth, shock index) is an SPL result.
- The model classifies and cites. Each evidence line carries a real
event_id. - Uncited claims are rejected. Any assertion the model cannot pin to an event is dropped, and a
rule_fallbackguardrail produces a deterministic verdict if the model output fails validation.
This is what makes the AI trustworthy in a clinical context: it reasons, but it cannot hallucinate a fact into the audit trail.
5.4 Gemini-written forecast analysis
Beyond per-specimen judgment, the model writes a live forecast analysis over the route baselines vs. observed transit (correlated across tube_telemetry and specimen_journey by specimen_id). In testing it correctly reported the network as stable on average while flagging the severe tail-risk outlier on Line B hiding under a healthy median - analysis, not a static threshold.
5.5 Pluggable and resilient
The provider layer is swappable and every model path has a deterministic fallback, so a preview-model outage degrades gracefully to a rule-based verdict rather than failing the journey.
6. Technical implementation
6.1 Architecture at a glance
| Layer | Implementation |
|---|---|
| Telemetry generator | Dependency-free Python emitting physical anomalies (no labels the model can read) |
| Ingest | HEC (token auth) into 6 indexes; props.conf-typed sibb:* sourcetypes |
| Knowledge | Lookup + 2 saved searches + 2 macros (transforms/savedsearches/props/macros.conf) |
| Access | REST management API on :8089 with scoped bearer tokens |
| Tool layer | MCP server (stdio JSON-RPC, bearer auth, 7 least-privilege tools) |
| Agent | Multi-step MCP loop (run_investigation.py) |
| Reasoning | Gemini 3.5 Flash on Vertex AI + citation contract + rule fallback |
| Live bridge | stdlib http.server serving the frontend same-origin + JSON API |
| Frontend | Vanilla JS / CSS console (TRUST PULSE, queue, journey detail, agent console, ledger, forecasts) |
6.2 Live bridge API
The console reads live Splunk through a dependency-free bridge (bridge/serve.py):
| Method + path | Purpose |
|---|---|
GET /api/data |
Aggregate: pulse, review queue, contrast case, decision ledger, forecast - built from Splunk reads |
GET /api/forecast-report |
Gemini forecast analysis grounded on baseline vs. observed transit (cached, billed call) |
POST /api/investigate |
Run the real MCP + Gemini loop for one specimen (no writeback) |
POST /api/writeback |
Same loop, then append the approved decision to journey_decisions |
With no Splunk configured the bridge returns 503 and the frontend falls back to built-in mock data, so the UI never breaks on stage.
6.3 The agent trace (one investigation)
| Step | Tool | Output (example: SPX-7F3A-9C) |
|---|---|---|
| 1 | list_indexes / get_index_metadata |
6 indexes discovered |
| 2 | run_search |
bounded SPL for the specimen |
| 3 | get_lookup |
route baseline LINE_B_OR3_REC2 (p95 = 310s) |
| 4 | forecast_transit / get_saved_search_result |
source = stl_quantile_fallback |
| 5 | reason_over_cited_evidence |
band = CRITICAL, action = HOLD + REDRAW, gemini-3.5-flash |
| 6 | write_decision |
HEC 200 -> journey_decisions |
6.4 Worked example - the verdict that matters
SPX-7F3A-9C, route LINE_B_OR3_REC2:
- Transit 2284s vs. a route p95 of 310s - 7.4x the ceiling
[tube_telemetry/0x00009] - Blower fault -> reroute -> blower fault -> reroute during the carrier journey
[tube_telemetry/0x00007] - Shock index 0.81, above the handling-risk threshold
[tube_telemetry/0x00007] - Receiving queue depth 12, oldest wait 380s
[queue_state/0x0000D]
Verdict: CRITICAL (21/100) -> HOLD + REDRAW. Downstream QC said PASS. The data looked fine. The journey did not.
And the counter-example, SPX-5D20-1A (route LINE_A_WARD7_REC1): a queue delay that matched the known shift_change_0700 benign context -> NORMAL (92/100) -> RELEASE. The false alarm a naive threshold would have fired.
7. Scope and guardrails
- Synthetic data, real architecture. All telemetry is generated; anomalies are injected as physics with no label the model can read. Swapping in real hospital feeds is a source change, not an architecture change.
- Never a diagnosis - only a journey-trust signal.
- Human-in-the-loop - no action executes without an approval, and every action is bounded and reversible.
- Cited or rejected - the model can reason but cannot introduce an unverifiable fact.
8. Tech stack
| Concern | Choice |
|---|---|
| Platform of record | Splunk (indexes, HEC, REST, SPL, saved searches, lookups, macros) |
| Tool protocol | Model Context Protocol (MCP), stdio JSON-RPC, bearer auth |
| Runtime reasoning | Gemini 3.5 Flash on Vertex AI |
| Agent + bridge | Python standard library only (zero runtime dependencies) |
| Frontend | Vanilla HTML / CSS / JS, served same-origin by the bridge |
| Auth | Splunk scoped tokens; Vertex service-account credentials |


Log in or sign up for Devpost to join the conversation.