Inspiration
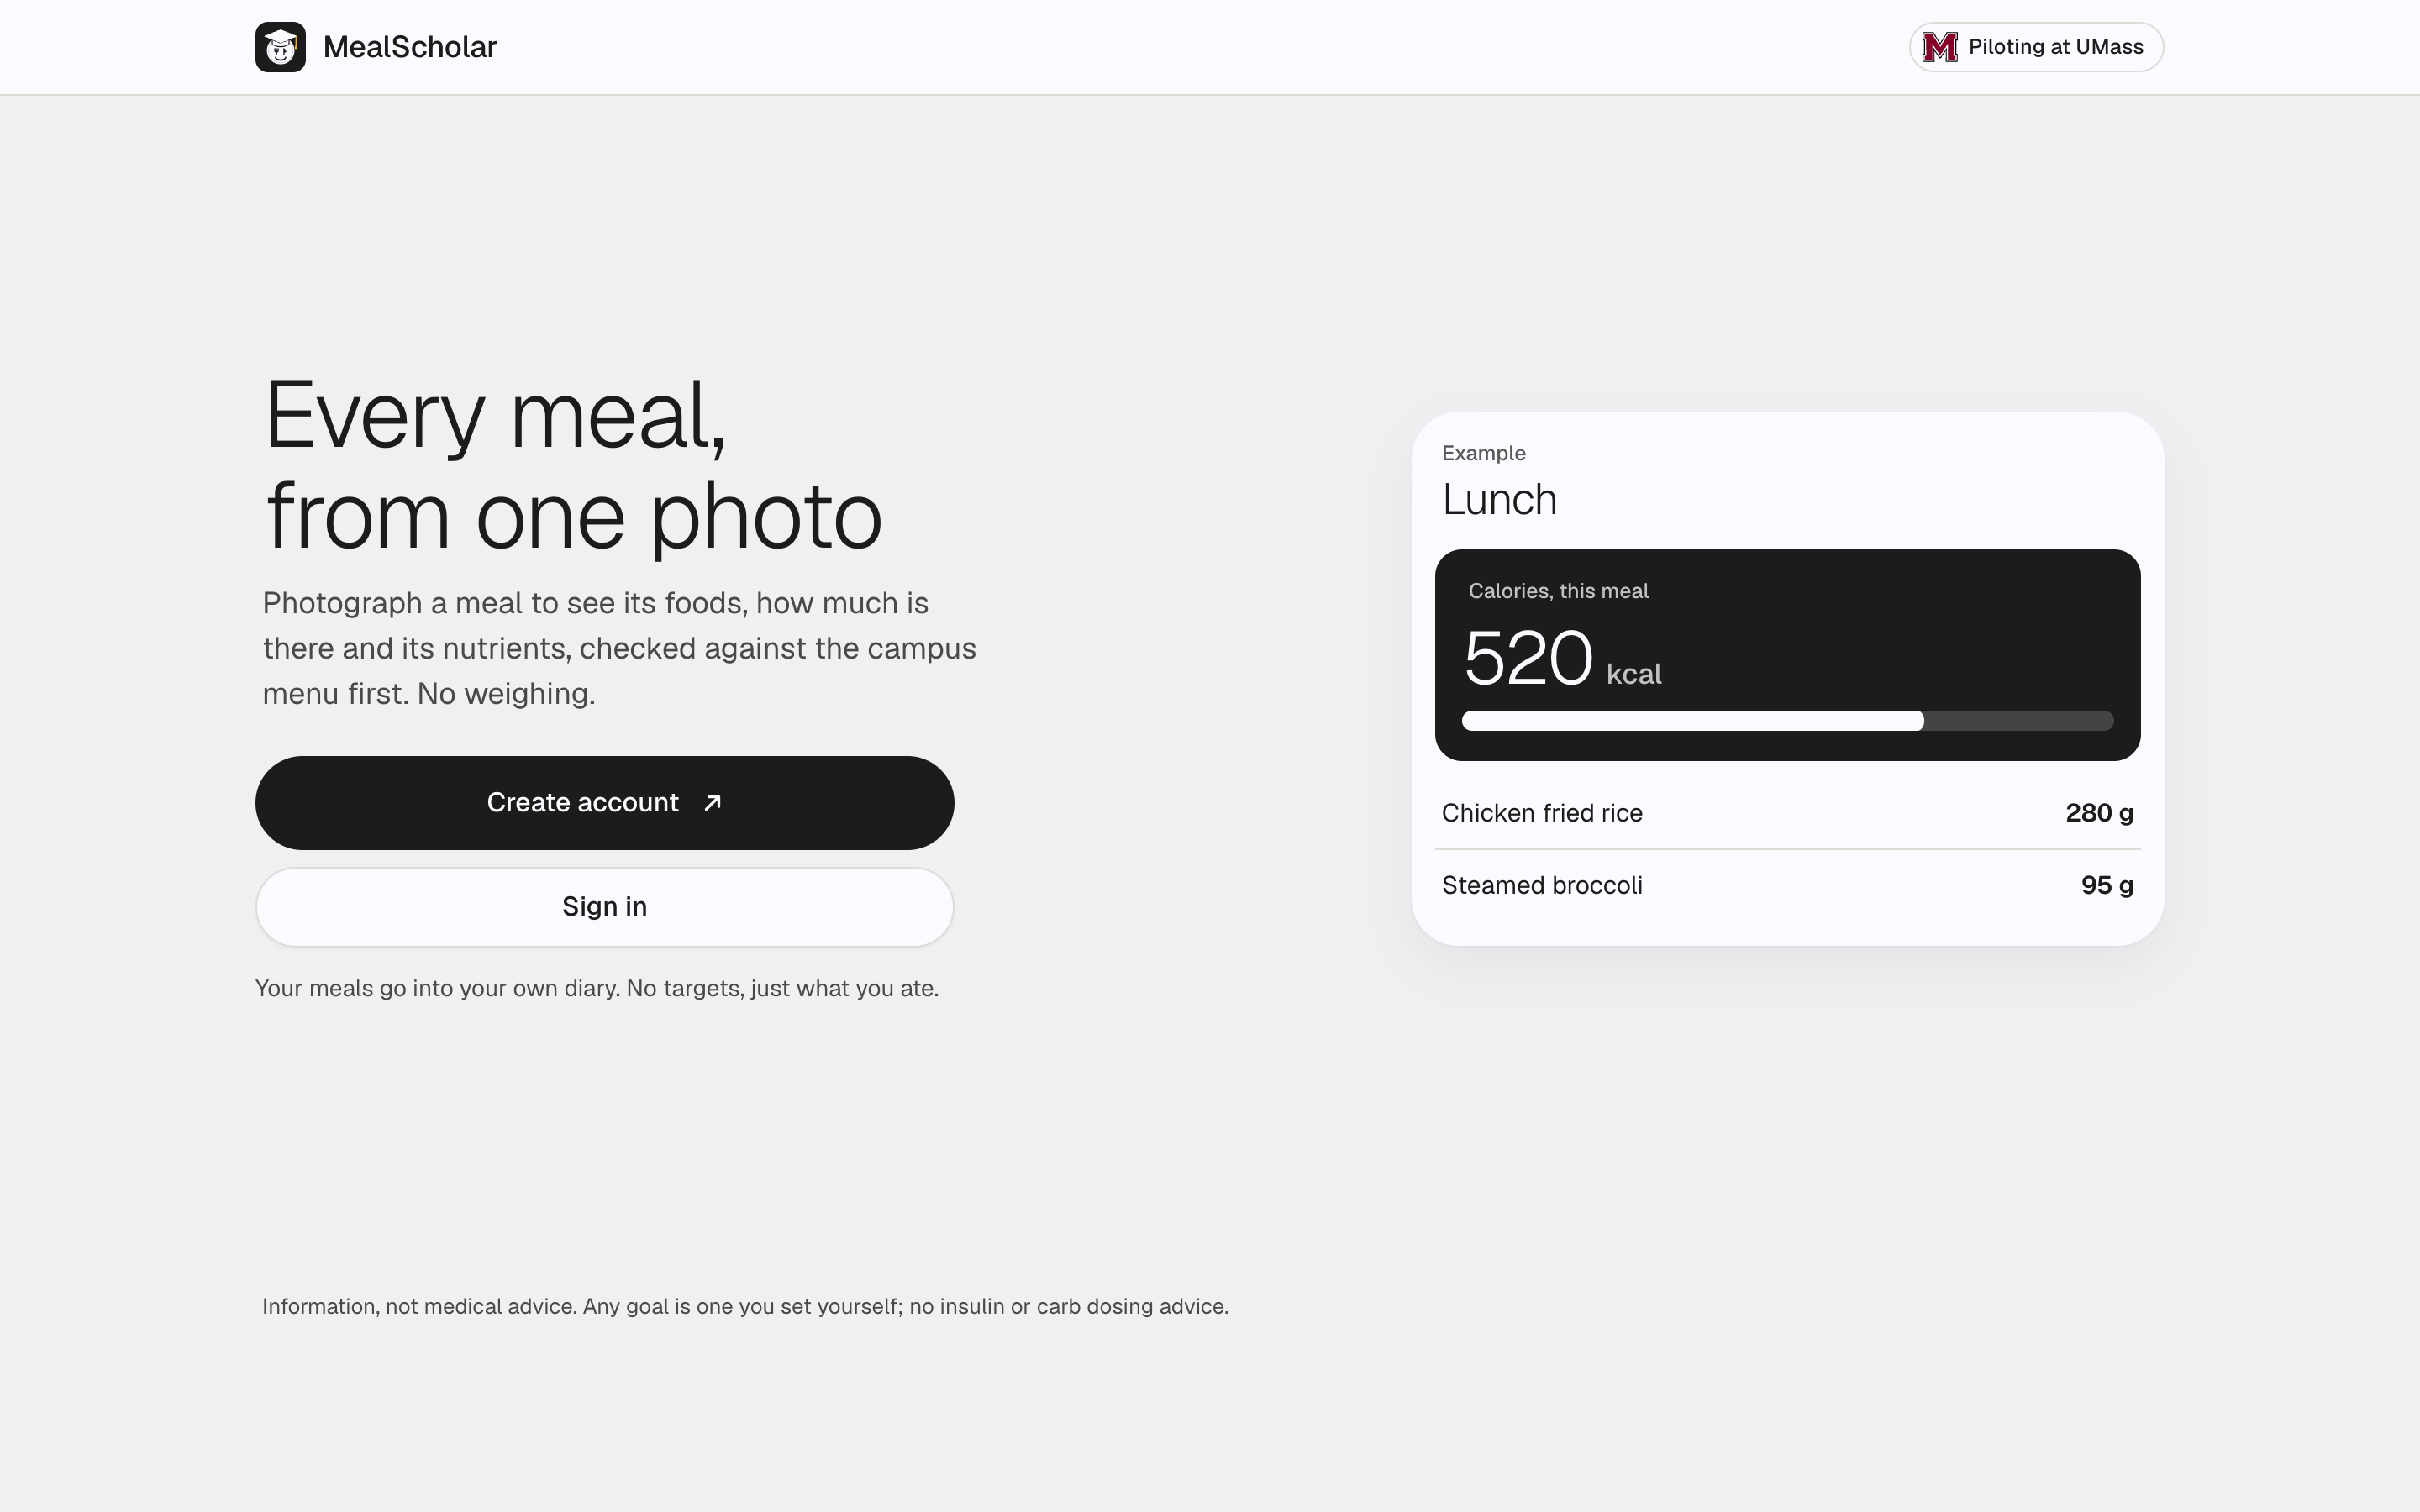
UMass Dining posts nutrition facts for every dish it serves. Even so, logging a dining hall plate still means searching a food database and guessing how many grams you took. Photo apps skip the search, but then they show one number, like "612 kcal", that a photo can't back up. No one can see how much rice is under the sauce, so the honest answer is a range. We wanted an app that admits that: take a photo, get a range, and answer one question when the photo isn't enough.
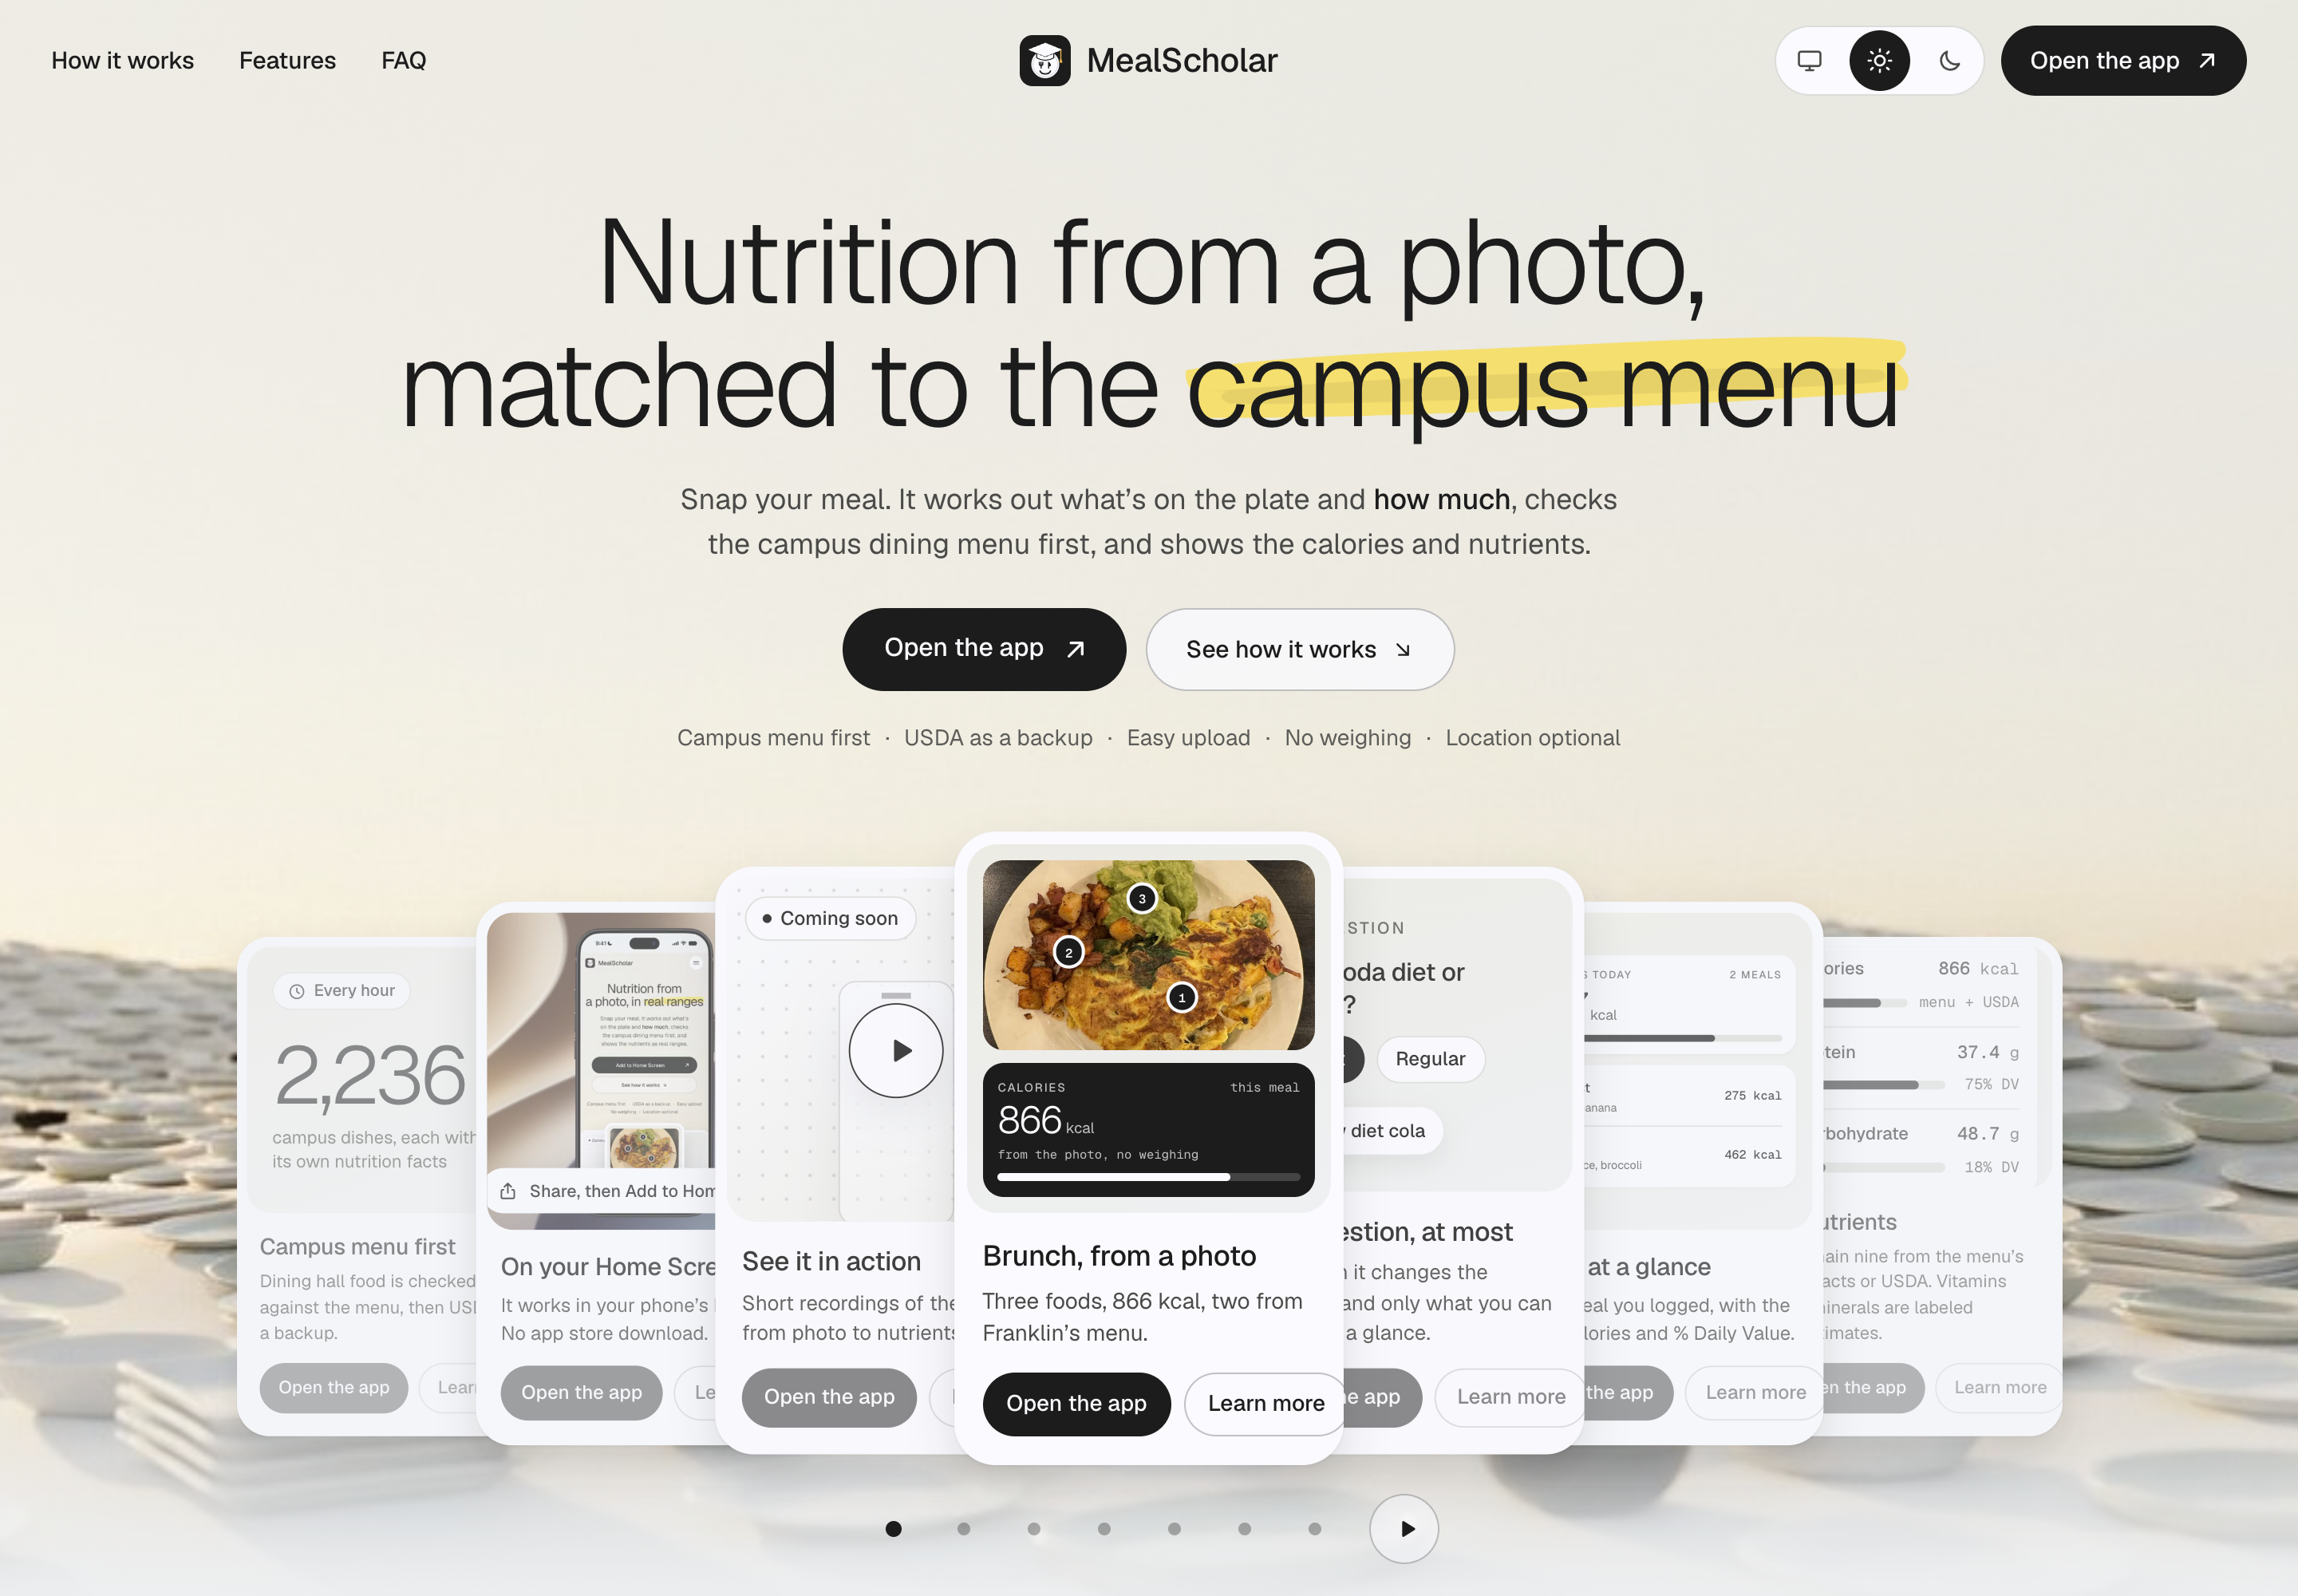
What it does
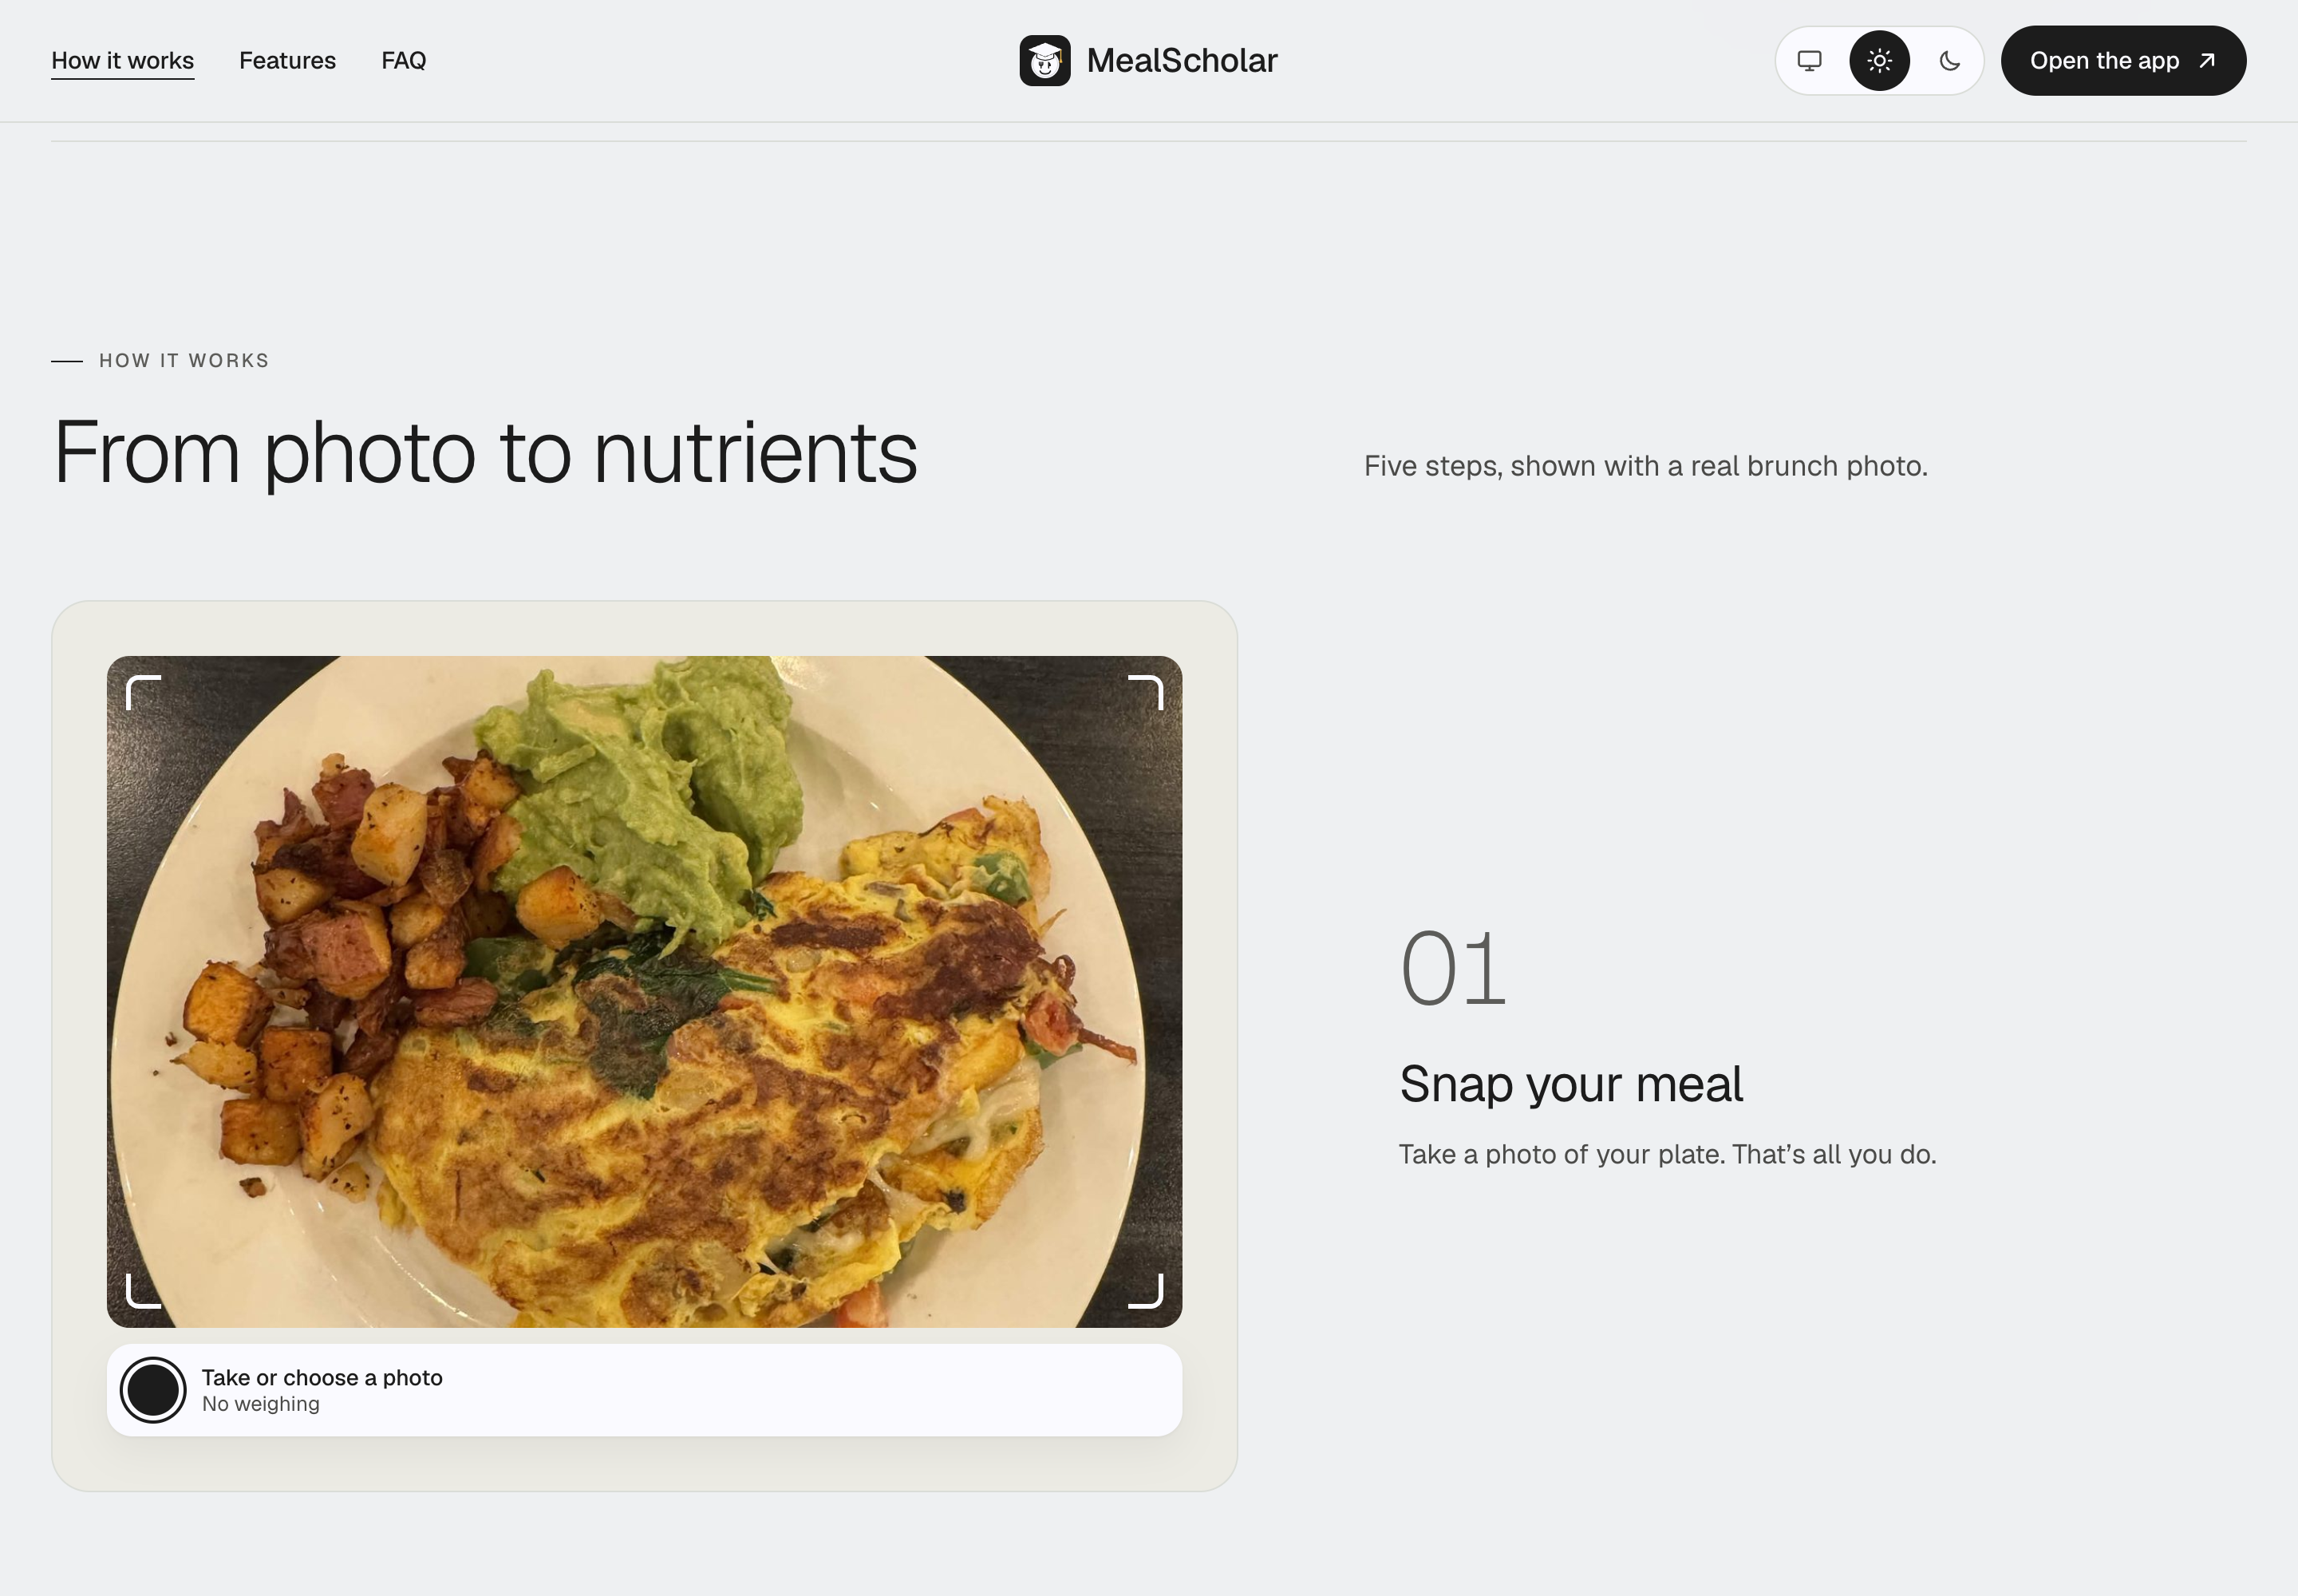
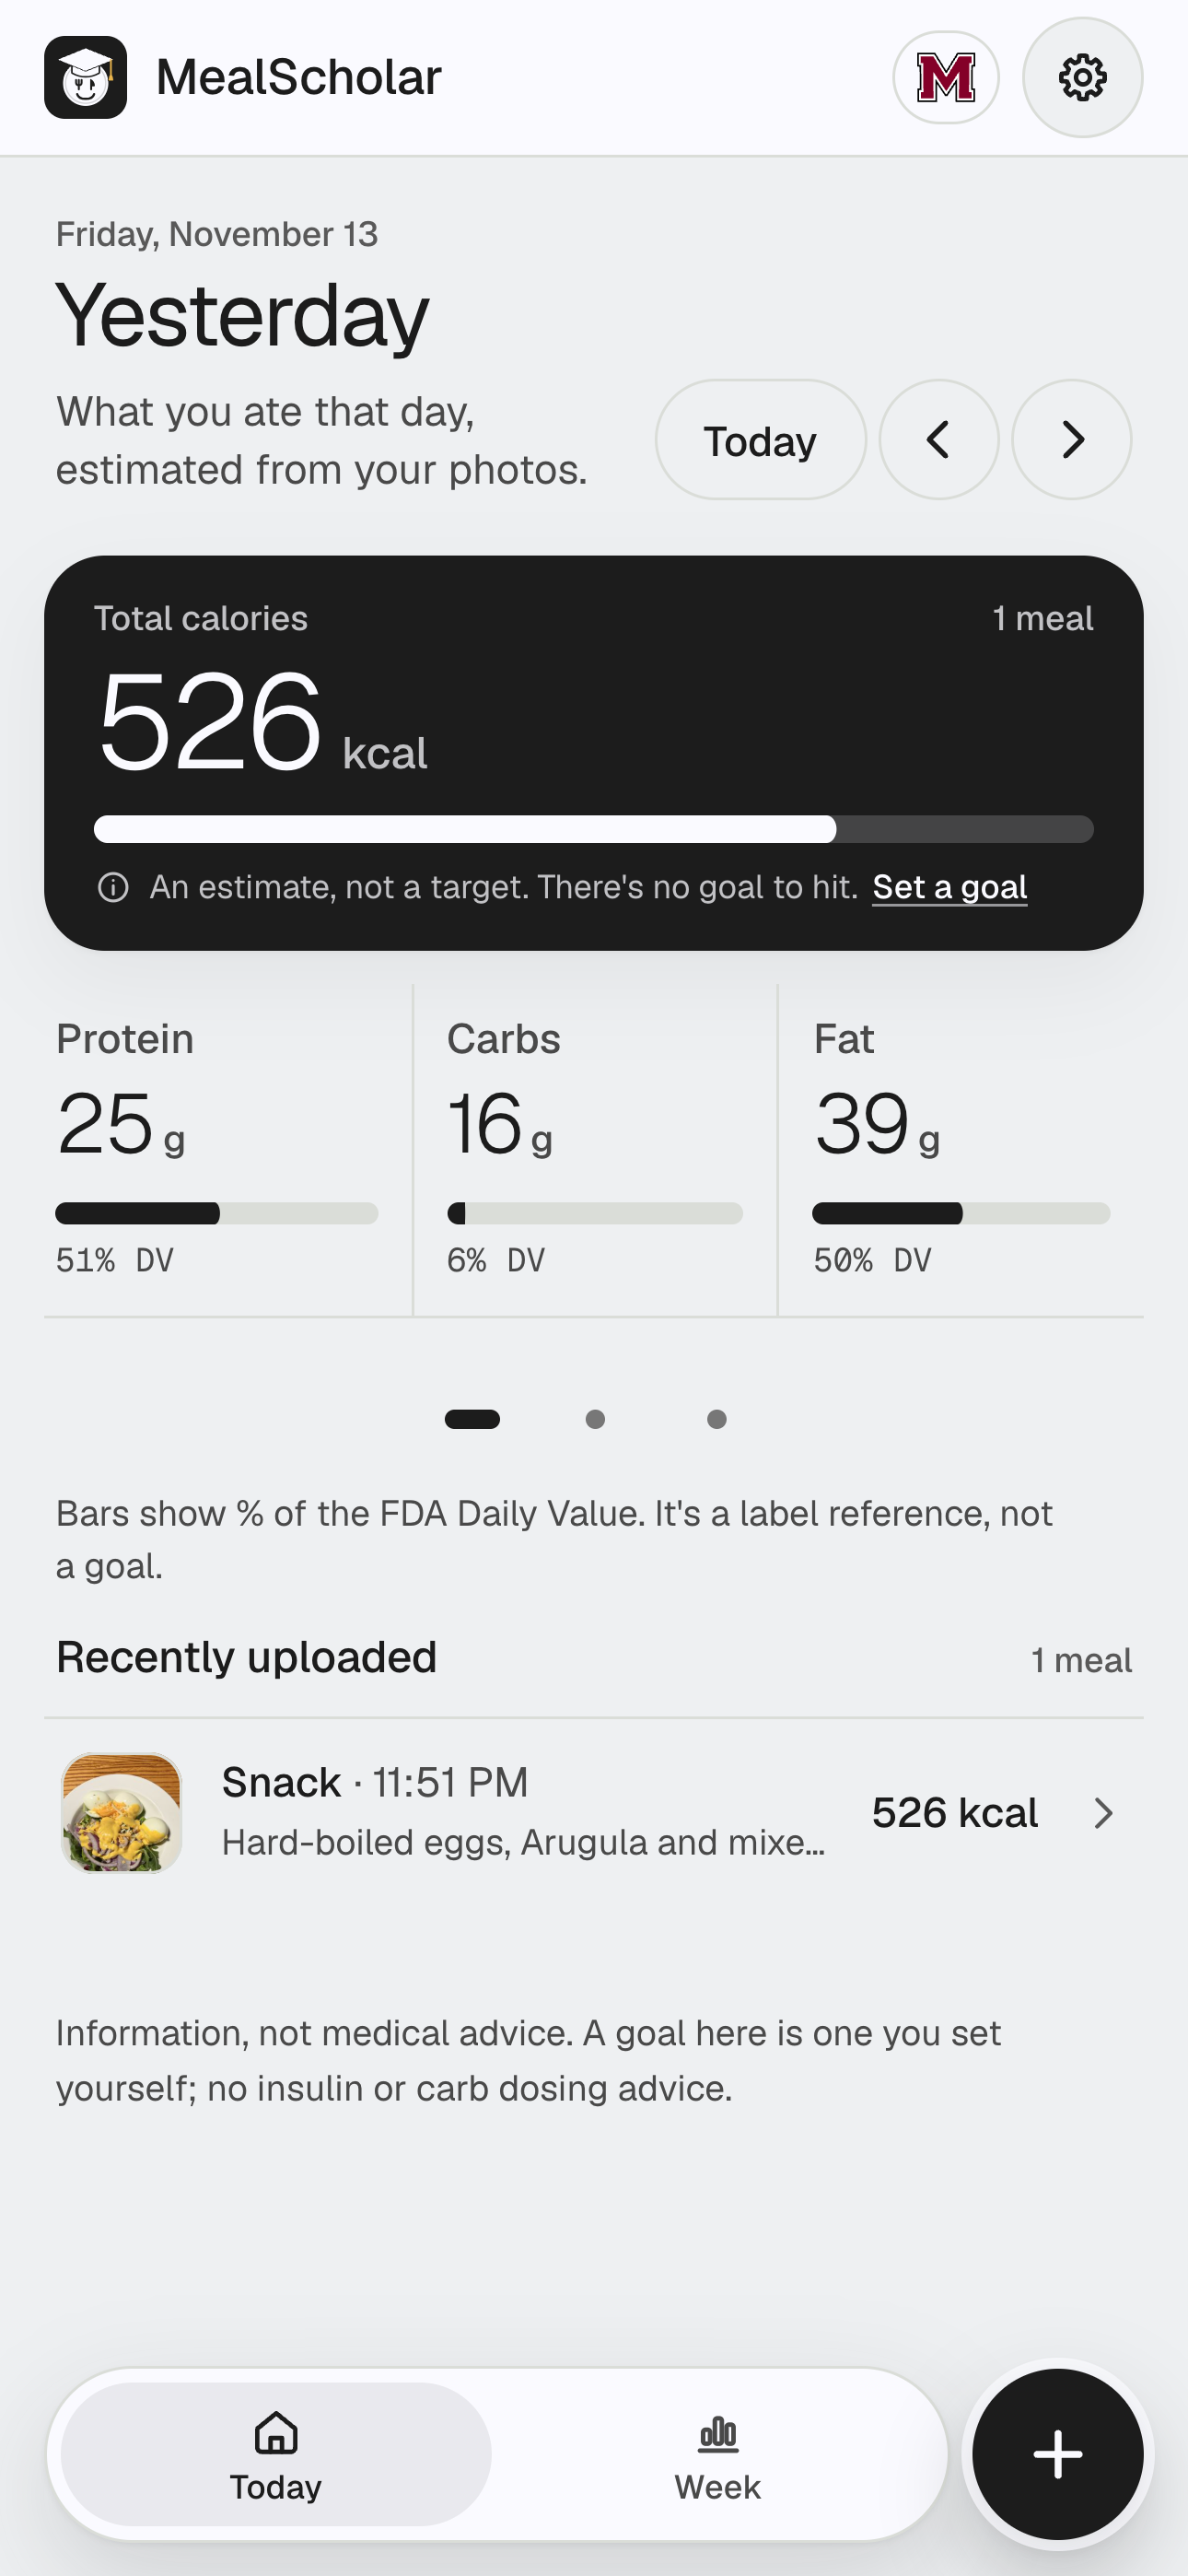
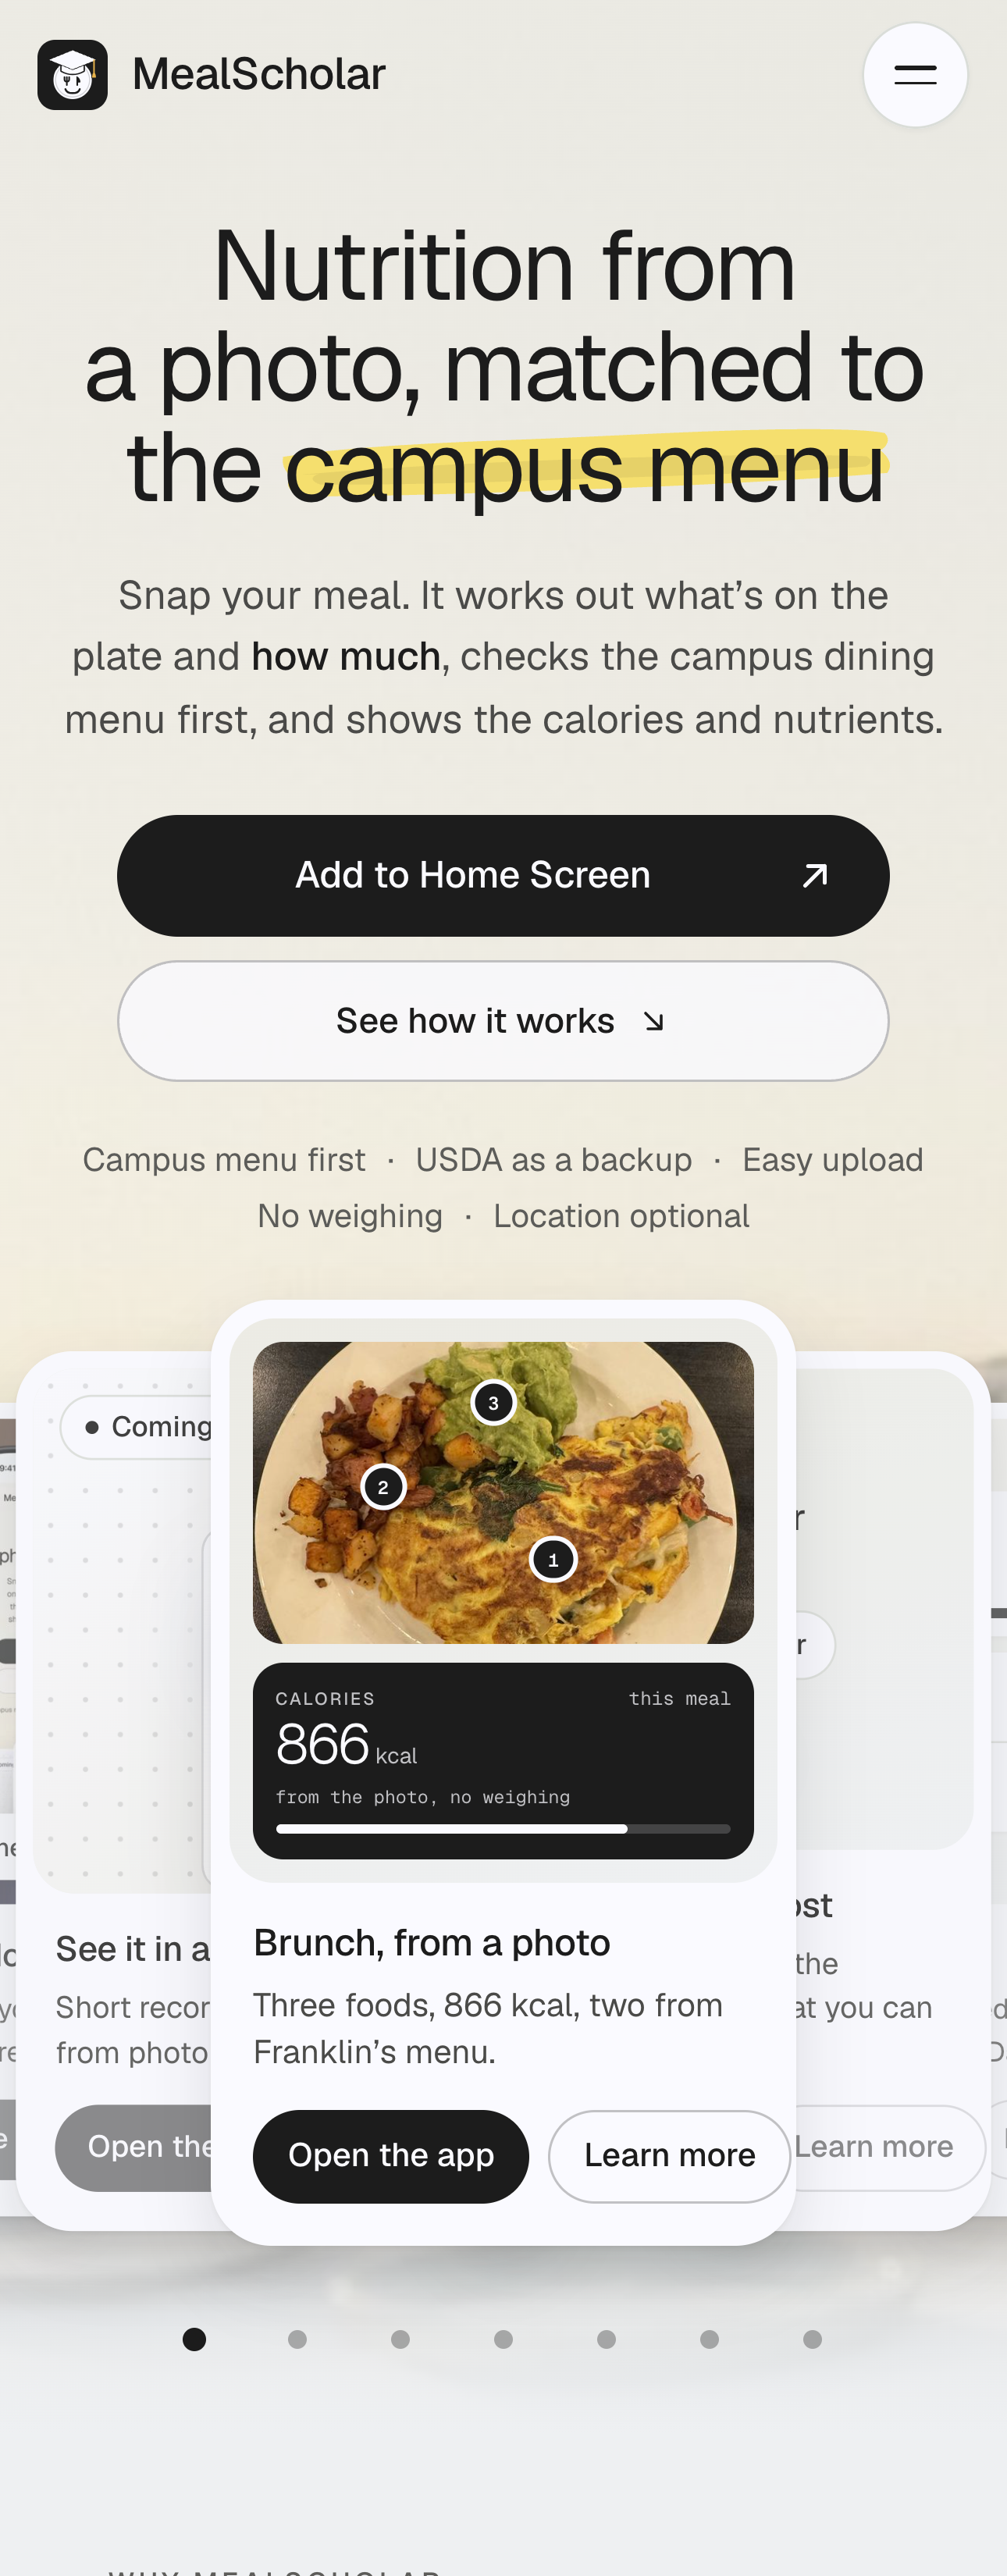
- Snap. Take or choose a photo of your meal in your phone's browser (JPEG, PNG or HEIC). There's nothing to install, and you can add it to your Home Screen.
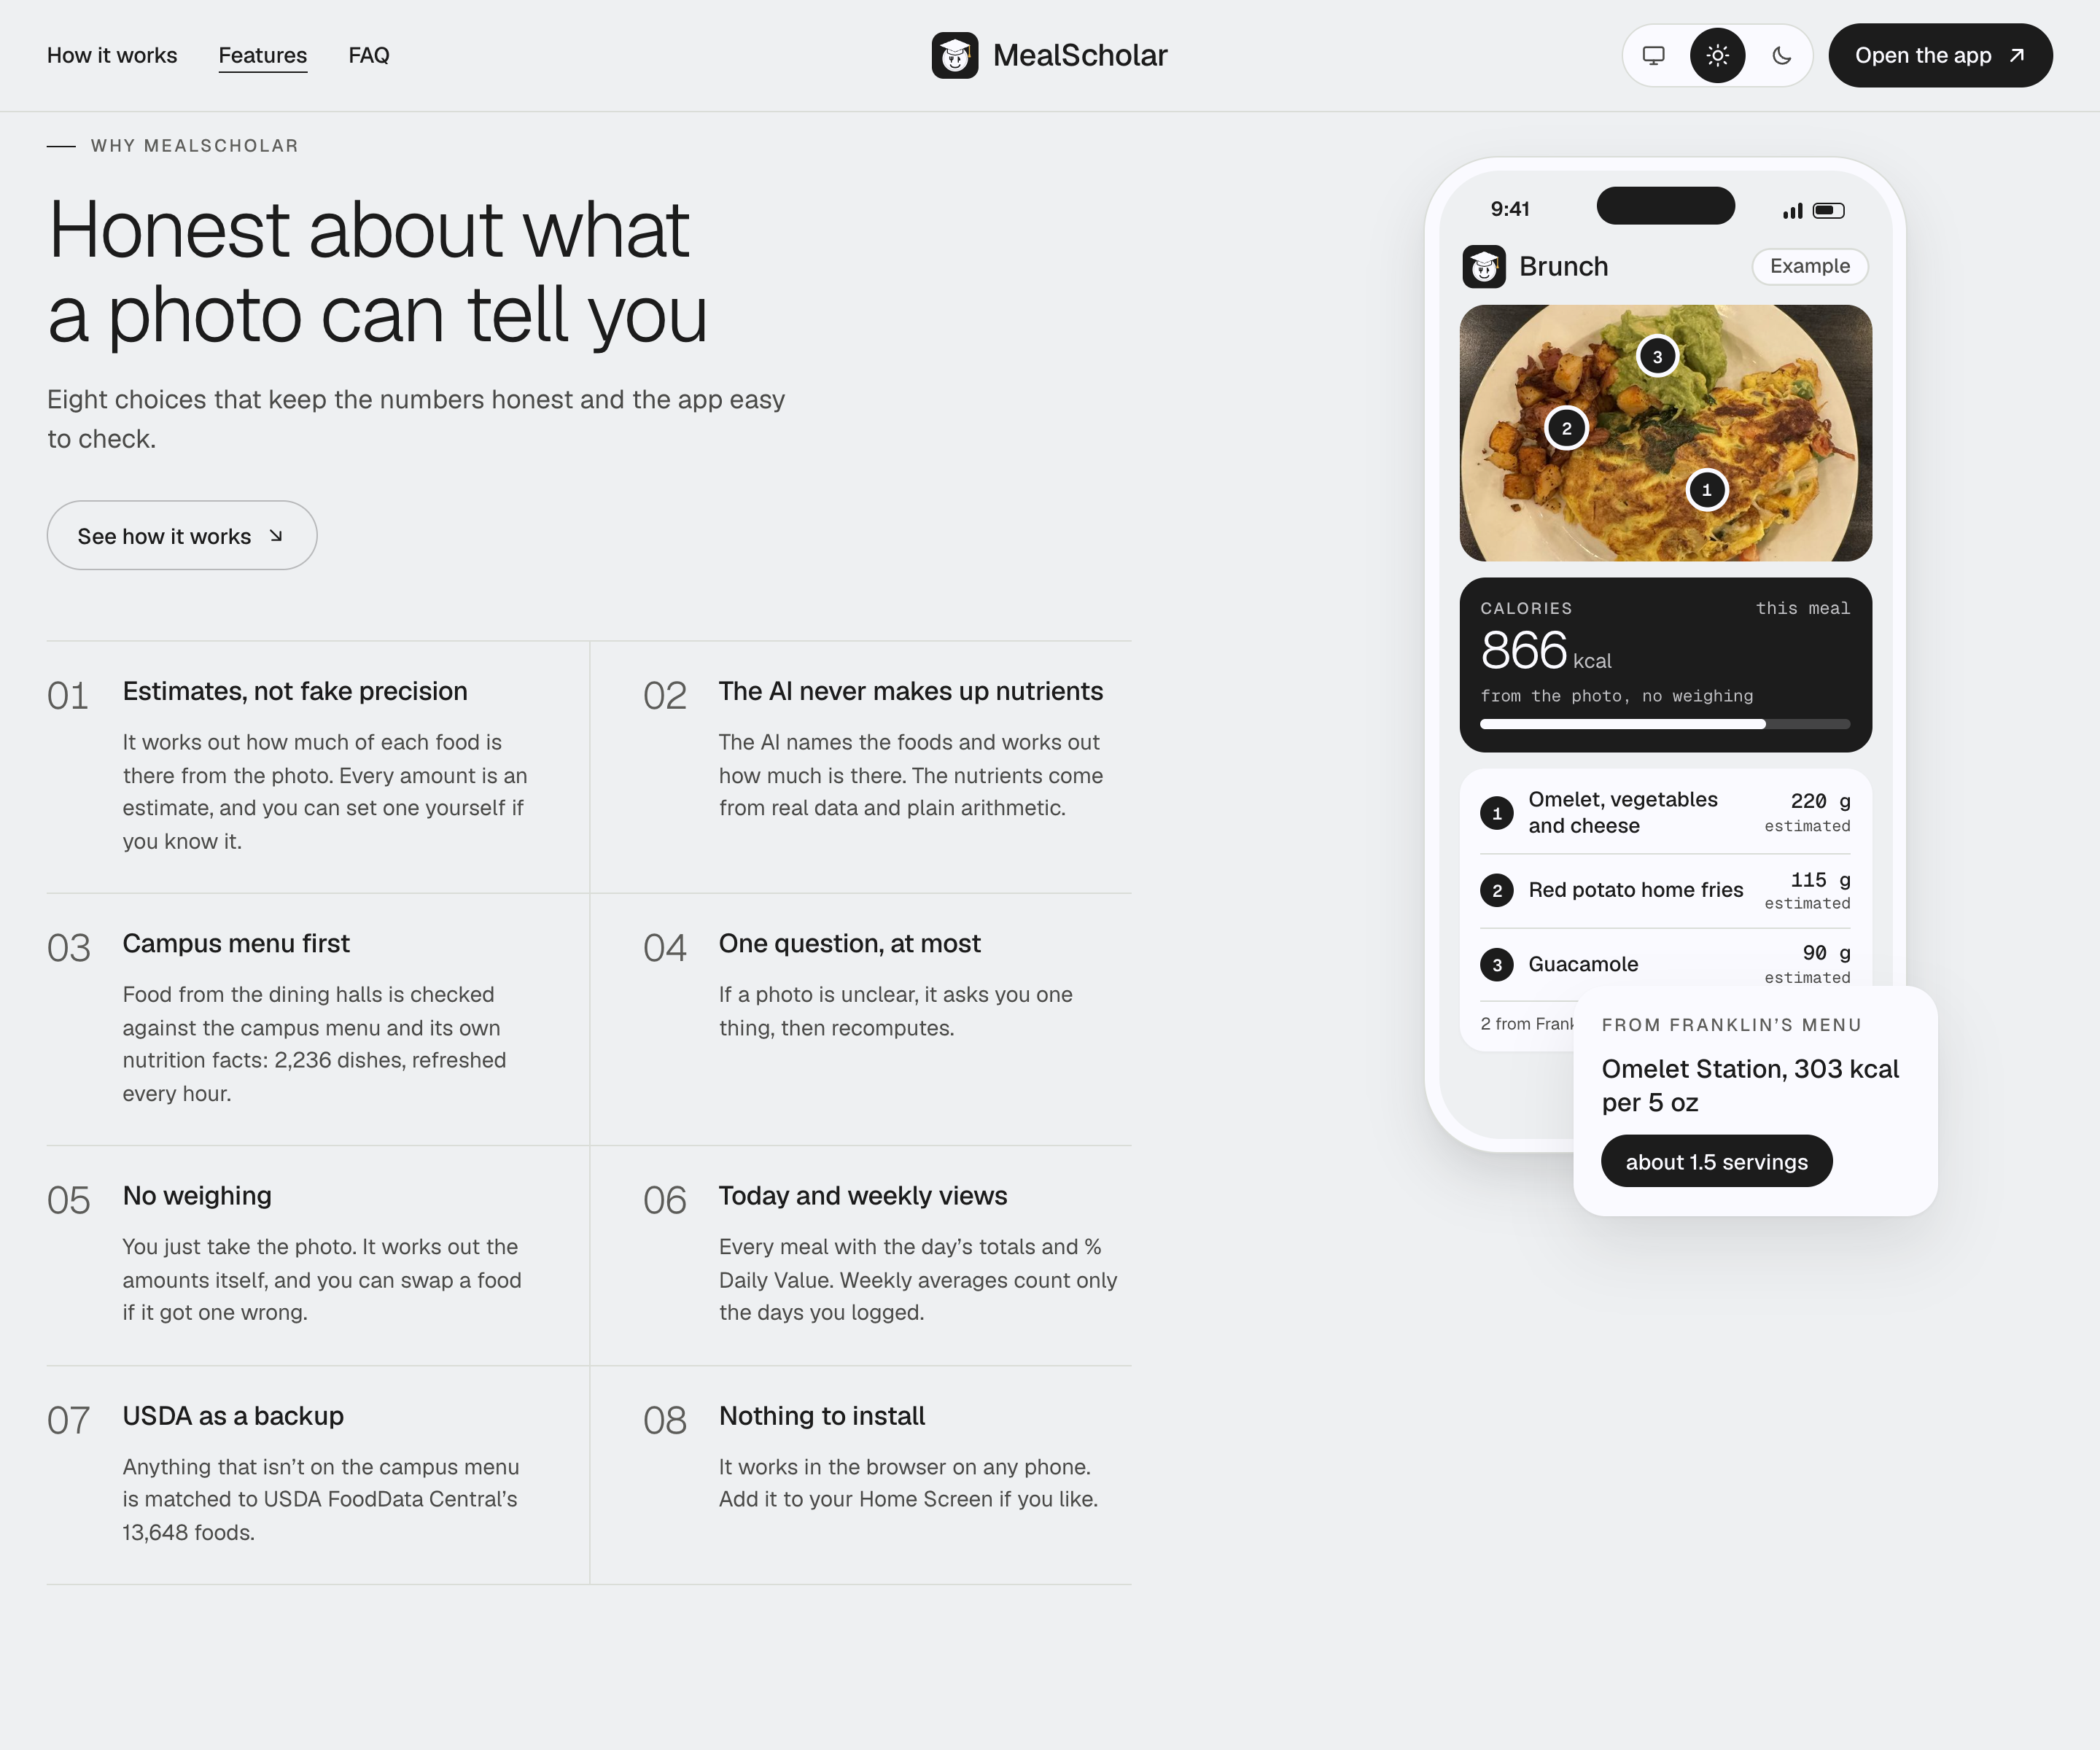
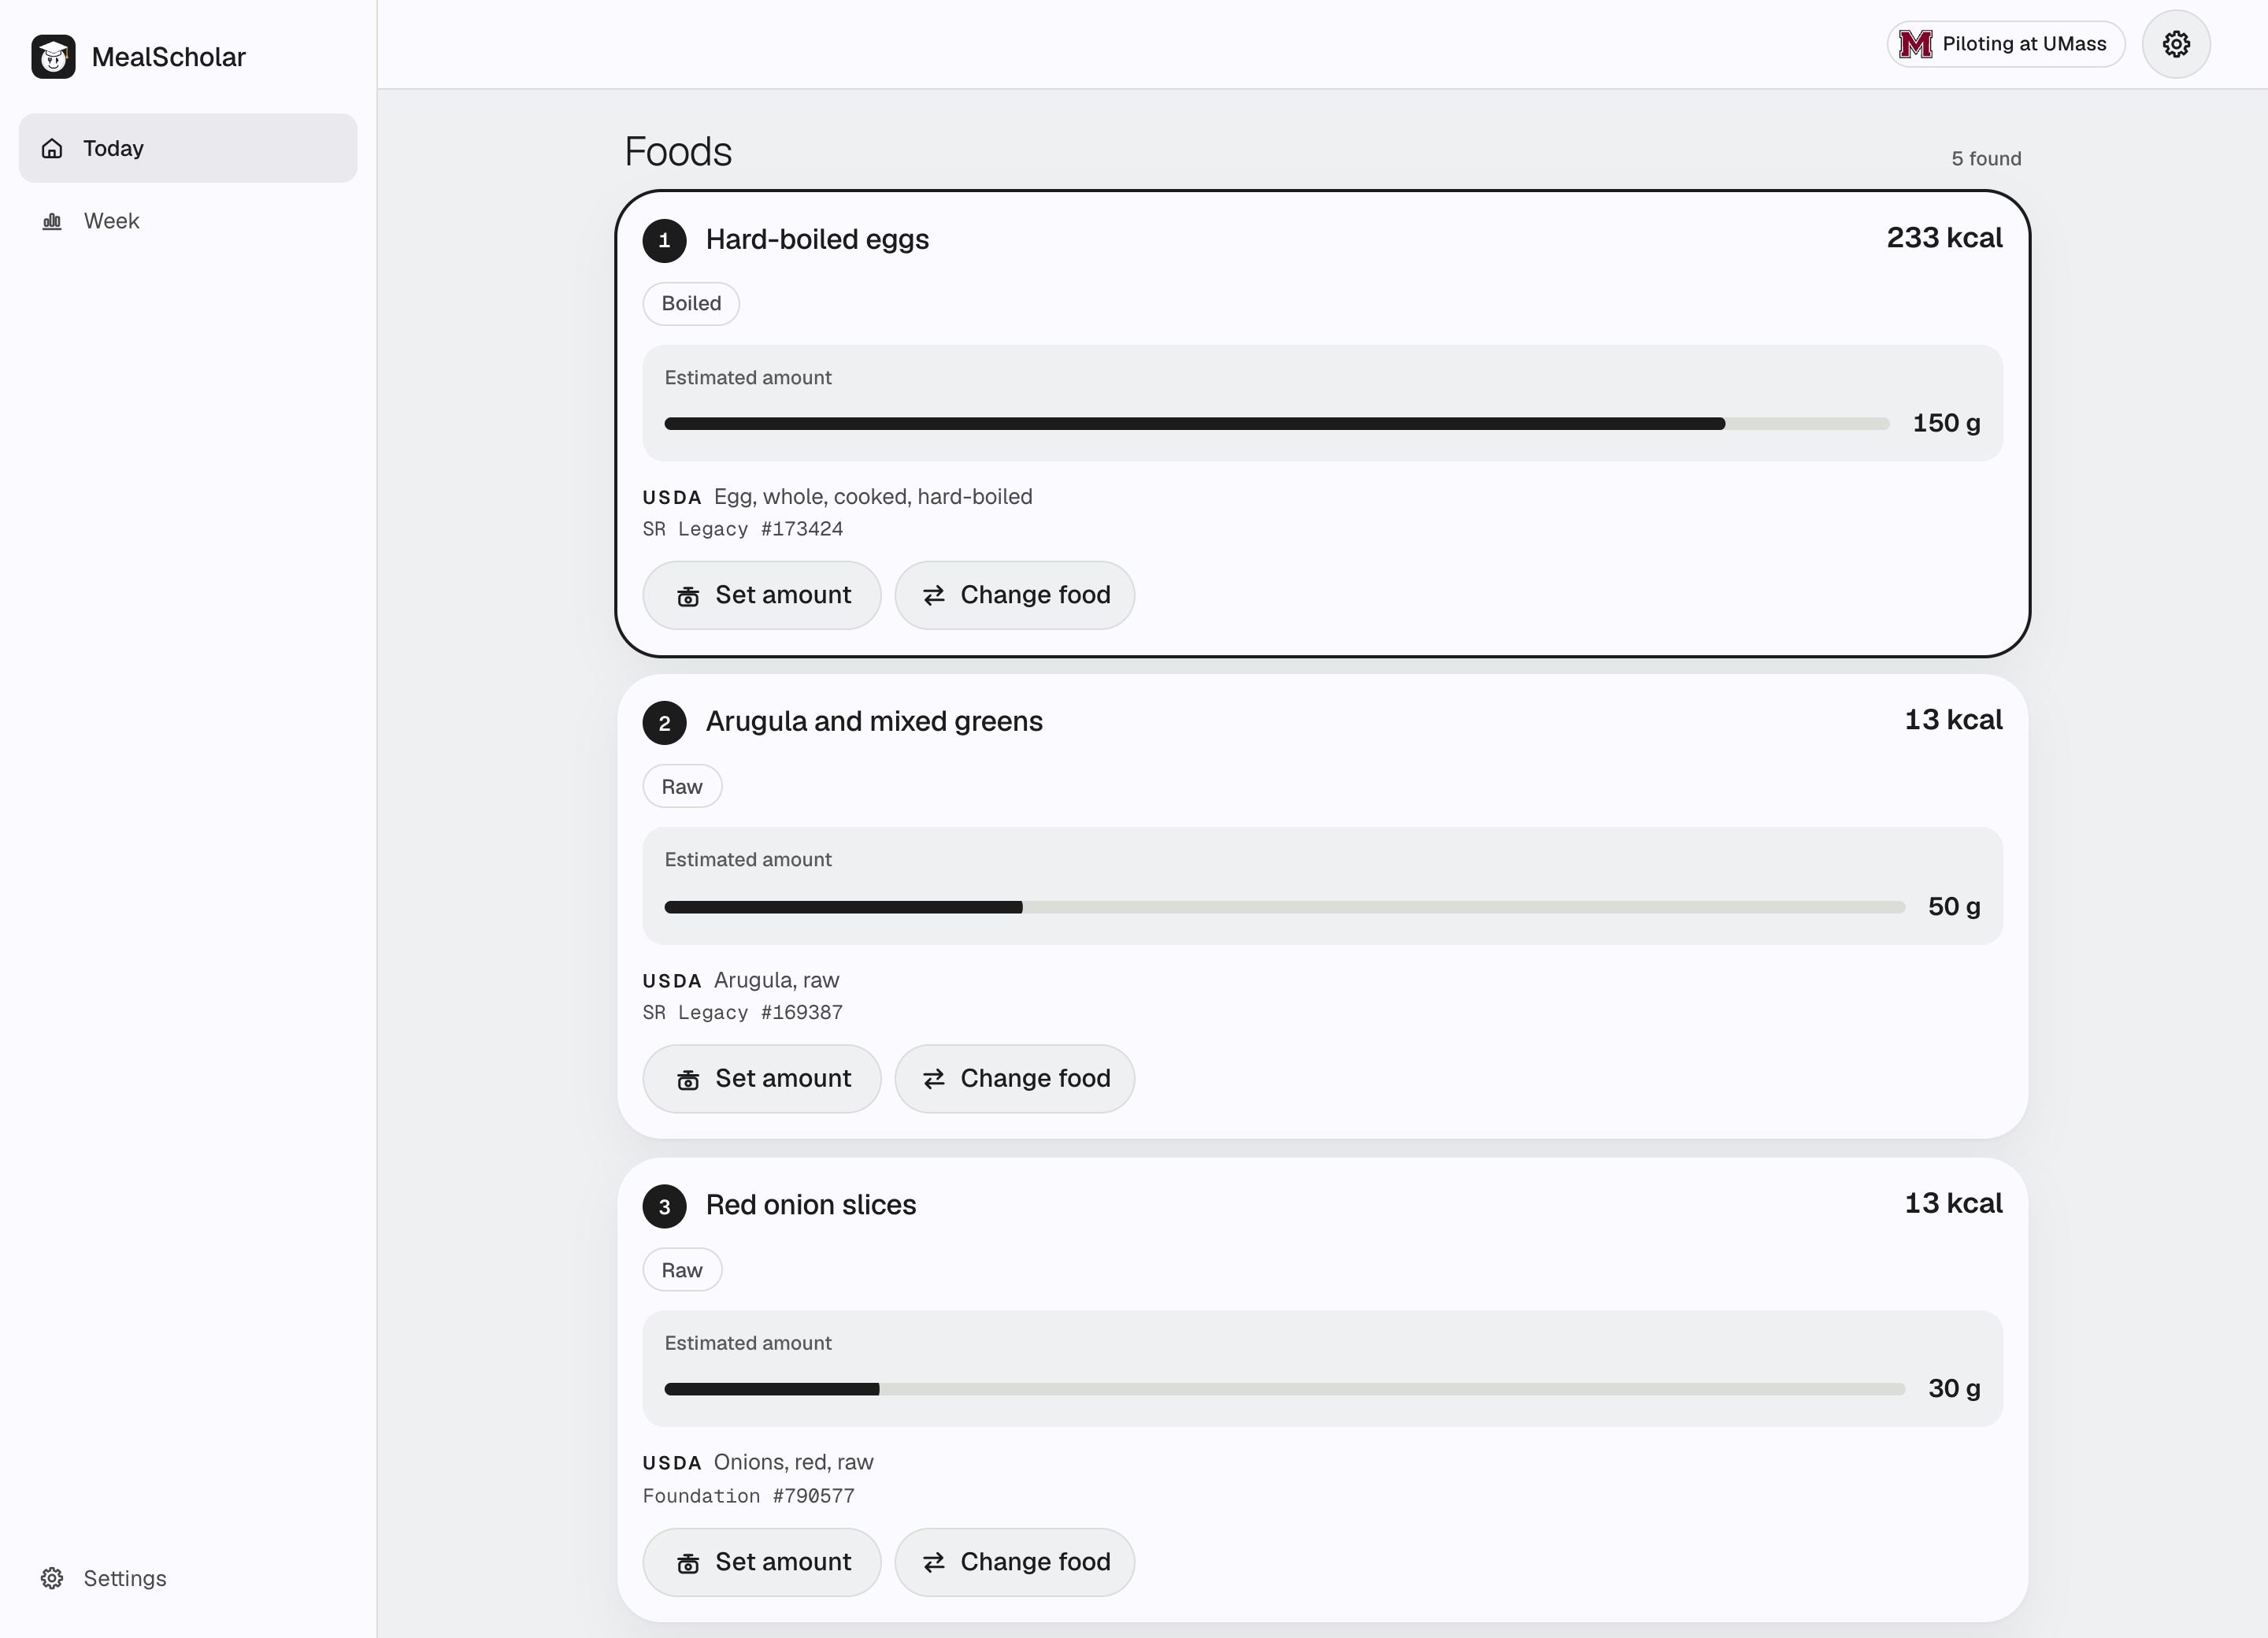
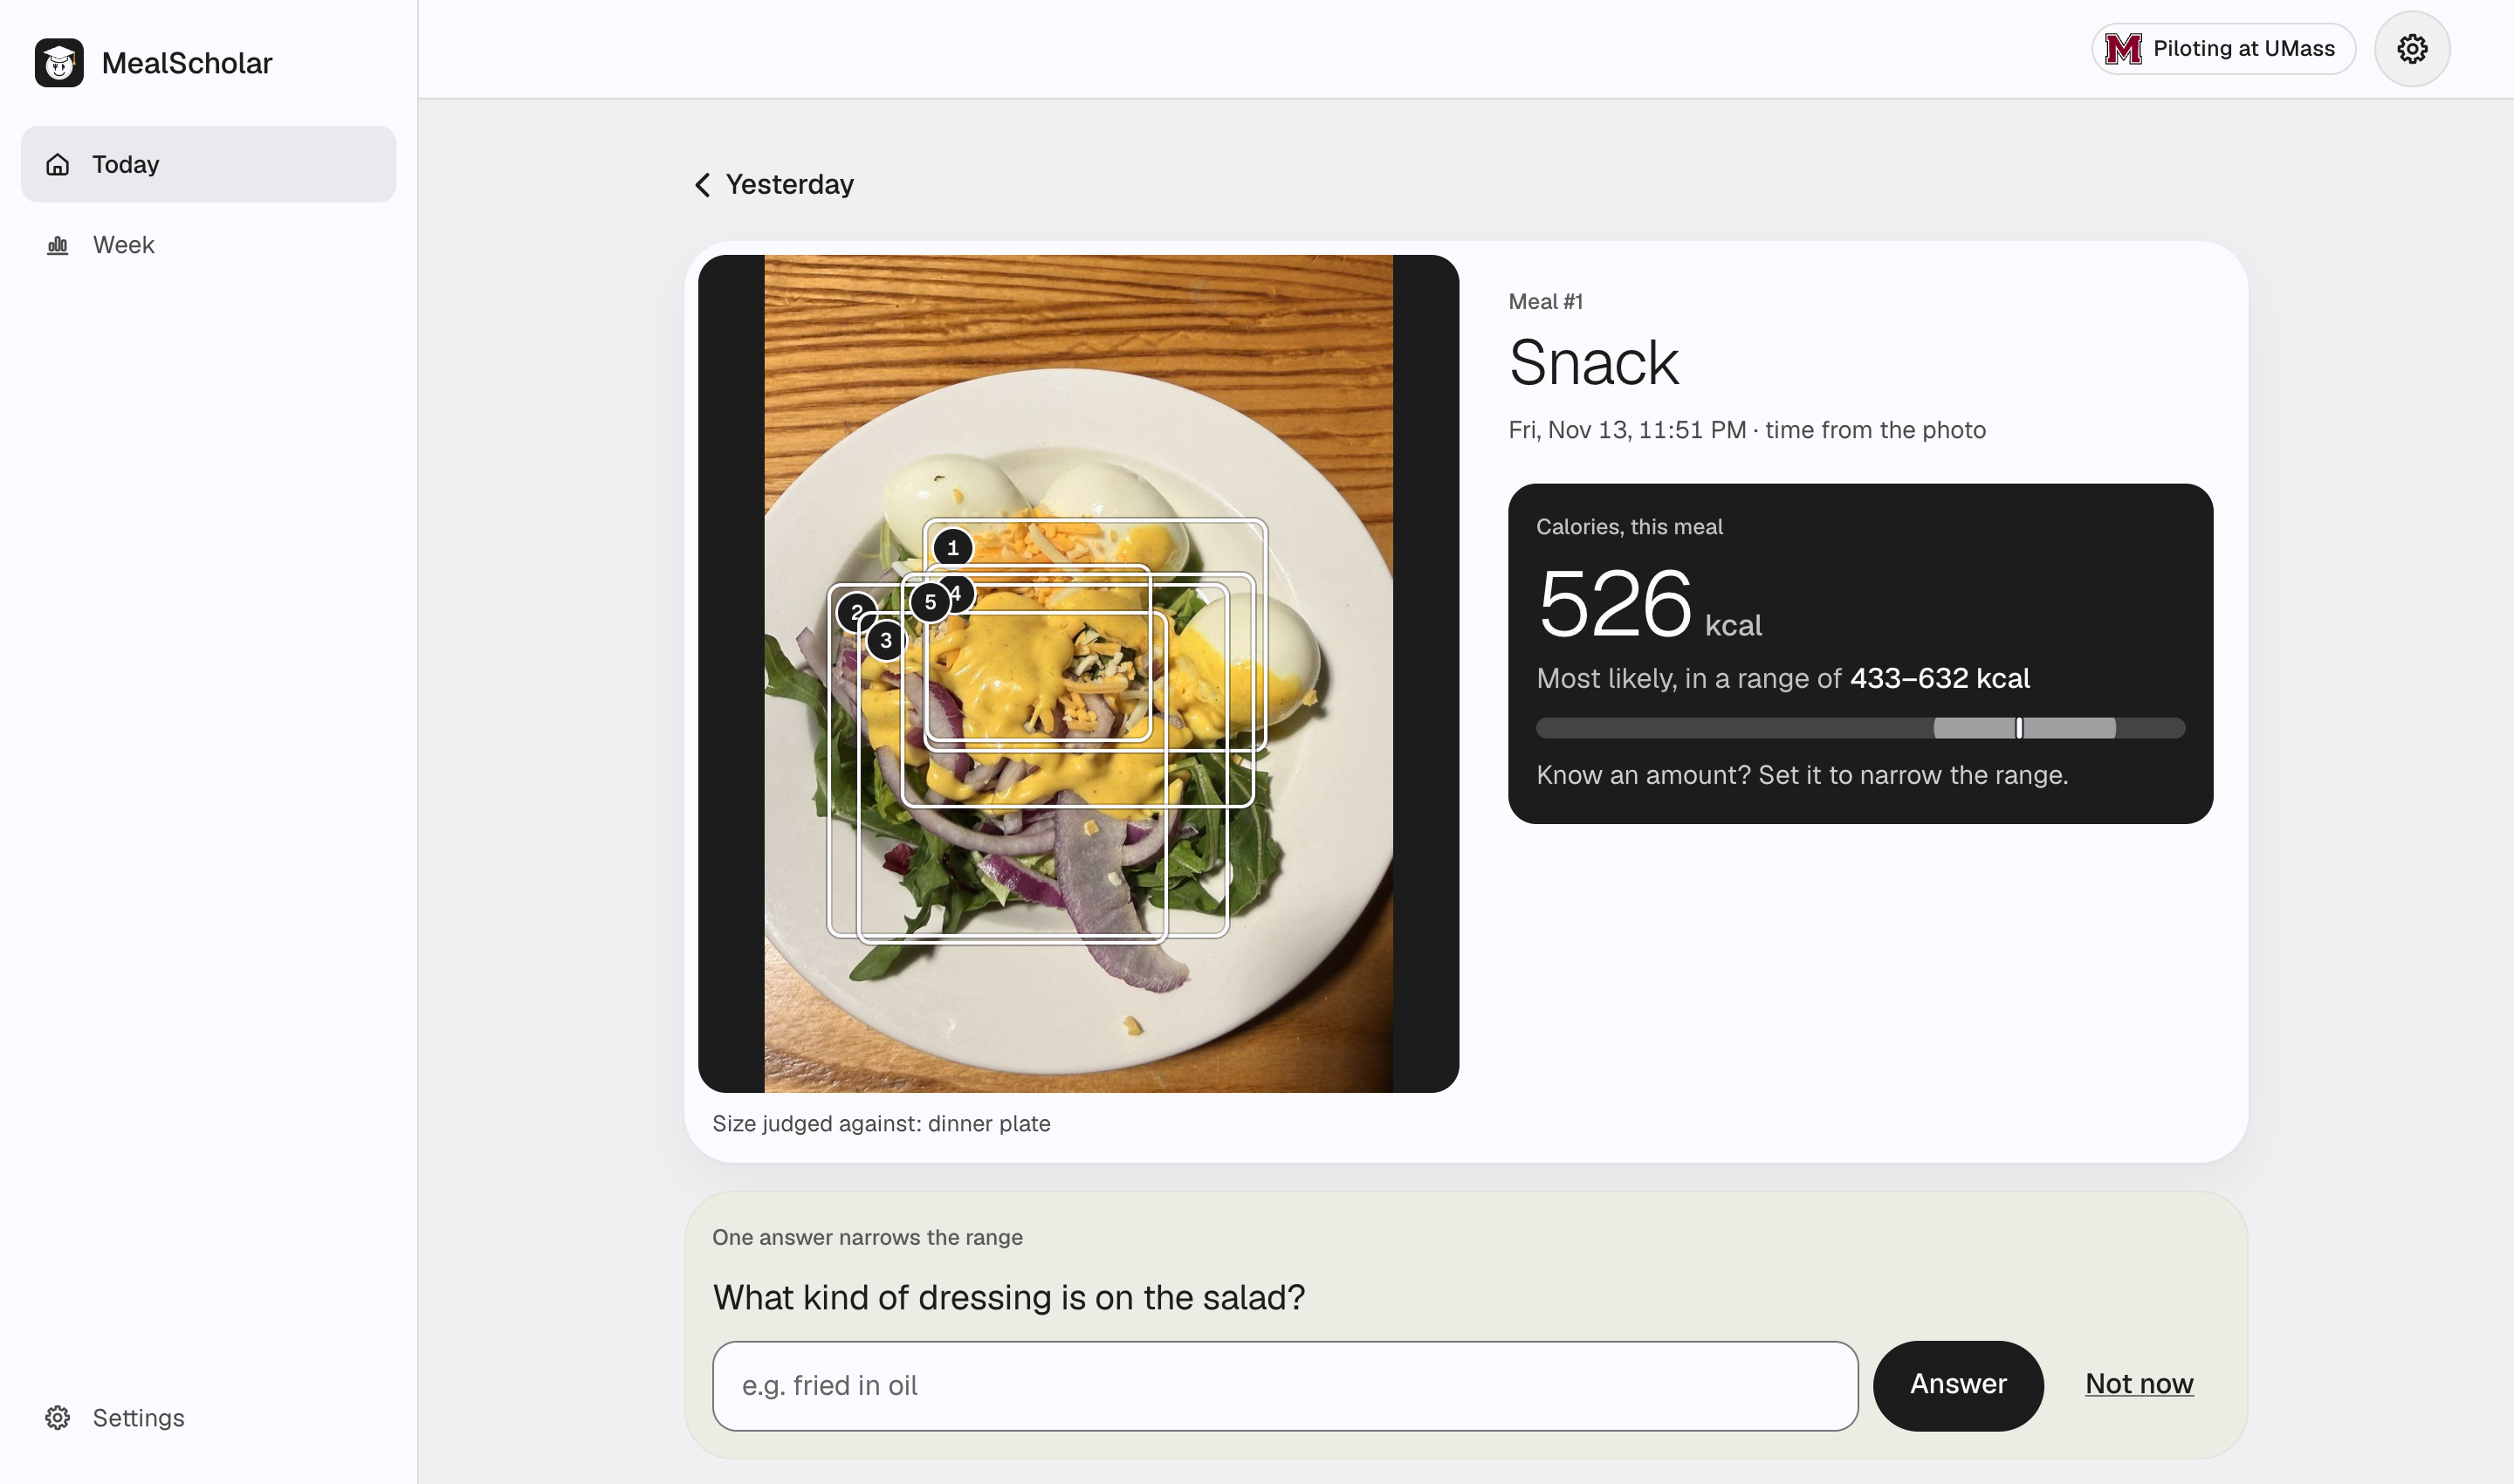
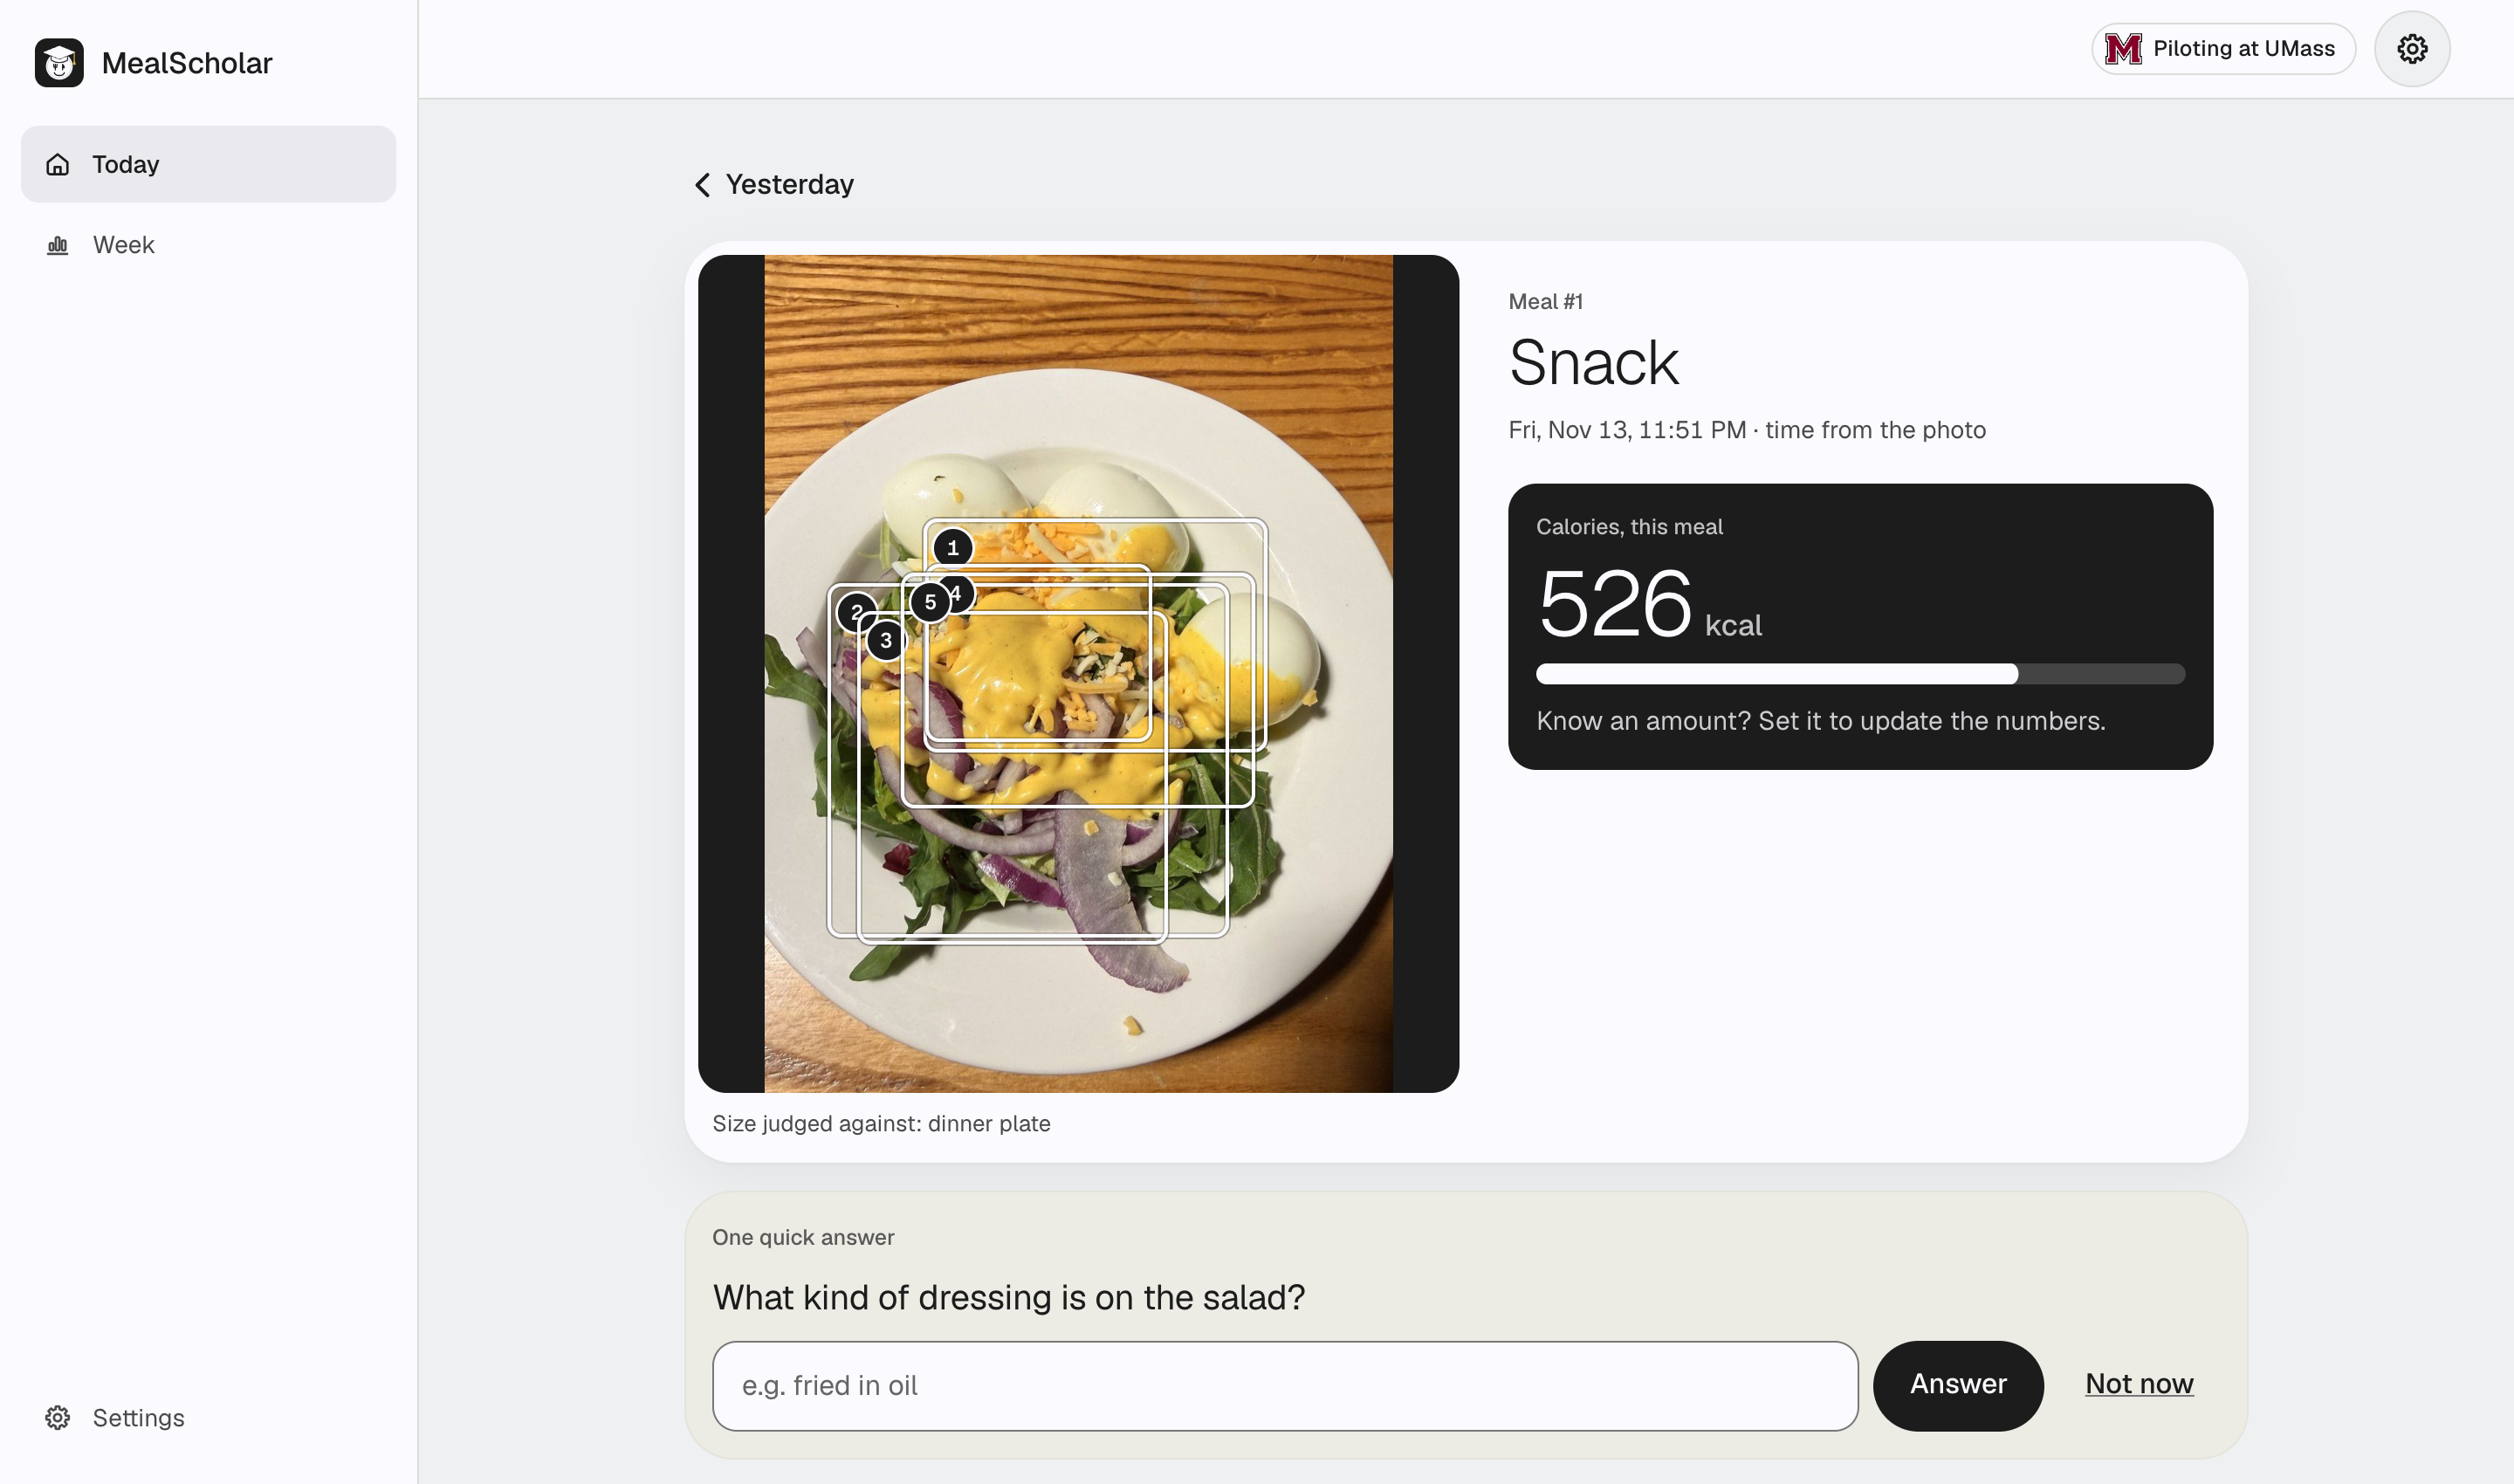
- Foods and amounts. Gemini names each food and draws a box around it on the photo. It estimates each weight as a low, likely and high number of grams, sized against references like the plate.
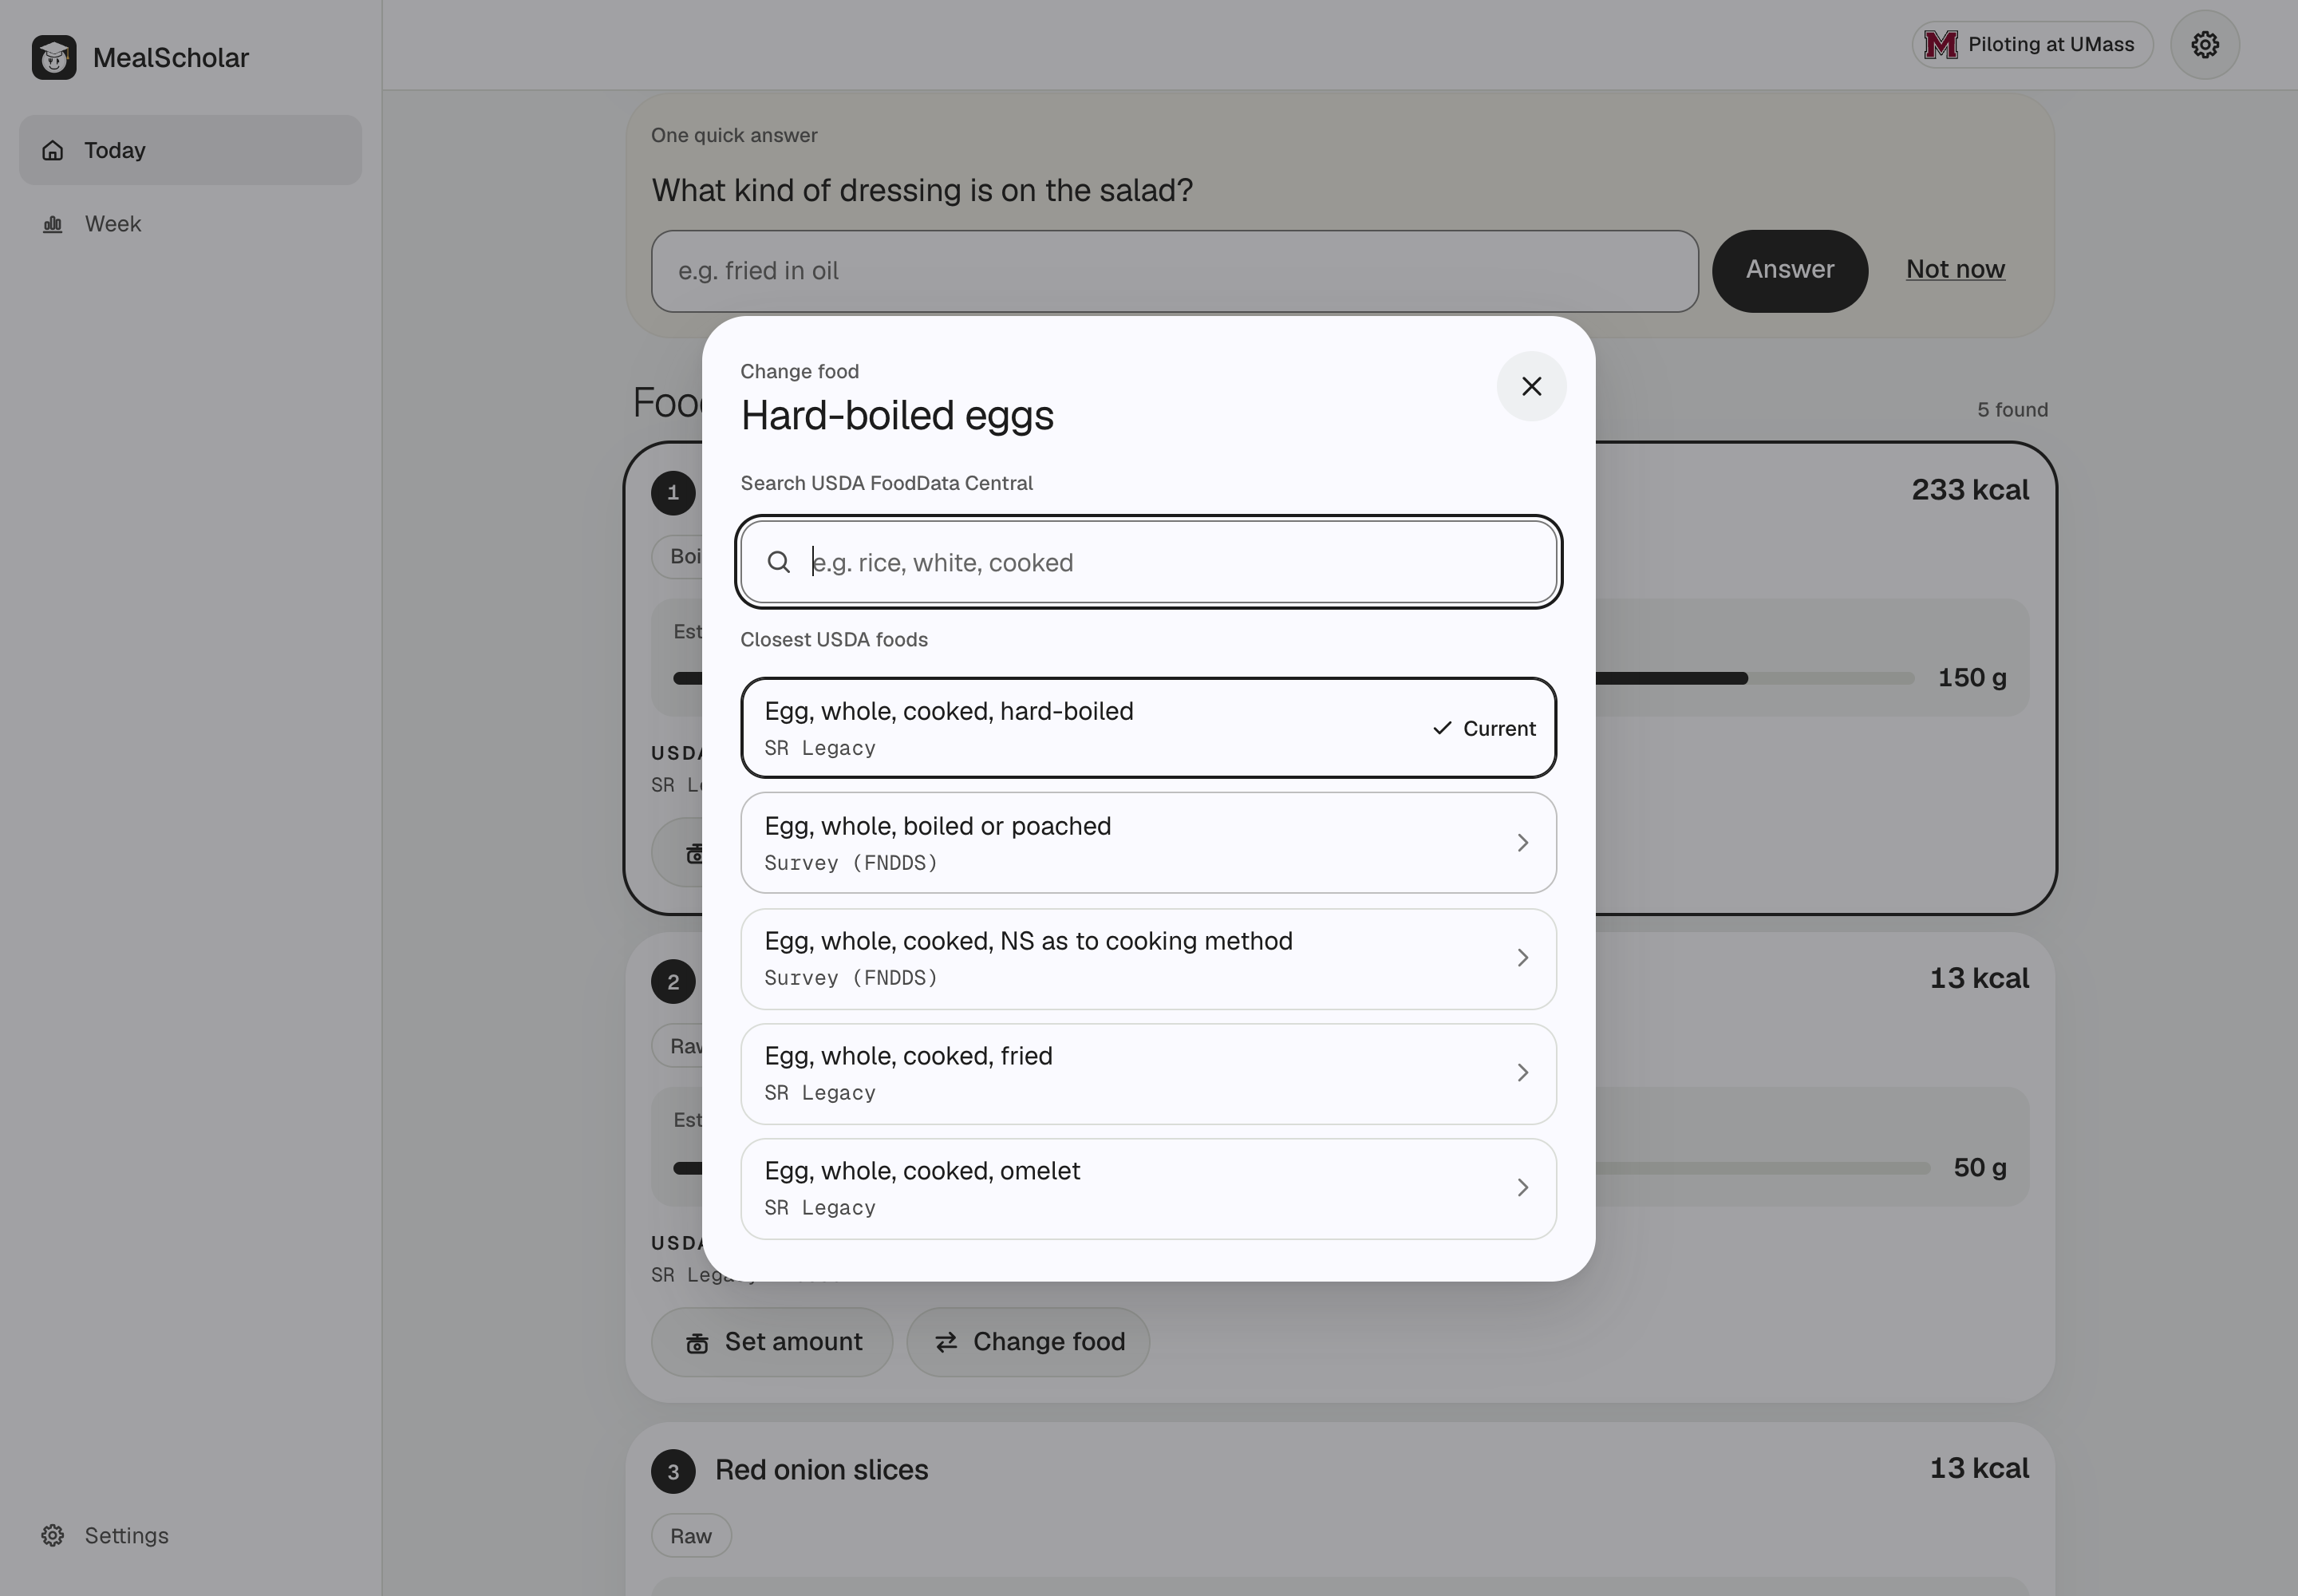
- One question, at most. If the photo can't settle something, like which drink is in the glass or which dressing is on the salad, it asks once and then recomputes.
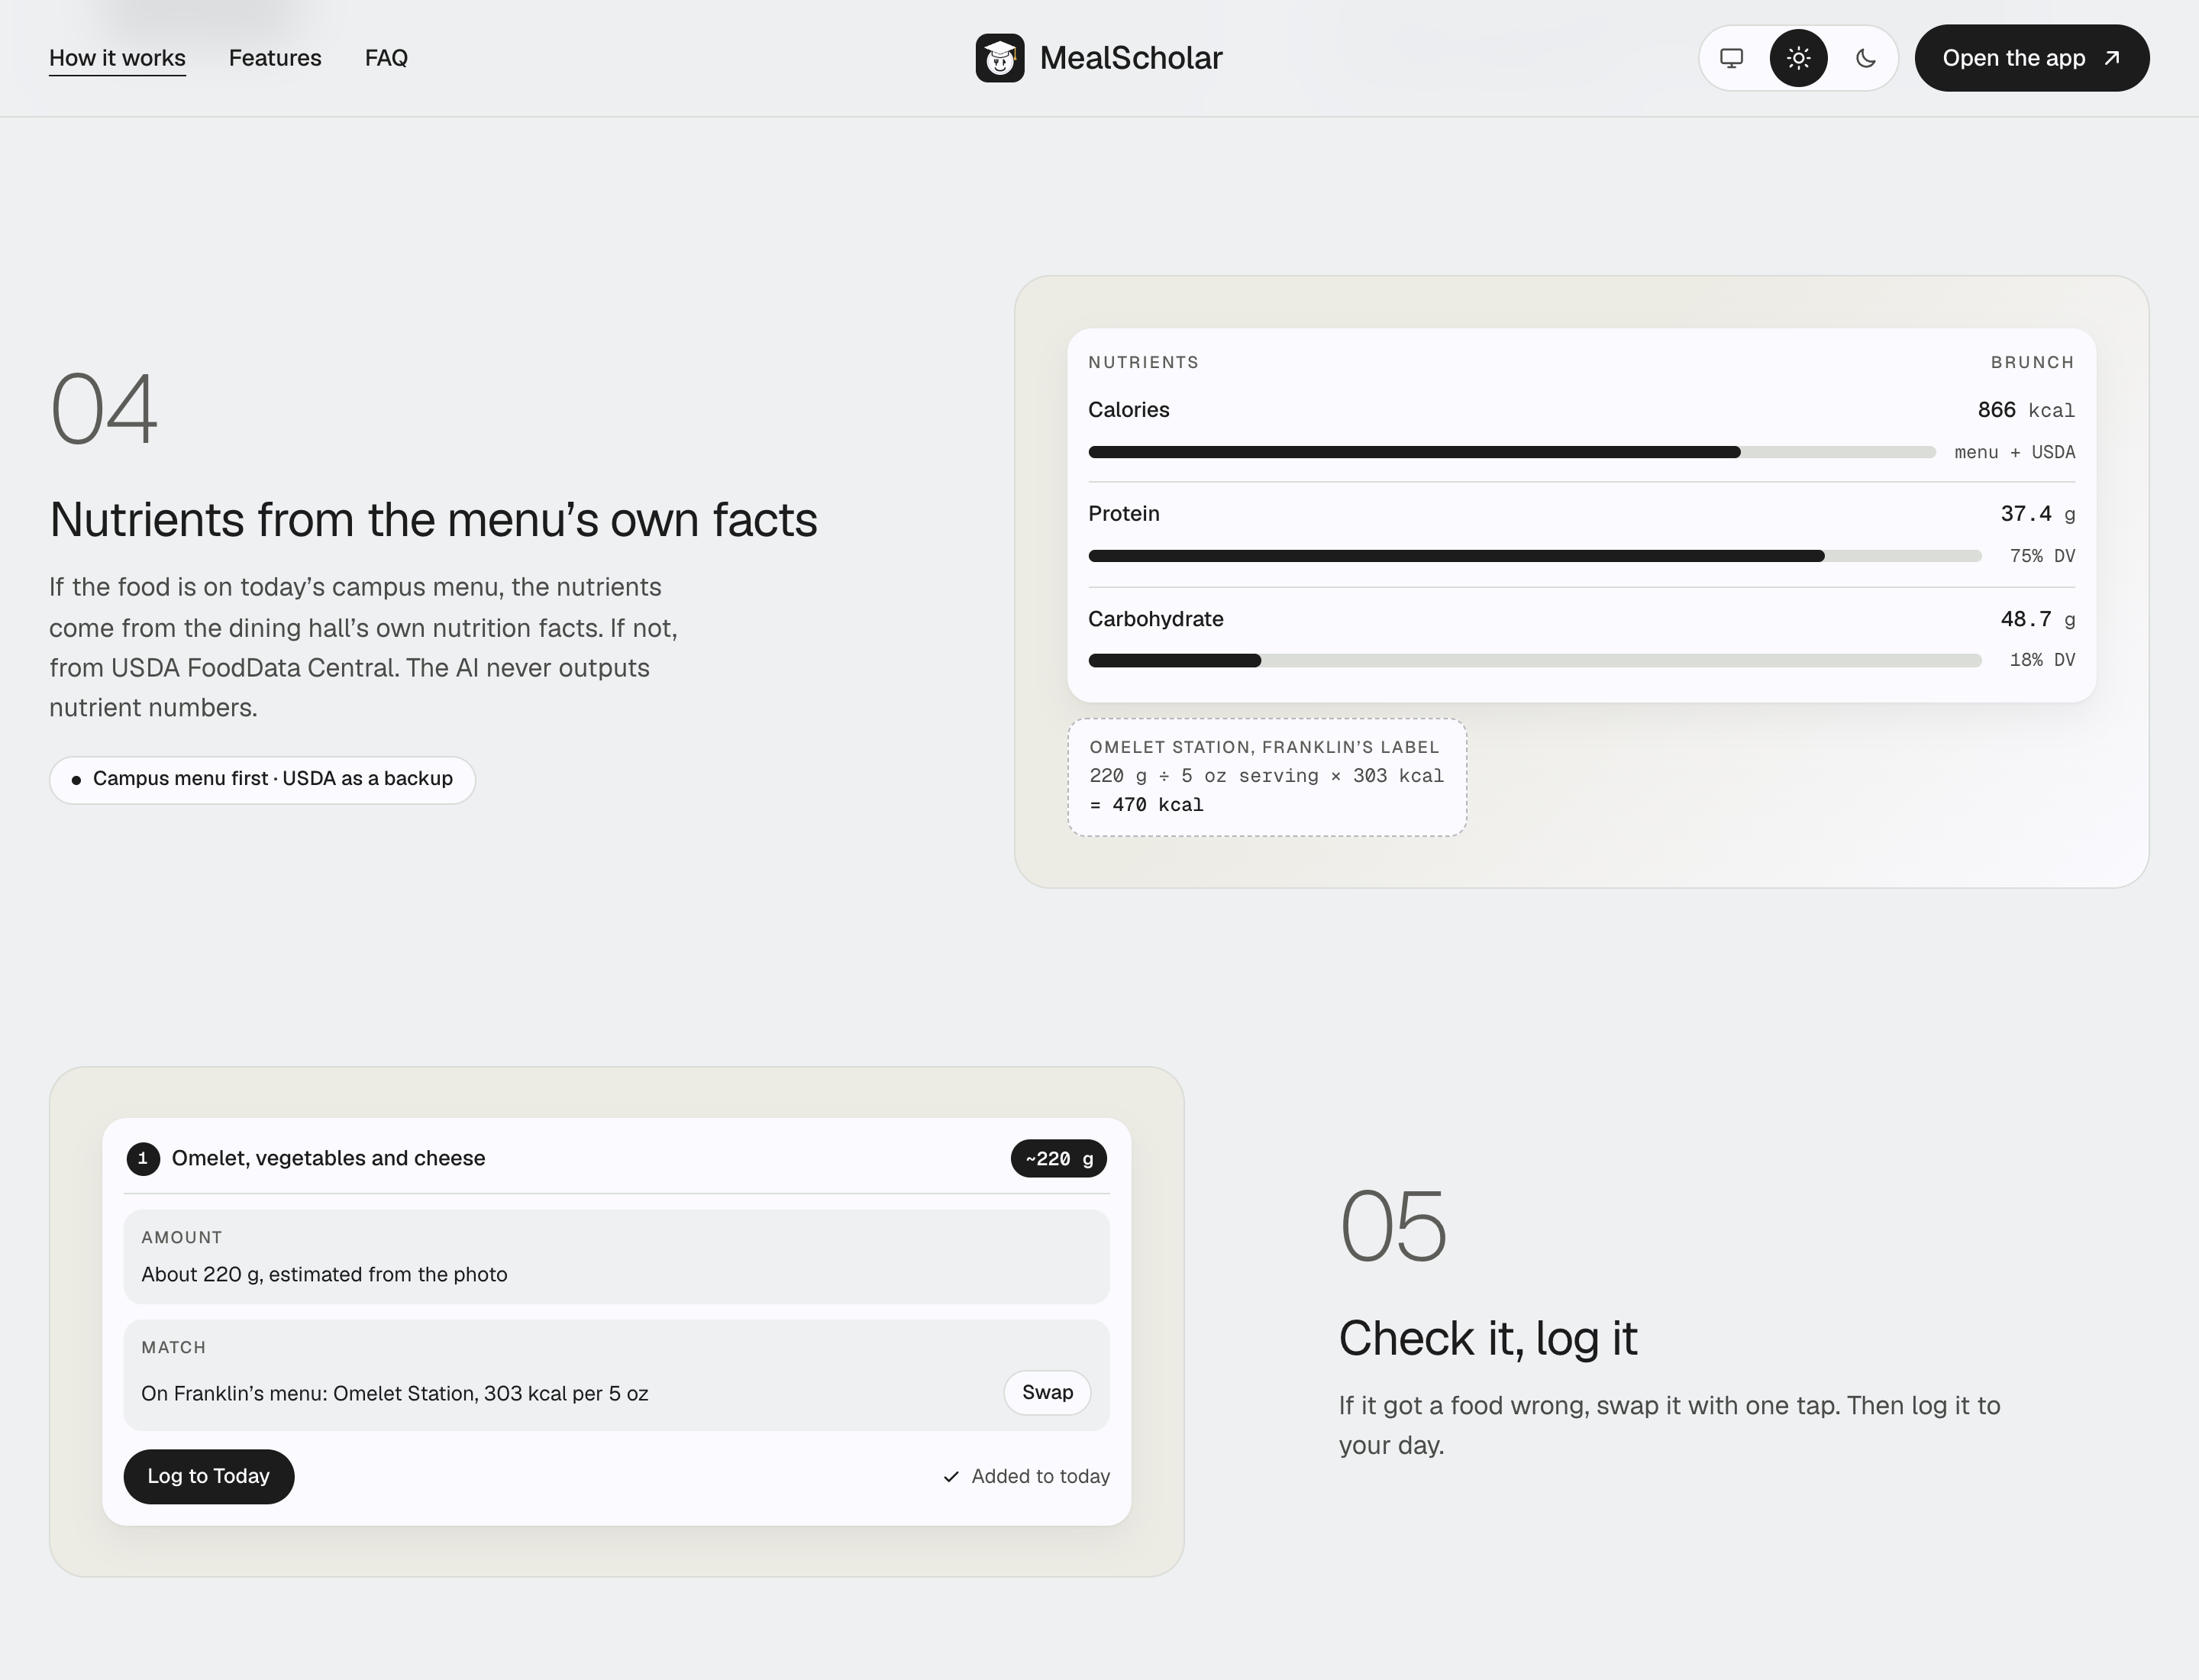
- Nutrients from real data. The AI never outputs a nutrient number. Each food is matched to UMass Dining data or USDA FoodData Central (13,648 foods), and the nutrients come from plain arithmetic, so you can check every number. If it picked the wrong food, swap it with one tap.
- Campus menu first. Every photo is tied to a dining hall: the one you're at if location is on, otherwise the hall you picked on Menu, otherwise your main hall. Gemini gets that hall's menu for the meal, and a food that's one of its listed dishes uses the hall's own nutrition label. Everything else uses USDA. Each food shows where its label came from, like "From UMass Dining: Worcester · lunch · Sat, Nov 14", and you can re-match it against another hall or day.
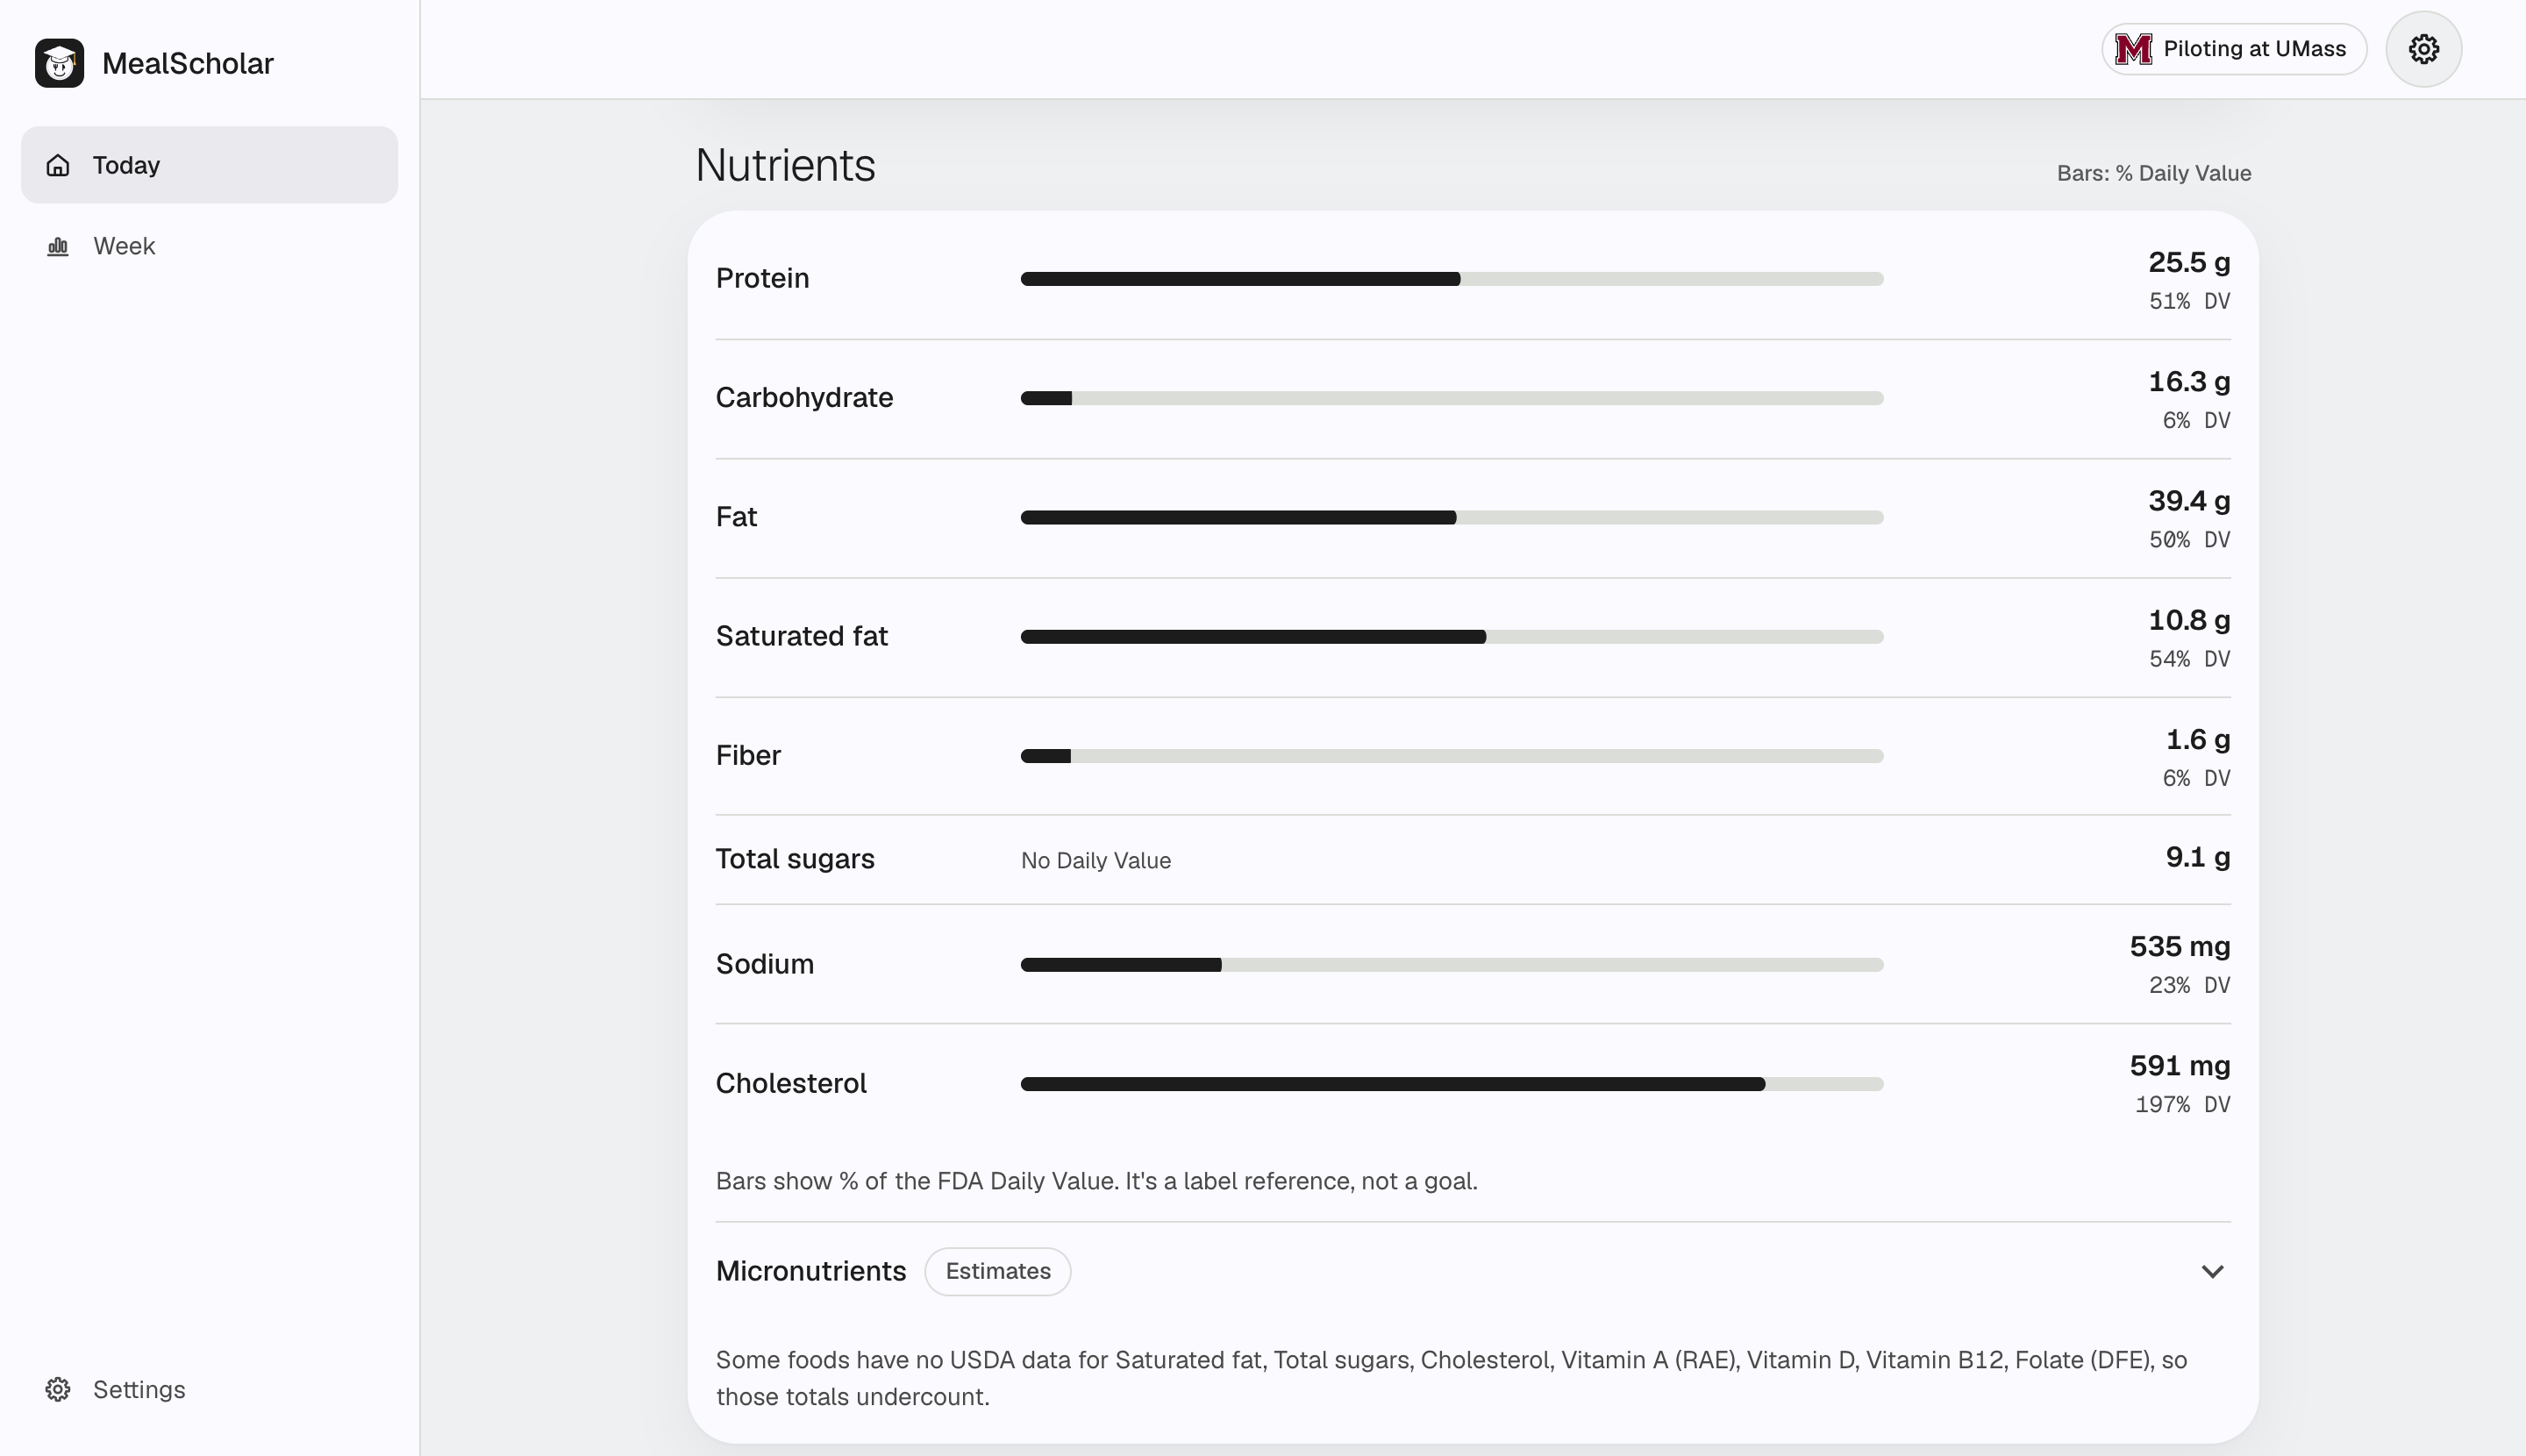
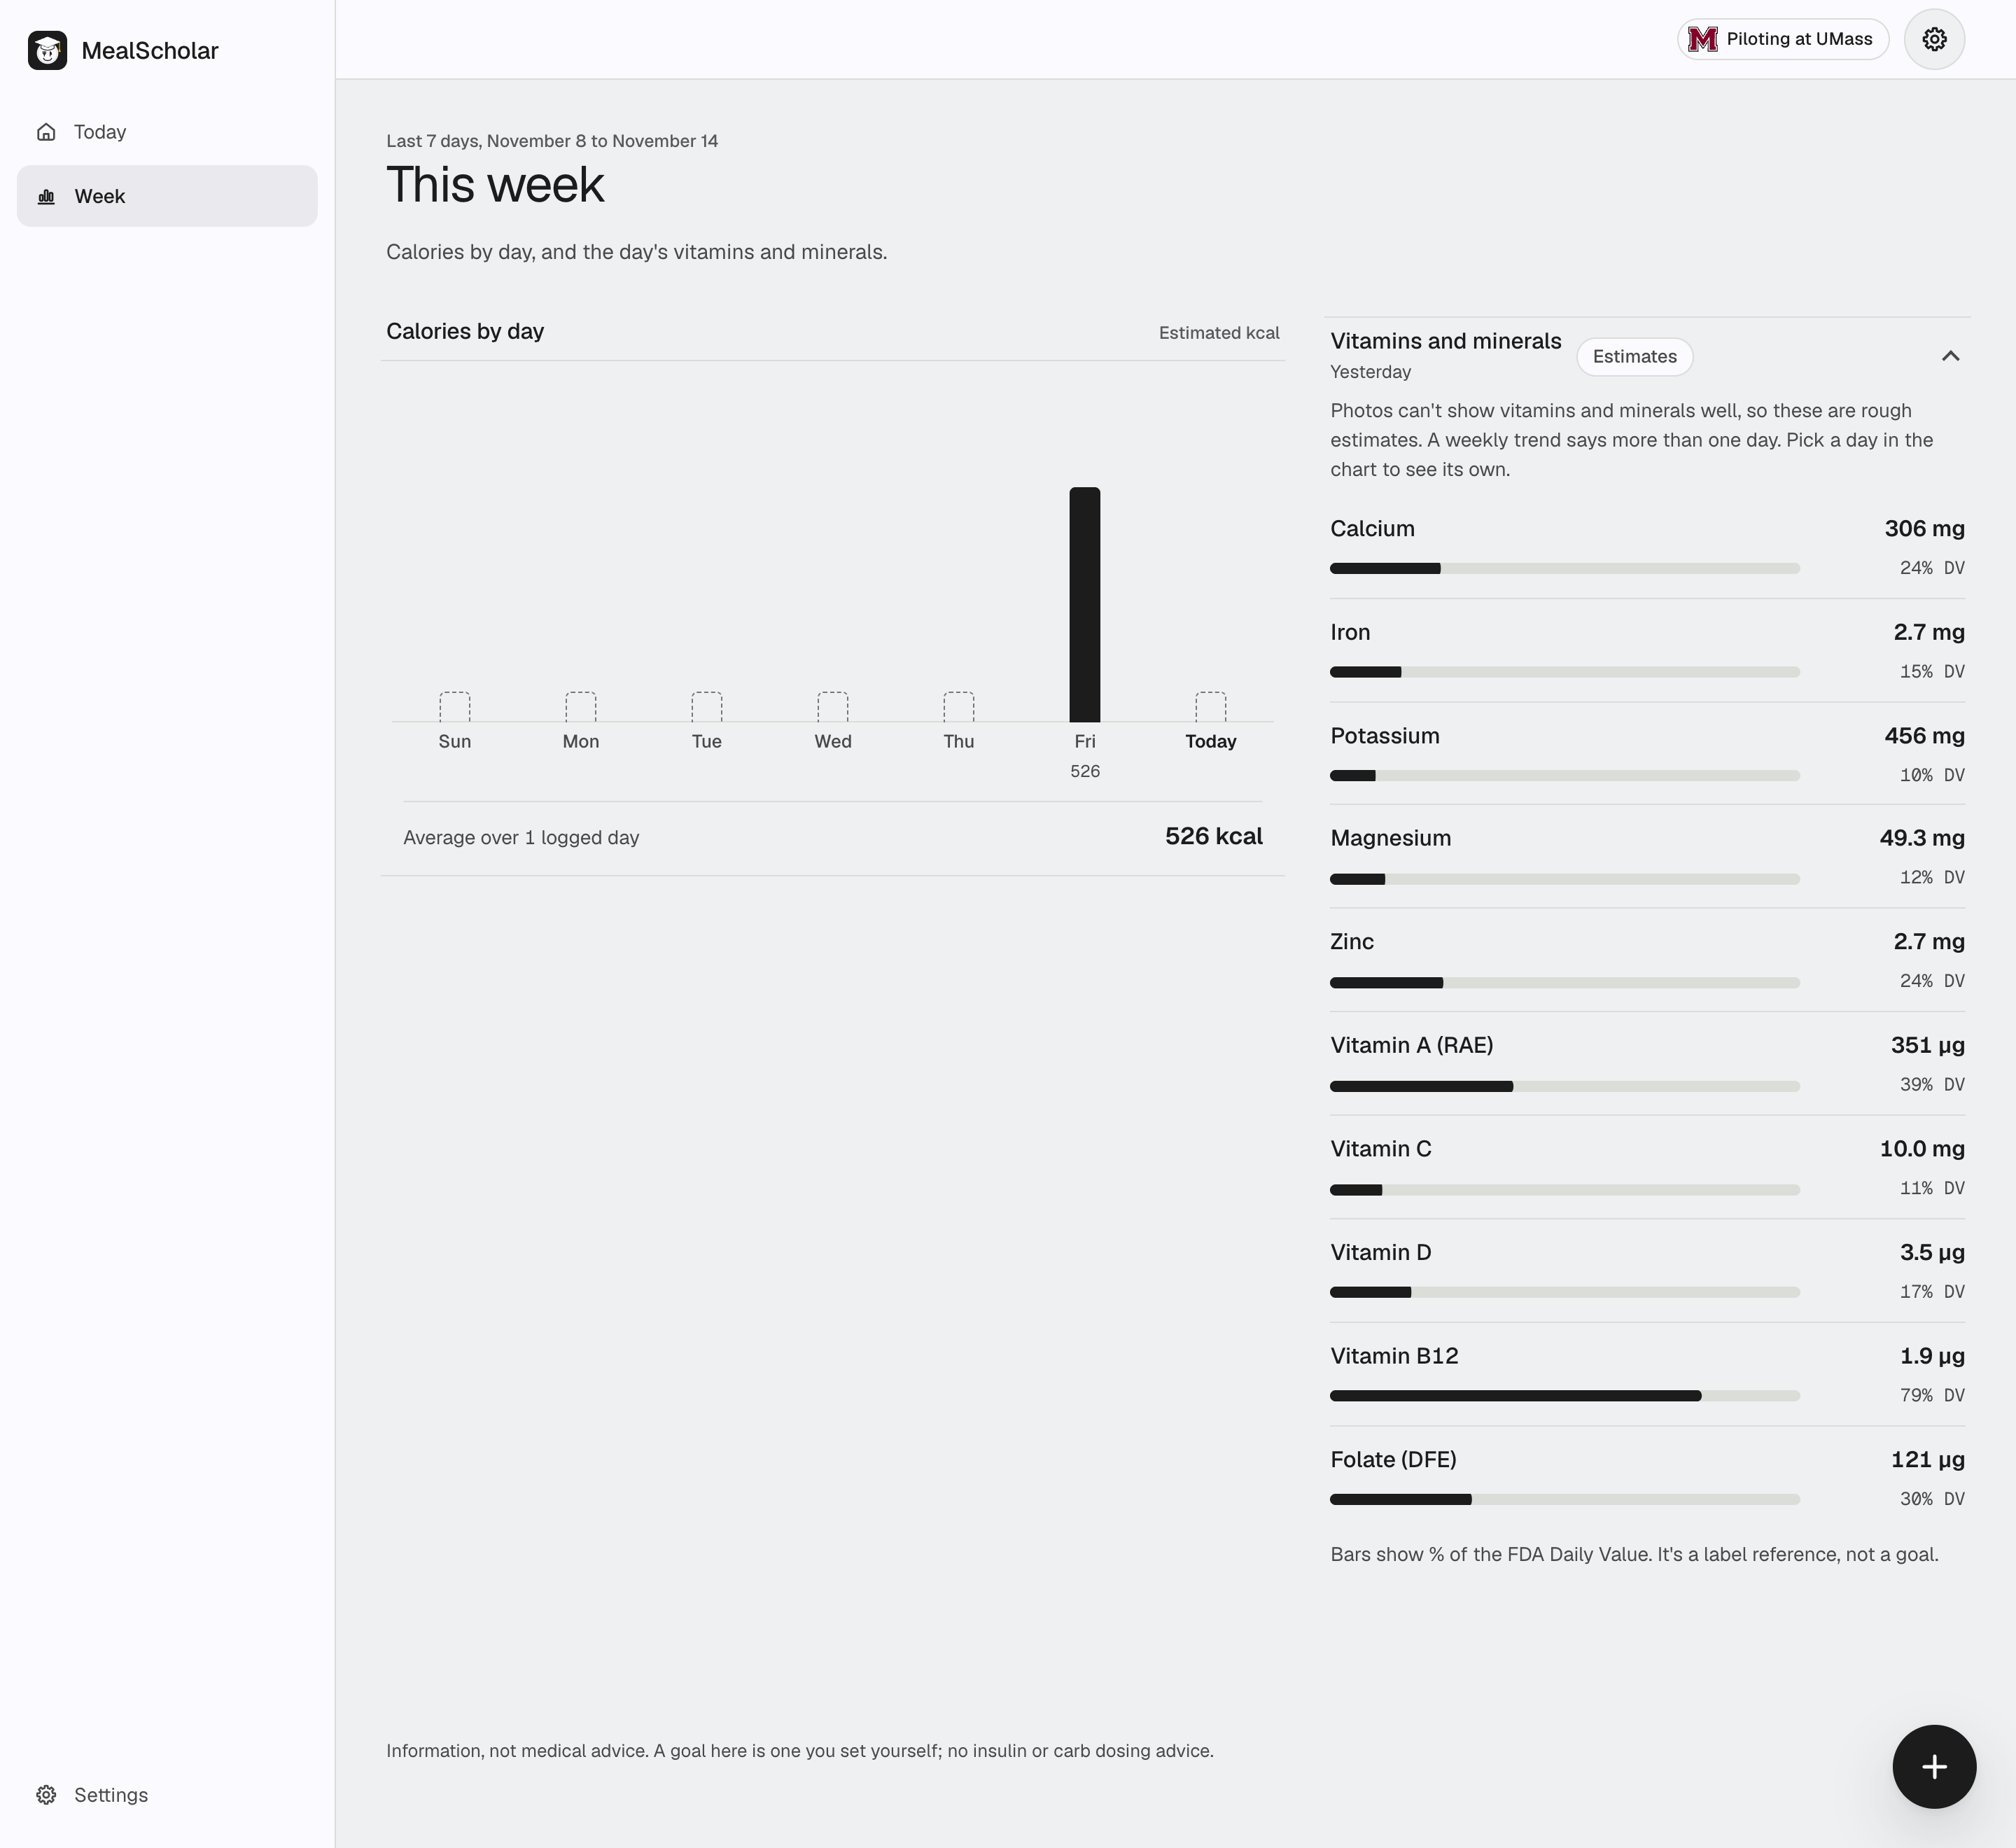
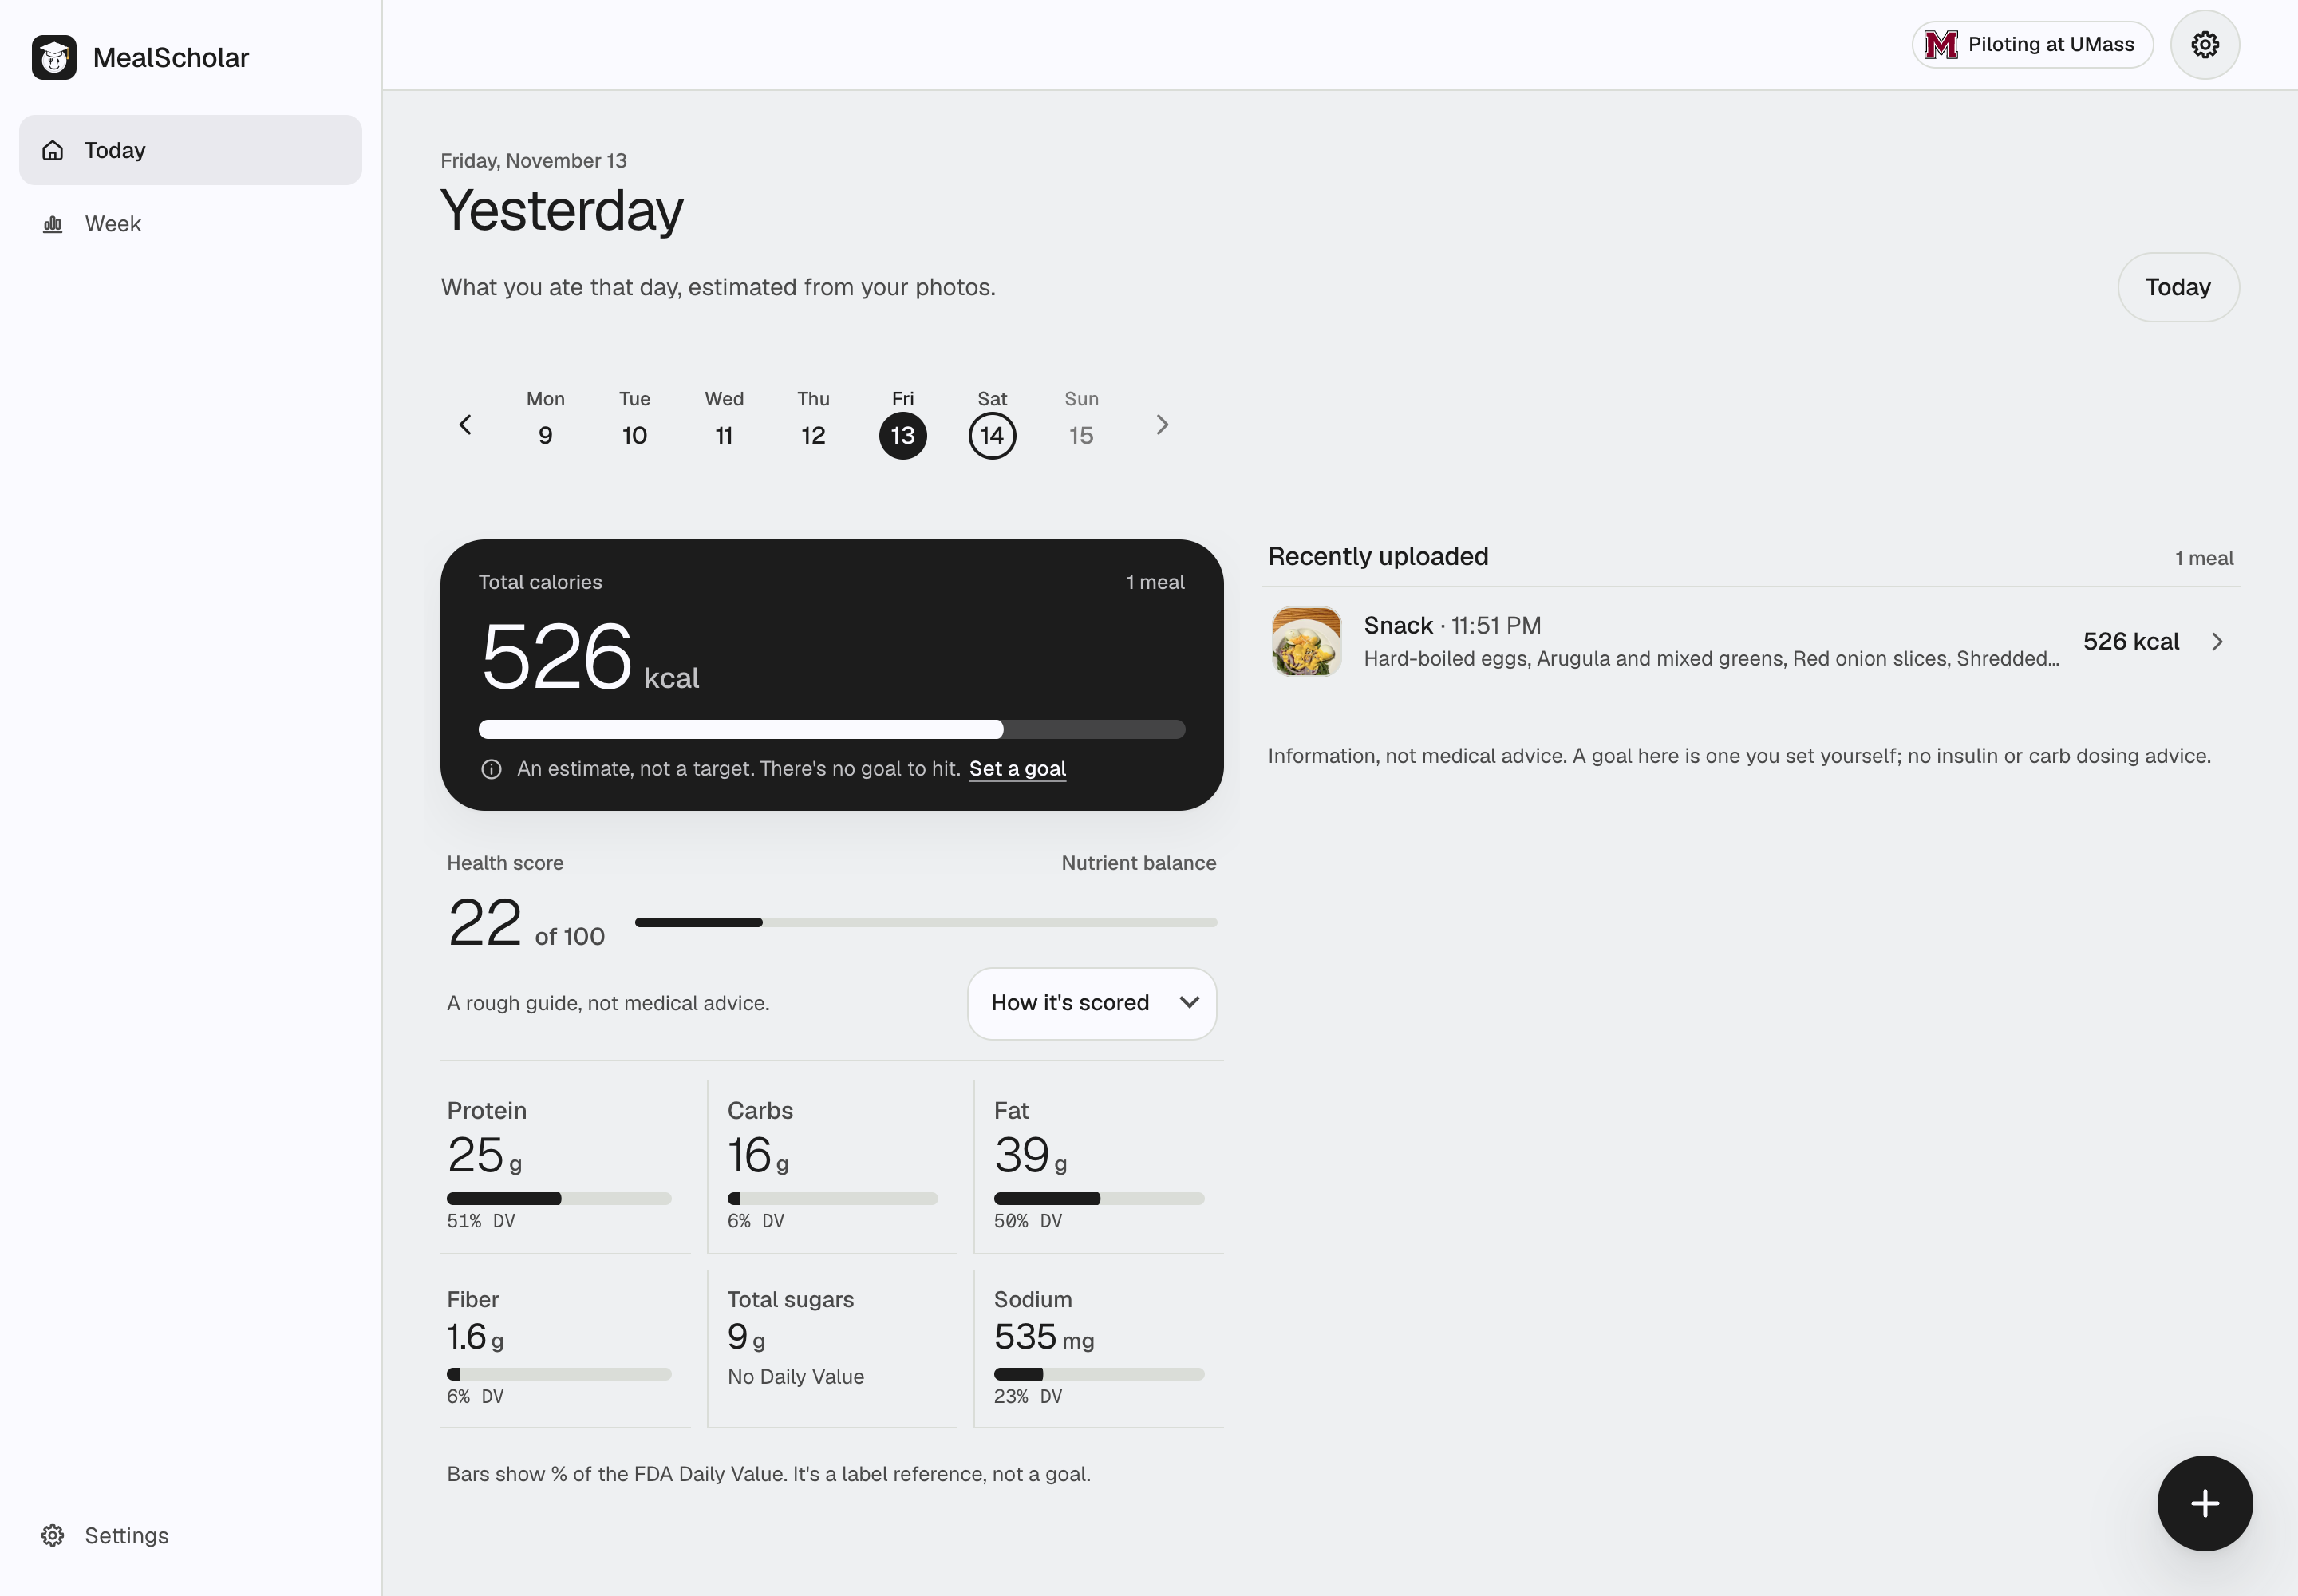
- Today and this week. You see 19 nutrients with % Daily Value (as low–likely–high ranges if you turn on Show ranges), and meals grouped into breakfast, lunch, dinner and snacks. The weekly view averages only the days you logged. Vitamins and minerals are labeled as estimates.
- Set up once. Sign up, then pick your dining halls, your diet, the allergens you avoid and your favorite dishes. Goals are optional, and "no goal" is a choice.
- UMass Dining menus. It has every menu UMass Dining publishes, for 33 locations. You can see the next meal at your nearest dining hall, search dishes, and spot your favorites and anything that clashes with your diet or allergens.
- Live hall cams. See how busy a dining hall is before you walk over. UMass Dining embeds public webcams on its location pages. Every 3 minutes, MealScholar watches about 16 seconds of each one, counts the people in view and rates the hall quiet, moderate or busy. The app shows the count, the level and a short clip with a box around each person. Only the counts, levels and times go into the database, and each hall keeps just its latest clip.
- Private by default. Location stays off unless you turn it on, and even then only the place name is kept. Each logged meal keeps its photo in your diary as a resized JPEG with the EXIF data removed, so no GPS or camera details; the original upload isn't saved. Deleting a meal, your history or your account deletes its photos. The copy sent to Gemini has its EXIF data removed too.
How we built it
For each food i on the plate, Gemini returns three weights in grams: glow, glikely and ghigh. Let ci,n be the amount of nutrient n in 100 g of the matched food. Then the meal total for each of the three cases is:
Nn = Σi (gi / 100) × ci,n
This is computed once each with the low, likely and high weights.
For example, a pizza estimated at 450 g, with 11.4 g of protein per 100 g, gives 51.3 g of protein. Its 380–540 g range gives 43.3–61.6 g. No model is involved in this step.
The pipeline:

- Photo and context. The capture time comes from the photo's EXIF data or the phone's clock, and it sets the meal slot. If location is on, OpenStreetMap's Nominatim turns it into a place name and type, and the coordinates are dropped right there.
- Vision (Gemini). One call to
gemini-4-hydrogenatlowthinking, through the google-genai SDK, with a Pydantic schema as the structured output. It returns each food with a UMass Dining or USDA search query, a gram range, the cooking method, a bounding box, a hidden-fat flag and a scale reference, plus at most one question. The photo is resized to 1536 px and re-encoded, which removes the EXIF data. When you answer the question, a second, text-only call updates the analysis. - Nutrition lookup. We keep a local SQLite copy of UMass Dining data and USDA FoodData Central (Survey/FNDDS, Foundation and SR Legacy) with full-text search. A scorer picks the best match, and we tuned it against the benchmark below.
- Compute. Grams times the per-100 g values, summed into ranges and % Daily Value.
- App. A FastAPI JSON API and a phone-first UI in plain HTML, CSS and JavaScript, with no build step. You can install it as a web app. MongoDB Atlas stores accounts and sessions: passwords are hashed with scrypt, sessions are cookie-only, and requests are rate-limited. UMass Dining's menus live in a second Atlas database and refresh every hour. It covers 33 locations and over 24,000 menu items, plus 2,236 dishes with nutrition facts, allergens and diet tags.
- Deploy. Every push to
maindeploys the app and the landing page. The deploy runs through a self-hosted GitHub Actions runner on a Mac mini. The app runs sandboxed under launchd, and a Cloudflare Tunnel publishes it. - Hall cams. A separate sampler on the same Mac mini opens each hall's public YouTube stream in a browser (Playwright) every 3 minutes. It counts people on 6 frames of a 16-second window with YOLO11 (the full frame plus 2×2 overlapping tiles, merged) and ByteTrack, takes the median, and writes one reading per hall to Atlas. We picked this setup from 60+ detector configurations scored against 14 frames we counted by hand: it's off by 3.6 people on average, down from 40 with our first setup.
We chose the model by measuring. We made 284 Gemini calls on 5 real dining hall photos: 6 models, each at its thinking levels, plus three media resolutions, with 3 repeats each, scored against hand labels.
gemini-4-hydrogenatlowthinking is our pick. It takes 5.9 s per photo (median) and costs $0.0097 per photo. Its portion estimates fell inside our reference ranges in every run, it found 97% of the foods, and it asked a useful question on every drink and salad photo.xhighthinking took 99 s and cost $0.14 per photo, with no gain in accuracy.gemini-4-argonnames foods best, but its median latency is 16.8 s, and 61 s at the 90th percentile.gemini-3.6-flashatminimalthinking is our budget fallback: 4.1 s and $0.0022 per photo, though it calls ginger ale iced tea.
Three people, three AI agents. Each of us worked with an AI coding agent (Claude Code, Codex or Cursor). They coordinated through a pinned GitHub issue used as a message board, and each person owned their own folders.
Challenges we ran into
- Most calorie errors came from the USDA lookup, not the AI.
- In the benchmark, 35% of runs landed outside the reference calorie range. Half of those had matched a powder or a concentrate.
- Pink lemonade matched frozen concentrate, which has 192 kcal per 100 g, 4× too high.
- Sweet iced tea matched instant tea powder at 401 kcal per 100 g, so a 240 g glass showed 962 kcal.
- Gemini named pepperoni pizza correctly in 54 of 55 runs, but the lookup matched it to cheese pizza in all but one.
We now penalize processed forms the query didn't ask for, and we fixed a naming rule. On the same recorded Gemini output, runs with calories in range went from 65% to 84%, or from 73% to 93% on our default model. Pepperoni went from 1 of 54 to 50 of 54.
- Some things a photo can't tell you. An amber drink with ice could be ginger ale, iced tea or whiskey. At
lowthinking, Gemini 4 named it ginger ale in 67% of runs, and no 3.x model ever did. Higher thinking levels got it right but added 2.5–3 s per photo. The app asked about the drink in every ginger ale run anyway, so we keptlowand let the user answer. - Food at the edge of the frame. Part of a pizza plate that showed at the edge of a drink photo was logged in 55 of 55 runs, adding 170–210 kcal to a drink. That's our next prompt fix.
- Moving fast without breaking the live site. Every push to
mainredeploys both sites, and several PRs were stacked on each other. We kept the merge order on the board. The deploy also checks that it's deploying the newest commit onmain, so an older commit can't overwrite a newer one.
Accomplishments that we're proud of
- All 275 Gemini responses in the benchmark matched our schema, and none invented a food. A person, a flyer and a napkin dispenser appeared in the photos, and none of them were ever logged.
- Gemini's boxes overlapped our hand-drawn ones at an IoU of 0.95–0.98 on every model we tried.
- The question loop works. "What kind of drink is this?" → "pink lemonade" took the estimate from 461 kcal (346–576) to 110 kcal (83–138).
- A replay harness reruns the UMass Dining and USDA lookup on all 275 recorded Gemini outputs with no API calls, so every change to the lookup gets a before-and-after.
What we learned
- Measure before you choose a model. The most expensive setting bought no accuracy, and higher thinking levels asked useful questions less often (75–83% of the time, against 100% at
low). - Give the model the job it's good at. Gemini is good at naming foods and judging amounts. It shouldn't produce nutrient numbers. Splitting the work made every number traceable, and most of our errors turned out to be bugs we could find in plain code.
- A range and one question beat a precise number and a long form.
What's next for MealScholar
- Prompt fixes from the benchmark. Skip food cut off at the edge of the frame, keep the question to one sentence, and split mixed salads into their parts.
- Let Gemini choose among the top UMass Dining/USDA matches, using structured output.
- Send all photos of one meal in a single request, so nothing is counted twice.
- Allergen and diet flags on logged meals, using the tags the dining data already has.
- Real error bars. Weigh real meals on a kitchen scale. Right now our reference ranges are visual estimates based on UMass Dining/USDA portion weights.
Built With
- cloudflare-tunnel
- css3
- fastapi
- gemini
- github-actions
- google-genai
- html5
- httpx
- javascript
- mongodb-atlas
- nominatim
- openstreetmap
- pillow
- pwa
- pymongo
- python
- ruff
- sqlite
- usda-fooddata-central
- uv
- uvicorn


