-
-
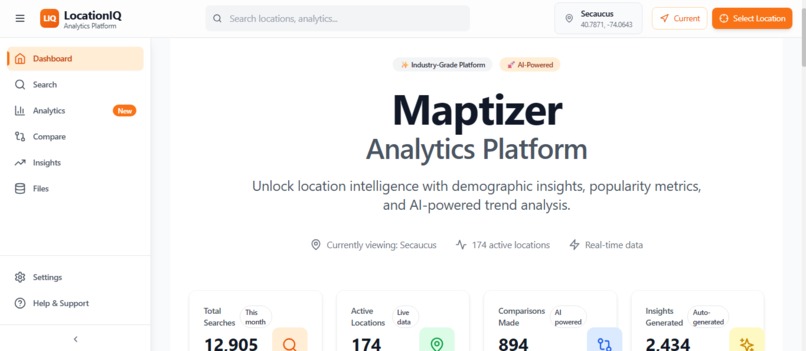
Main Platform
-
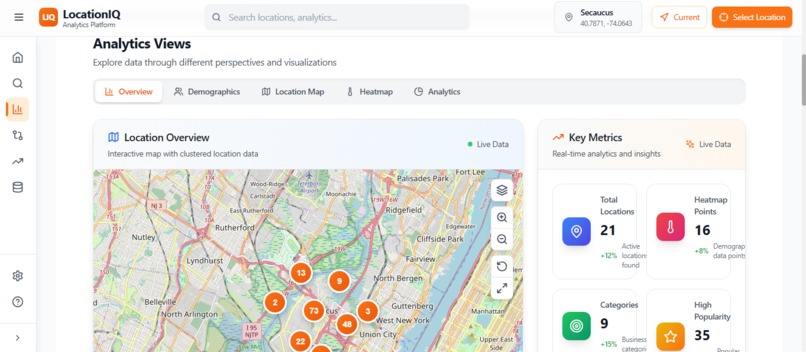
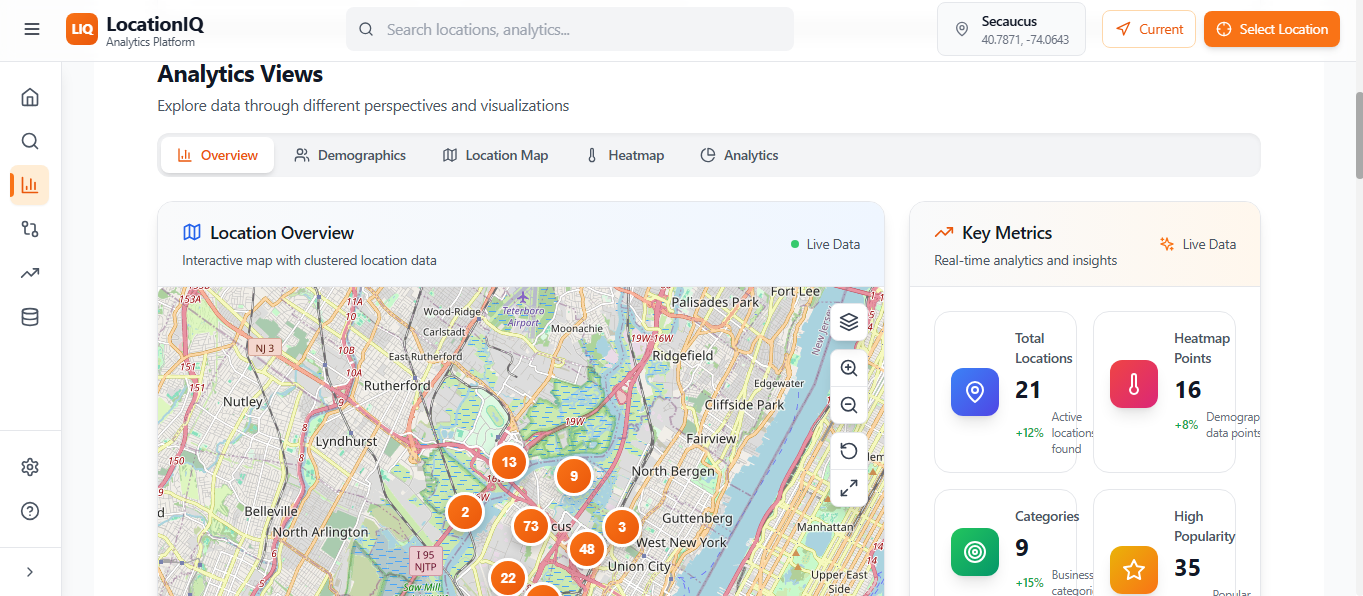
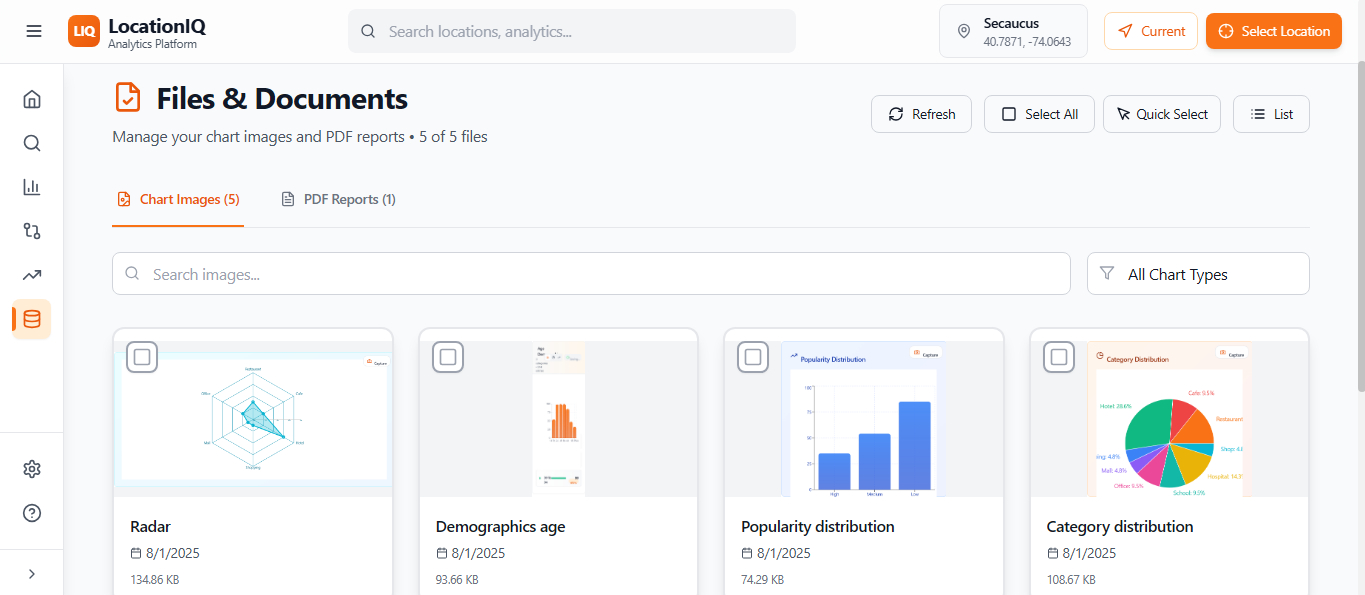
Analytics works
-
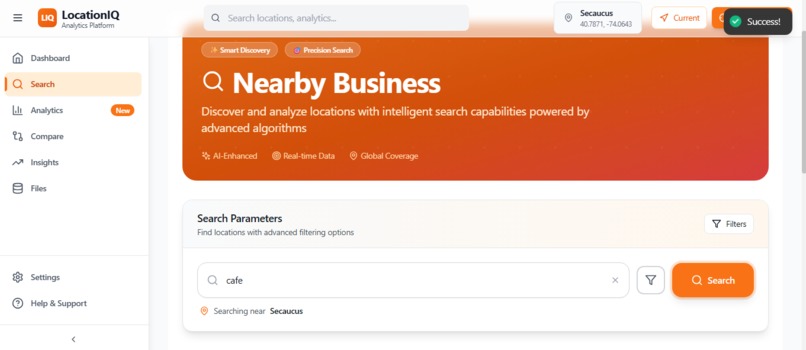
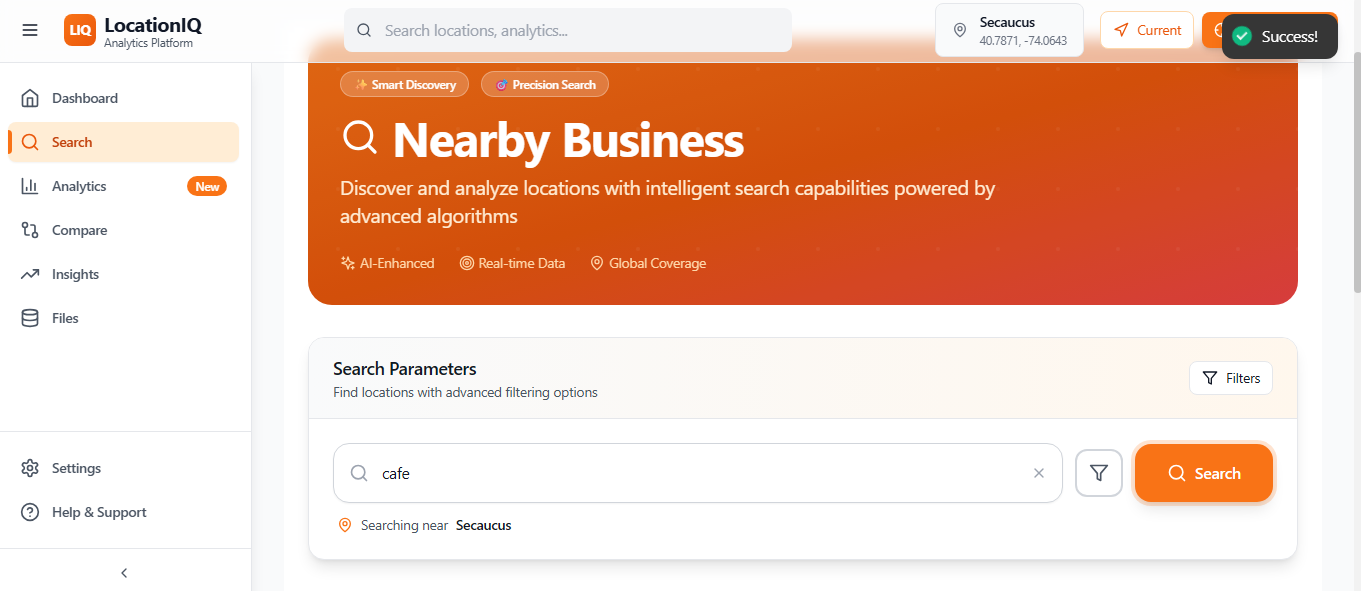
Nearby Business
-
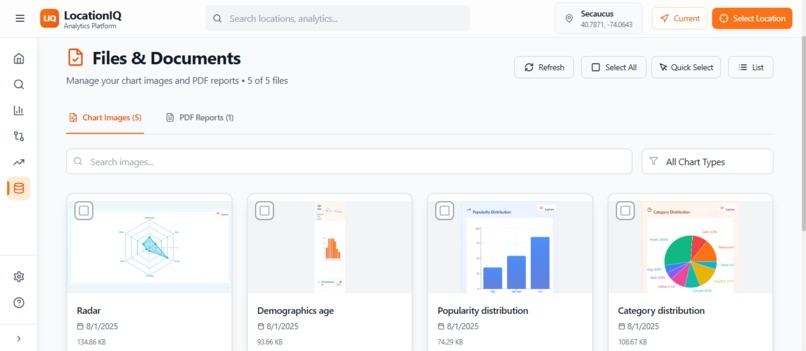
Insights
-
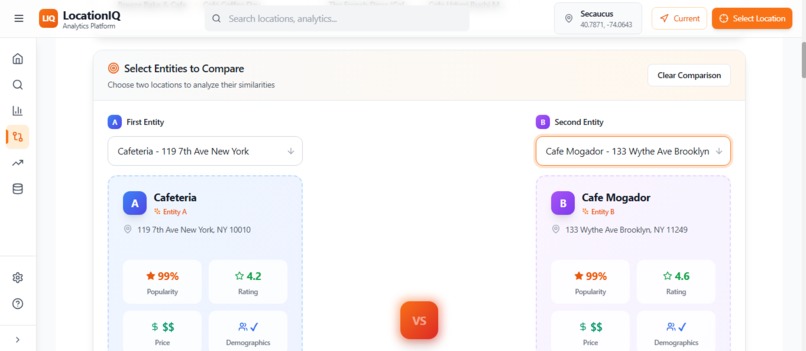
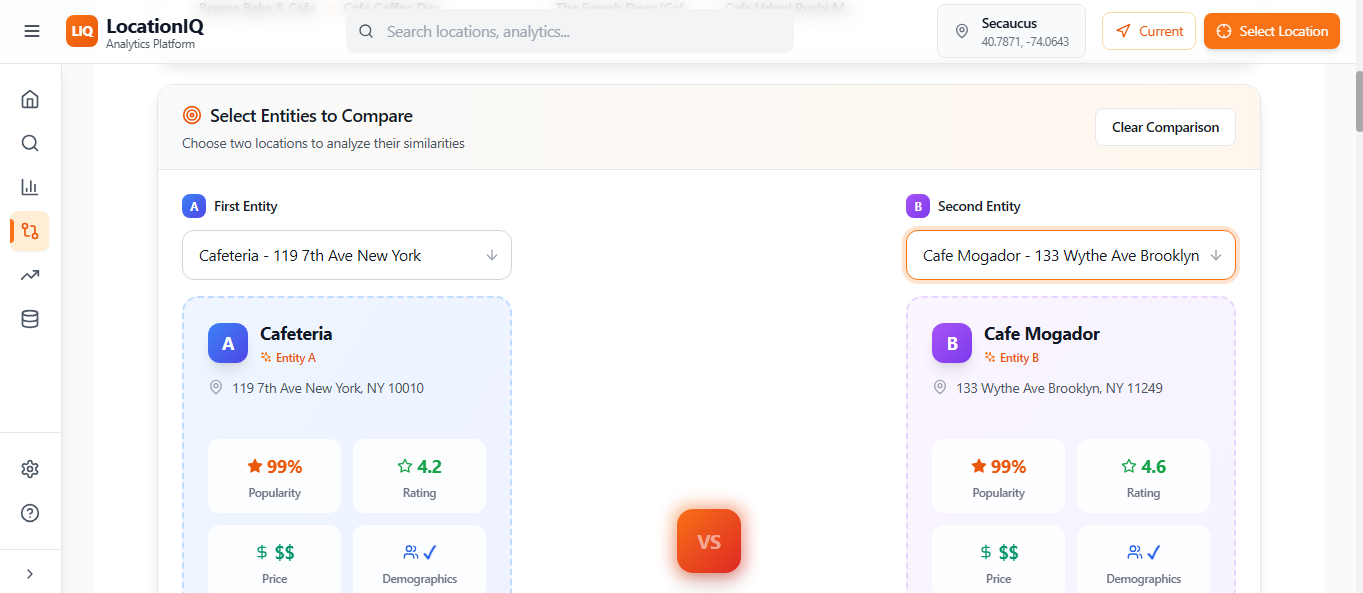
Comparison Work
-
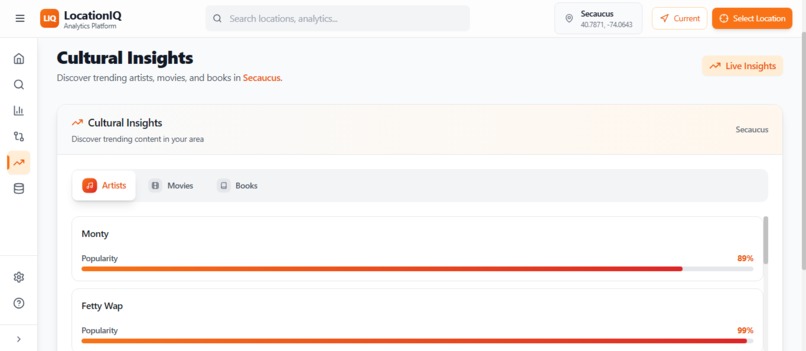
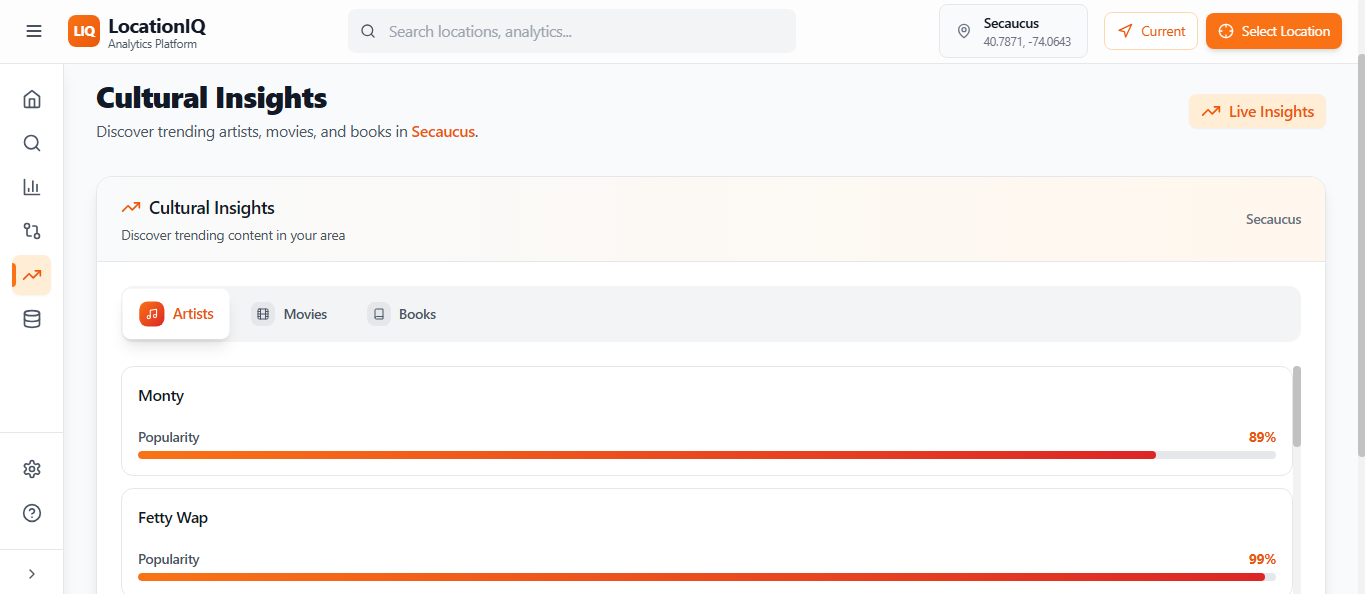
Cultural Analysis
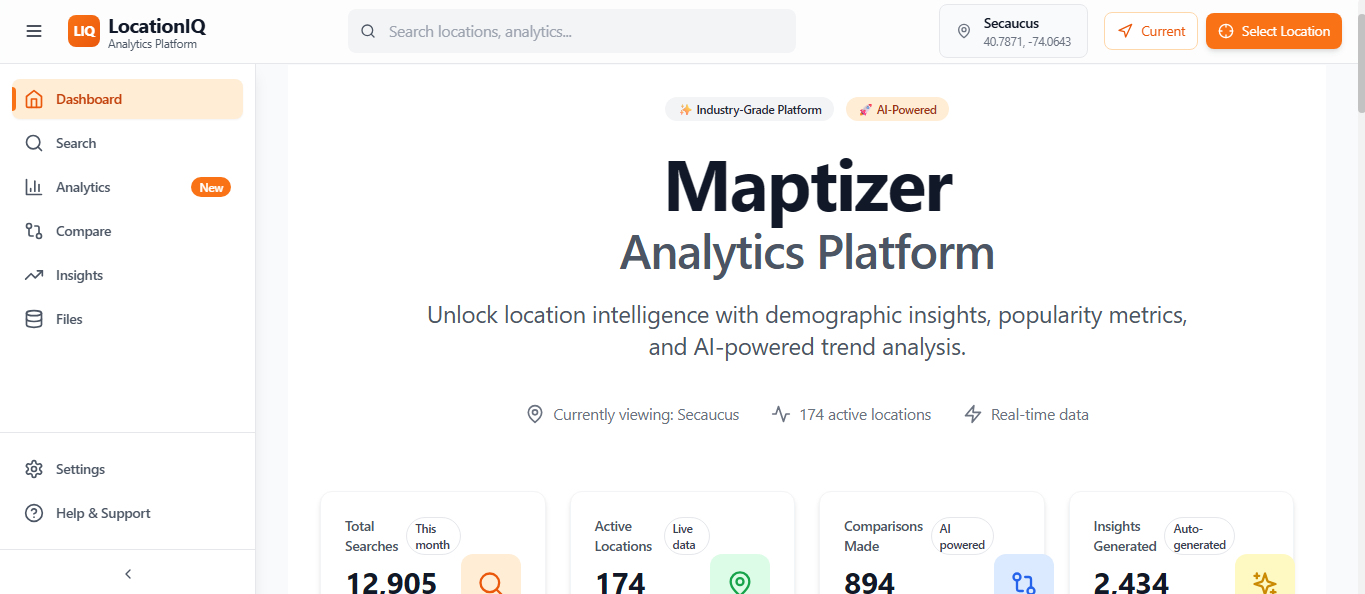
🧠 PROJECT STORY: Maptizer
>> ABOUT THE PROJECT
The goal of this project was to create an intelligent system that could identify the optimal business location based on:
- Demographic trends
- Consumer preferences
- Competitor analysis
- Cultural compatibility
Powered entirely by the Qloo API suite, this system integrates data from:
Demographics API
Location (Places) API
Taste API
Predictive API
The result is a smart, data-driven business report that highlights:
→ Ideal zones to establish a new business
→ Customer spending trends
→ Local cultural compatibility
→ Competitor landscape
💡 INSPIRATION
>> WHY THIS MATTERS:
Starting a business isn't just about having a great product —
it’s about placing it in the right community.
Key questions to answer:
- Who lives there?
- What do they like?
- How much do they spend?
- What competition exists nearby?
>> REAL-WORLD EXAMPLE:
🔍 STARBUCKS
- Uses advanced location analytics to determine new store openings
- Factors include demographics, foot traffic, competitor proximity, and even taste trends
📉 FAILURE CASE: TARGET IN CANADA
- Target expanded rapidly in Canada (2013) without deeply analyzing cultural compatibility or local retail habits
- Resulted in a $2 billion loss and total withdrawal by 2015
The inspiration came from understanding that data democratization through APIs like Qloo allows smaller businesses to make decisions just as smart as the big players.
🛠️ HOW I BUILT IT
The system is structured as a data pipeline — each step powered by Qloo APIs.
1️⃣ LOCATION + BUSINESS TYPE INPUT
- User defines target region (city, neighborhood)
- Selects business category (e.g., cafe,restaurant, gym)
2️⃣ NEARBY BUSINESS IDENTIFICATION
- Qloo Places API returns:
• Business name
• Coordinates (lat, long)
• Category
• Radius
3️⃣ DEMOGRAPHIC ANALYSIS
For each business location:
- Age group distribution
- Gender dominance
- Population density
- Spending behavior by age/gender
4️⃣ CULTURAL TASTE MAPPING
- Qloo Taste API returns preference data:
• Food
• Music
• Movies
• Books
5️⃣ CLUSTER FORMATION (K-MEANS)
- Combined:
• Geographic coordinates
• Demographics + Spending
• Taste alignment scores - Performed K-Means Clustering to group high-potential areas
- Generated heatmaps of "best-fit" business zones
6️⃣ PREDICTIVE COMPARISON
- Compared clustered zones with Qloo Predictive API
• Found business success similarity scores
• Detected anomalies to avoid
7️⃣ CULTURAL COMPATIBILITY CHECK
- Analyzed local culture alignment:
• Artists, books, and films popular in the area - Evaluated fit for culturally aligned branding campaigns
8️⃣ FINAL BUSINESS SUITABILITY REPORT
- Combined results into a complete report:
→ Clustered zones + heatmaps
→ Demographic spending breakdown
→ Taste compatibility index
→ Competitor overview
→ Predictive success ranking
📚 WHAT I LEARNED
✔ API Orchestration
- Seamlessly integrated multiple Qloo endpoints
✔ Geospatial Clustering
- Applied machine learning to map physical + behavioral data
✔ Cultural Data Mining
- Interpreted preferences into real-world business relevance
✔ Predictive Modeling
- Used data to forecast location success
⚠️ CHALLENGES FACED
⚡ RATE LIMITING
- Qloo’s rate limits required smart request batching and caching as I handled multiple APIs simultaneously for a dynamic response
🎯 TASTE NORMALIZATION
- Mapping abstract preferences (e.g., music) to business impact (e.g., building ambiance) was challenging
🌐 CLUSTERING NOISE
- Areas with high affinity and popularity scores (even with thresholds) added noise to city-based clusters
🔗 DATA INTEGRATION
- Required normalization across:
• Demographic data
• Taste data
• Spending behavior
• Coordinates
✅ CONCLUSION
This project sits at the intersection of:
→ Machine Learning
→ Cultural Intelligence
→ Business Strategy
Using Qloo APIs, I developed a tool that doesn't just locate a business —
it understands the people behind the place.
🎯 USE CASES
- Startups looking for expansion zones with existing business activity
- Investors planning to launch multiple businesses simultaneously
- Cultural analysts studying regional behavioral patterns
📈 NEXT STEPS
Next steps may include:
- Integrating real-time social signals (e.g., events, foot traffic)
- Launching a visual dashboard for dynamic exploration
Built With
- businessanalytics
- clustering
- datavisualization
- express.js
- geojson
- javascript
- kmeans
- leaflet.js
- llm
- maprendering
- node.js
- pdfreport
- qloo
- qlooapi
- react
- restapi
- tastemapping
- vite

Log in or sign up for Devpost to join the conversation.