Inspiration
We were inspired by the first speeches by Tatiana EL-Khouri and Dawn Comer, who emphasized the need and value of civic tech. We wanted to create an easier way for people to gain an understanding of civics and how to engage in their environment through an interactive map.
What it does
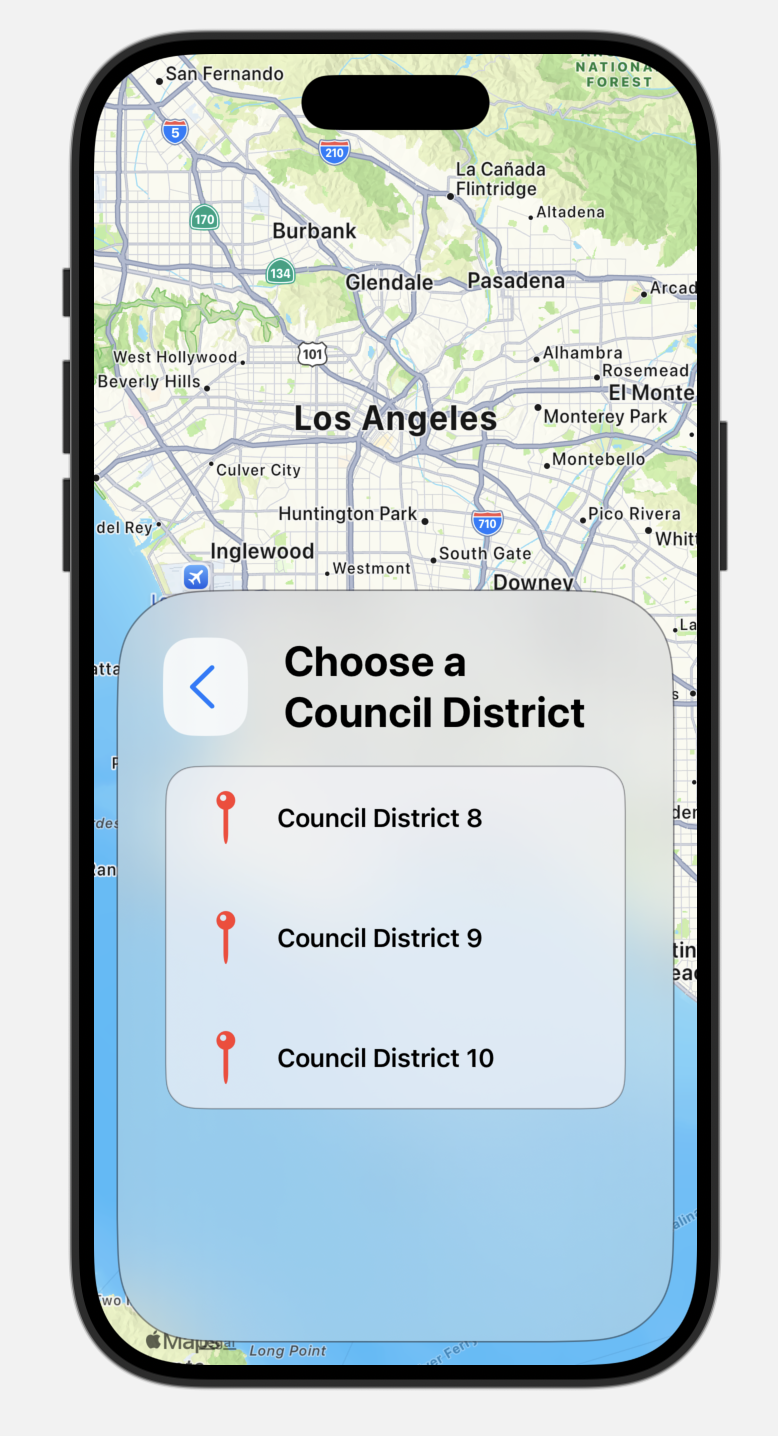
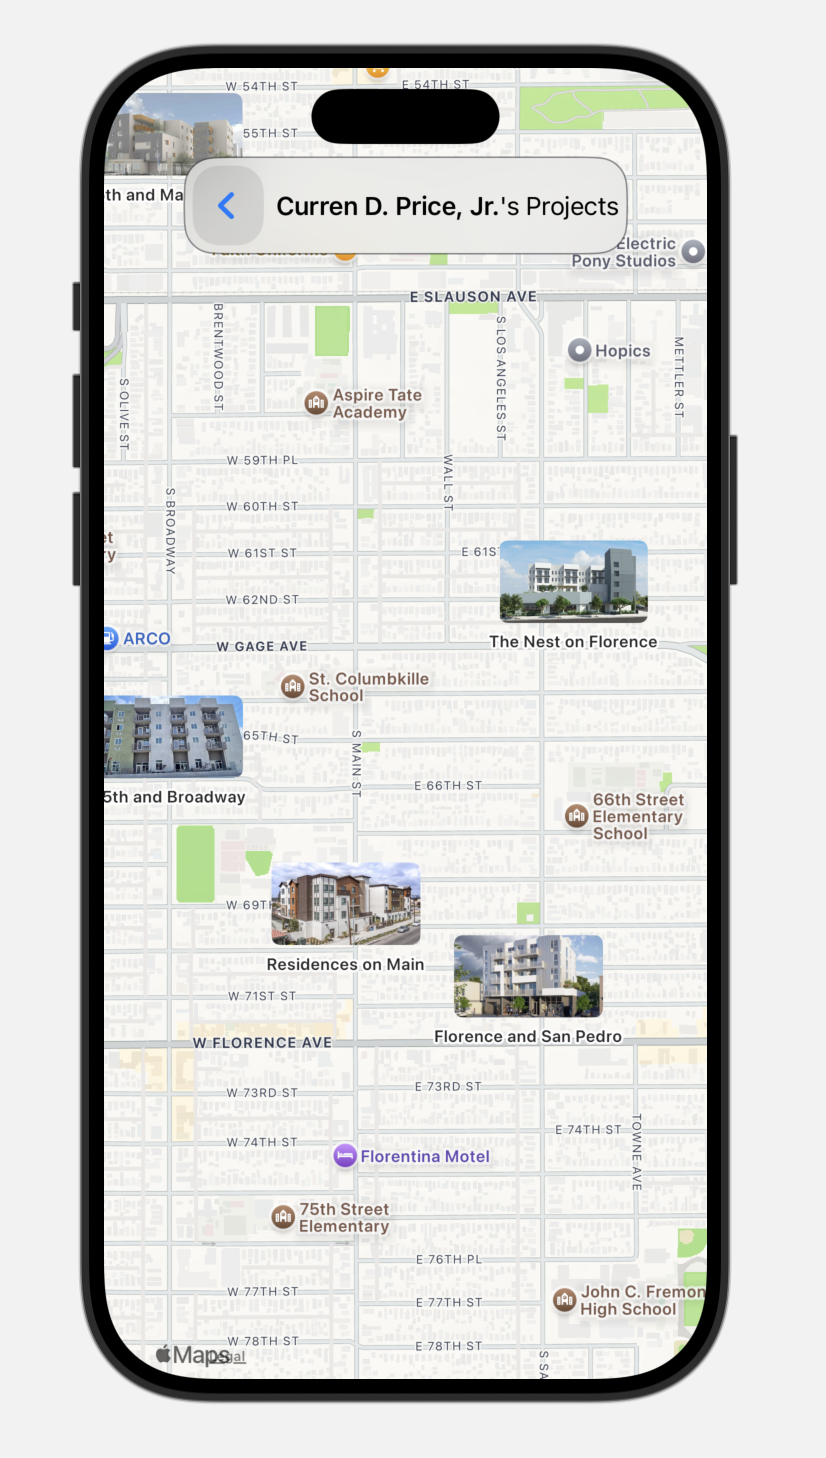
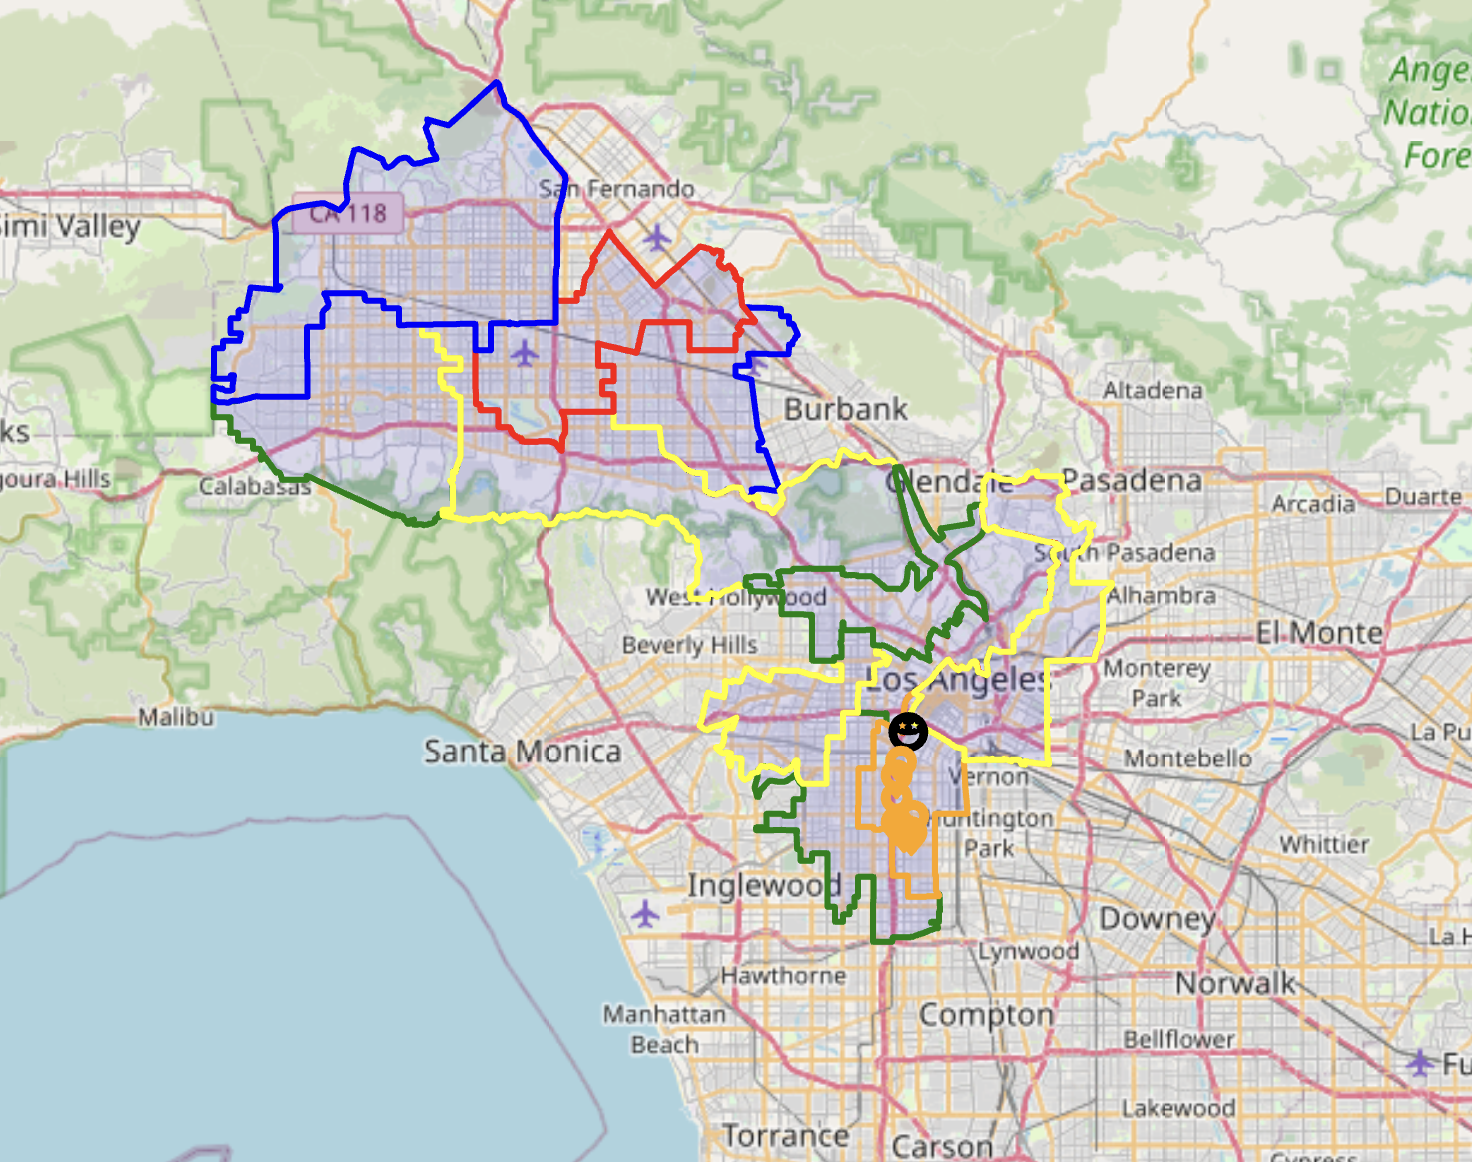
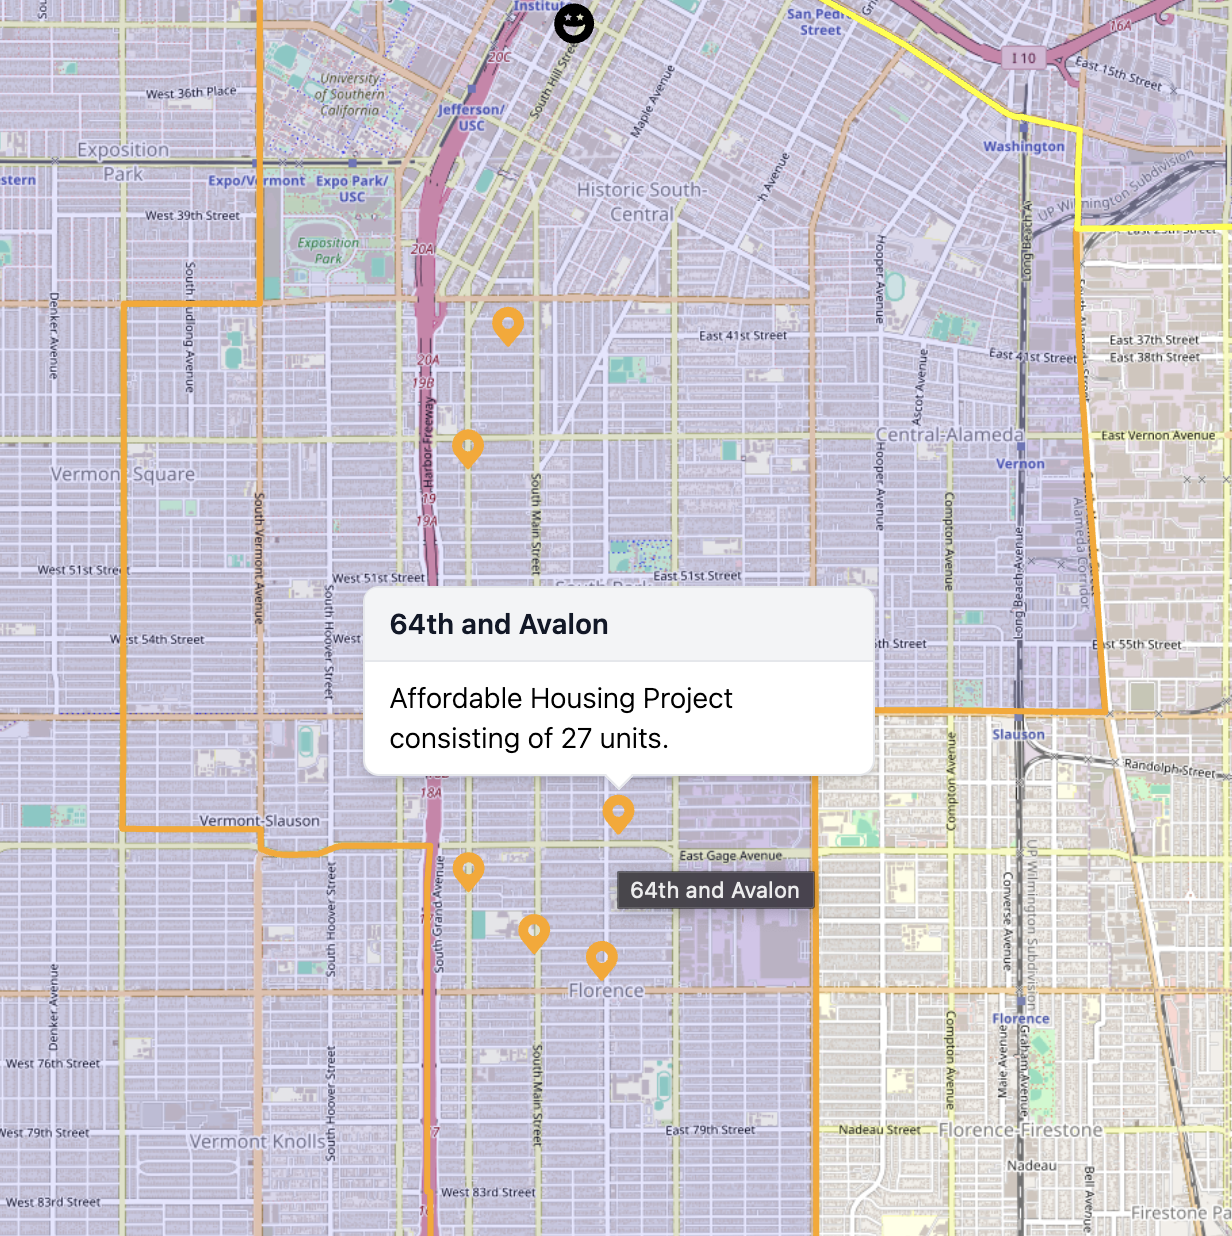
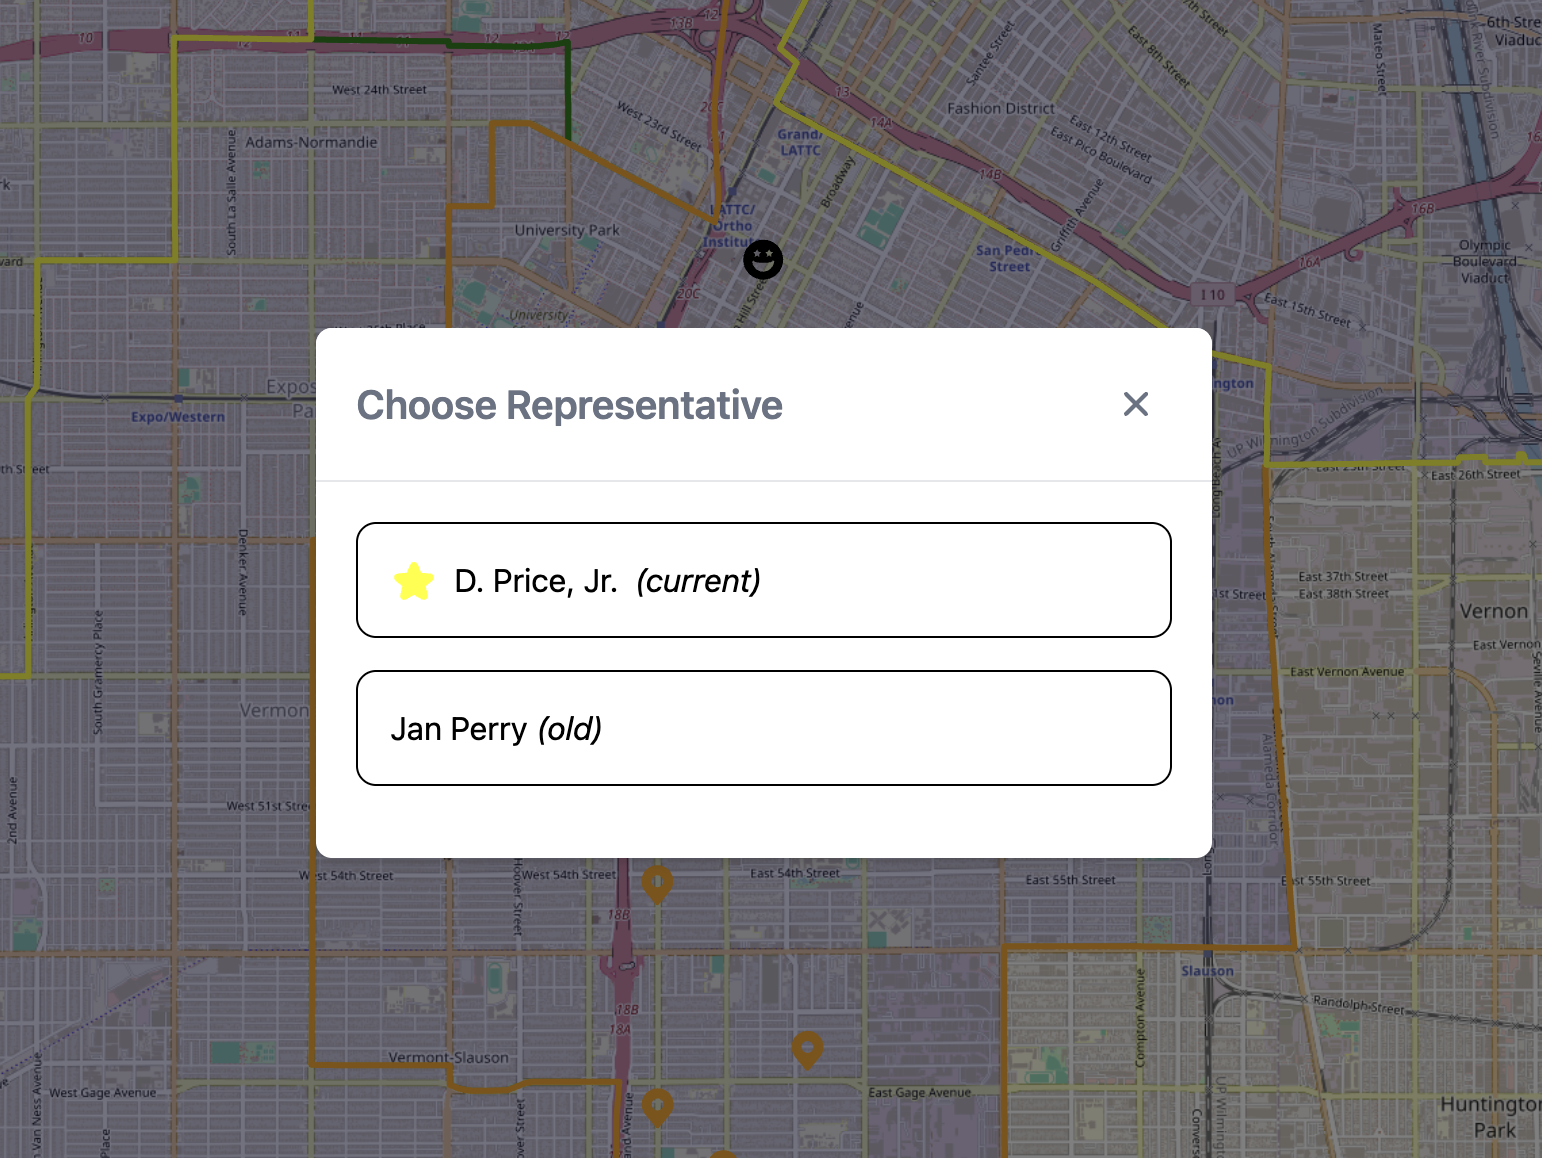
This map shows the 15 districts of LA city and the contributions that each rep of each district has made on the city. You can toggle between current and former reps to see difference in impact each has made. This allows users to visually see progress beyond just a list of abstracted accomplishments.
How we built it
Challenges we ran into
Because we are all freshman in college in LA, we didn't know anything about LA city politics, so we had to very quickly learn about it. We didn't know about the 15 districts or how each was split up, which made the initial implementations a bit more difficult.
Accomplishments that we're proud of
What we learned
What's next for MapCzar
Going forward, we want to polish what we’ve built and push it closer to what we originally envisioned. We got a chance to talk with Dawn Comer, and she was interested in taking this project ahead and potentially pitching a pilot to the government office, expanding further to different districts and even cities. That means swapping out the hardcoded data for live API integrations, so the app can be updated easier when expanding, and also stays up-to-date. We’ll also add more depth to candidate profiles, start pulling in voting records on motions, and maybe even bring in data about unelected candidates to round out the picture.

Log in or sign up for Devpost to join the conversation.