



Inspiration
Weather observations become valuable when they help someone make a practical decision. We built MajiShift around one question: how can a reservoir operator prepare for a pumping interruption while protecting essential water reserves?
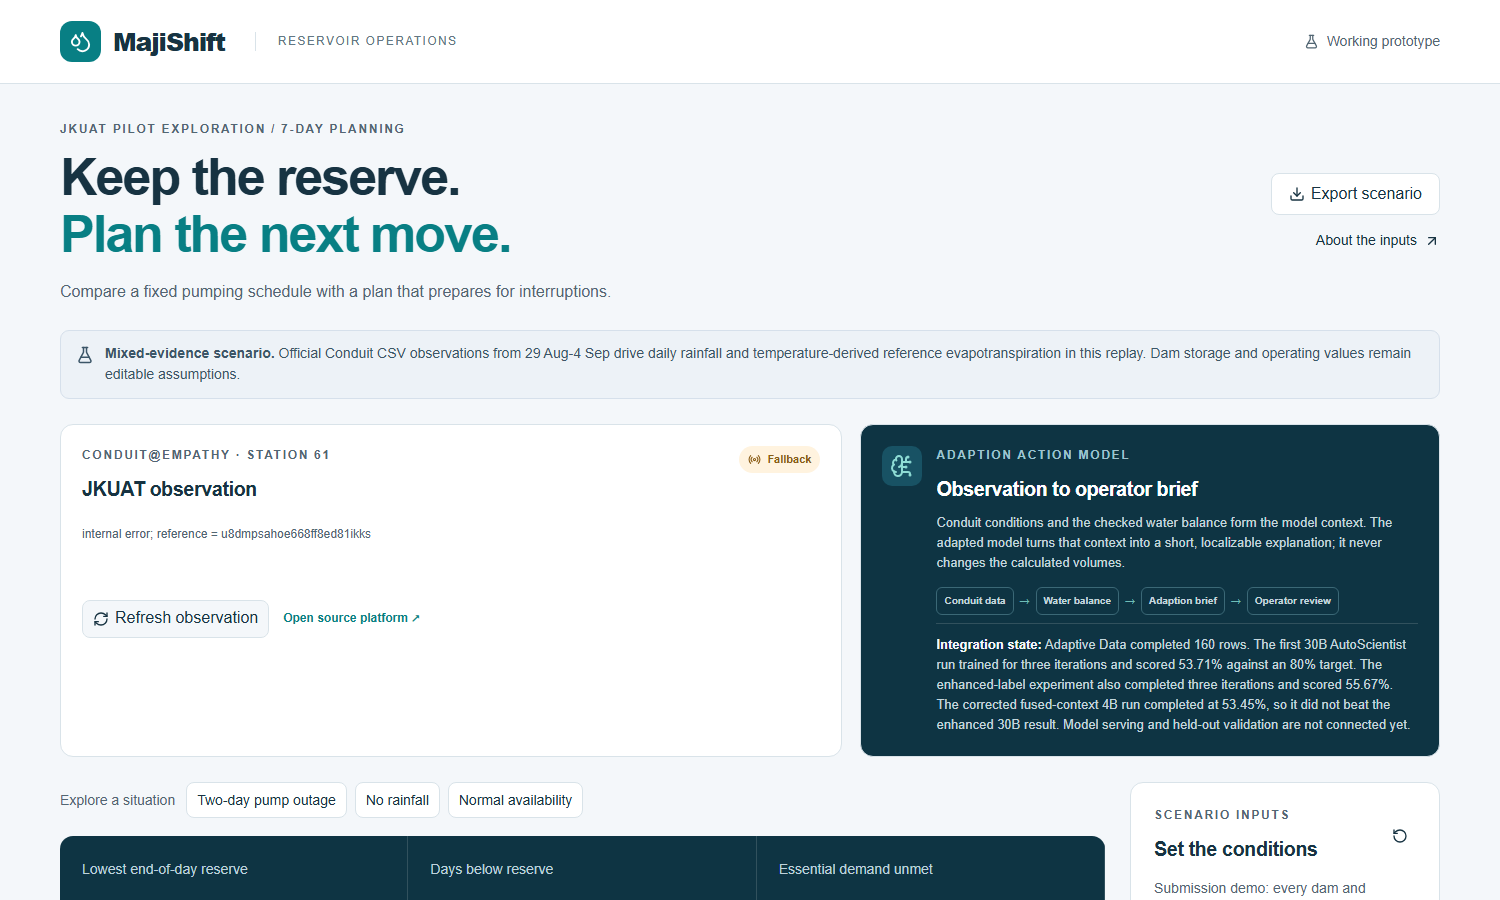
Using JKUAT as our initial exploration setting, we wanted to connect Conduit@Empathy observations to water-planning decisions that an operator can inspect, question and adjust.
What it does
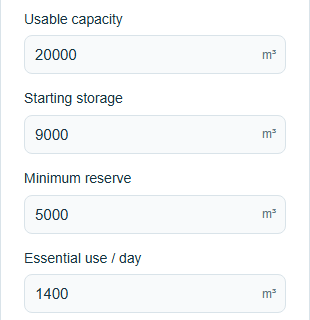
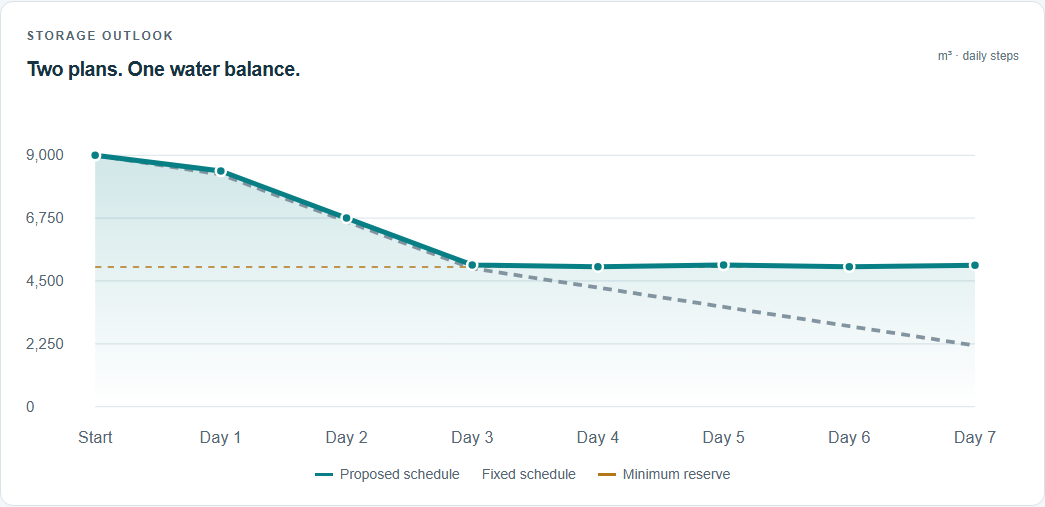
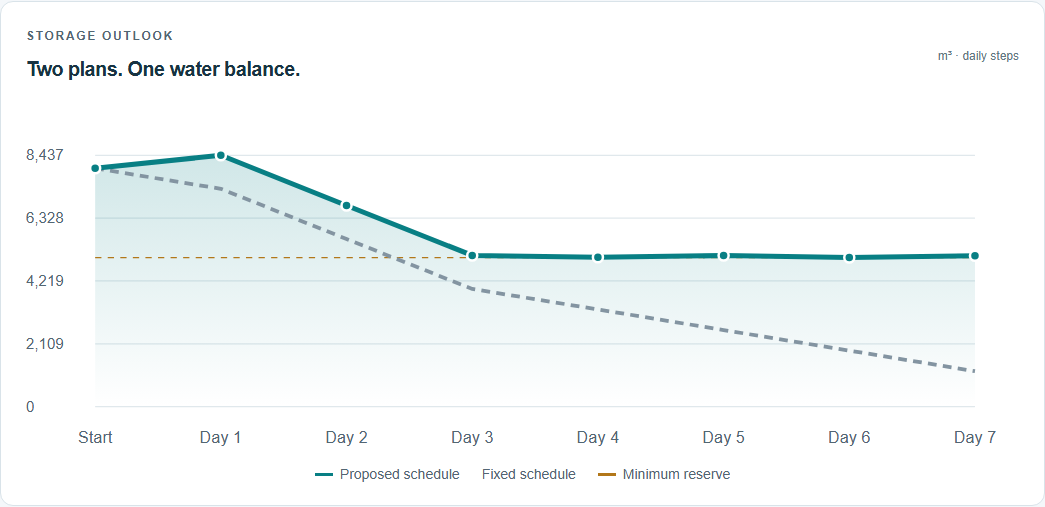
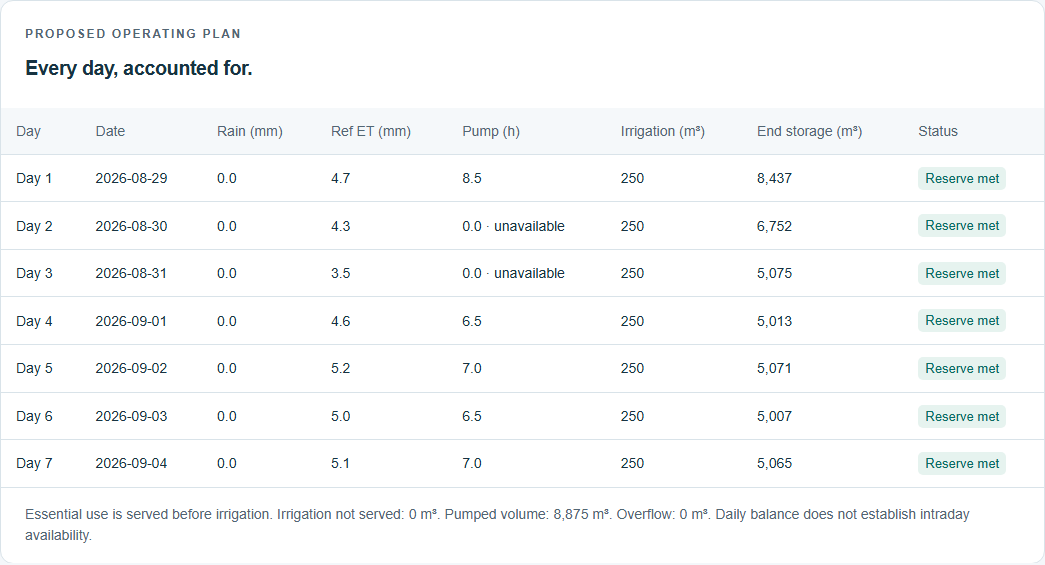
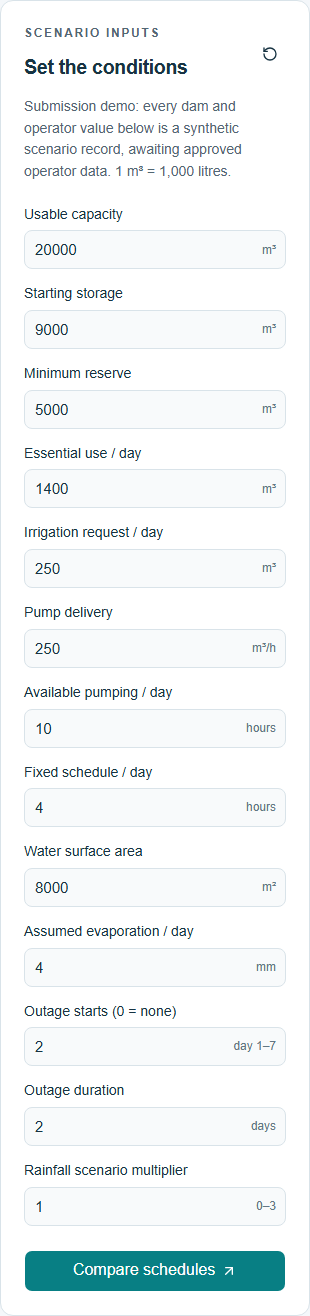
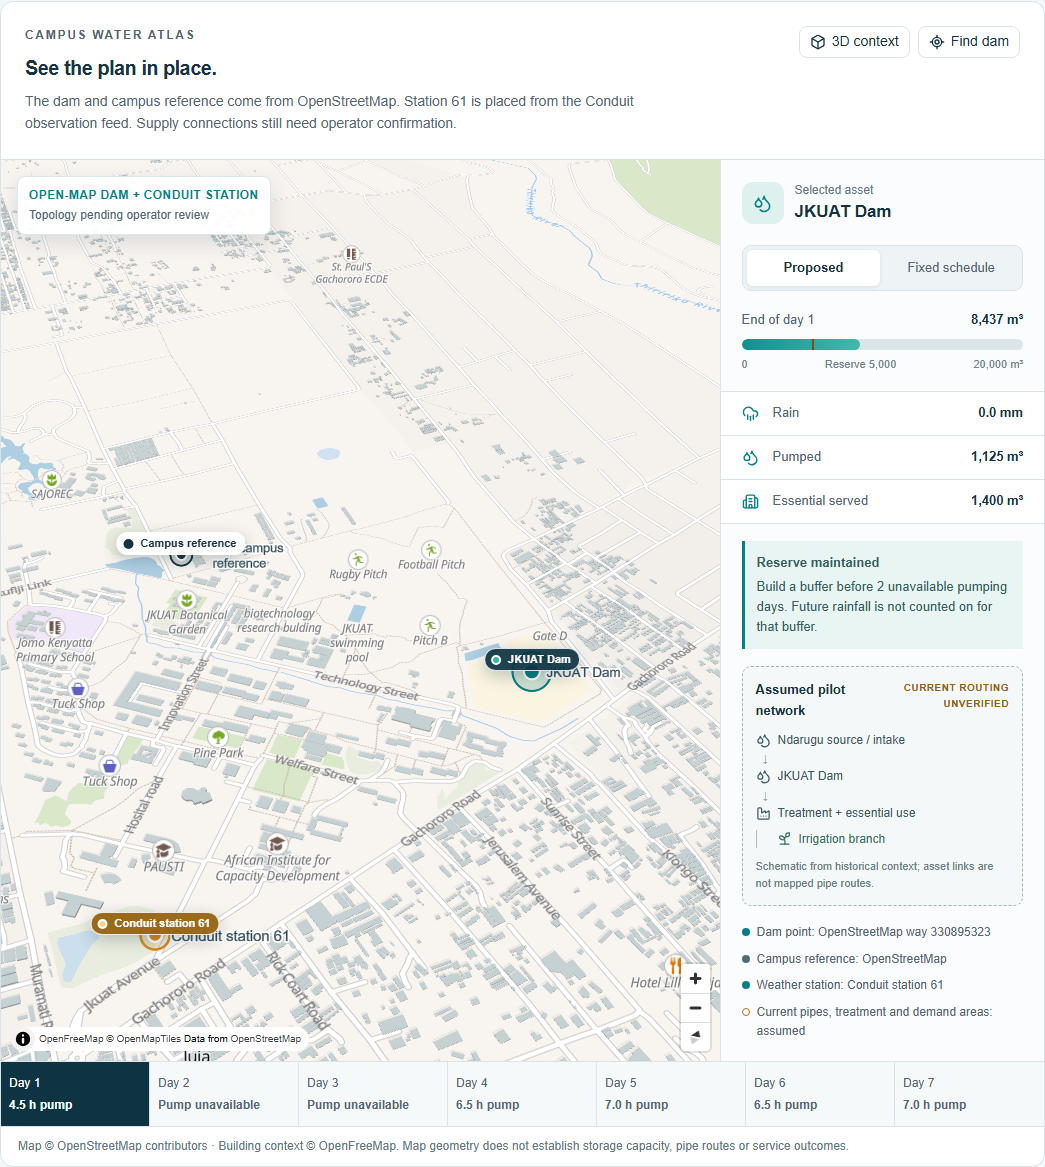
MajiShift compares a fixed pumping schedule with a reserve-first plan over seven days. Users can adjust storage, demand, reserve targets, pump availability and outage assumptions, then inspect the resulting storage chart and daily schedule.
The prototype includes a campus GIS view, explicit accounting for unmet demand and unserved irrigation, and an export containing the scenario inputs, weather provenance and calculated results.
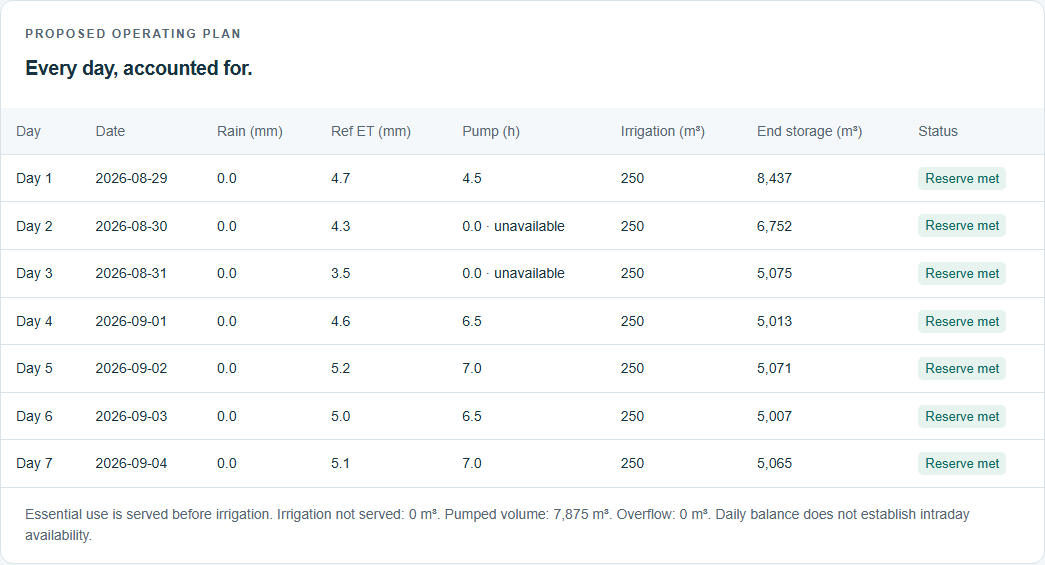
Conduit data contributes directly to the calculation. We processed 9,885 station observations from 29 August–4 September 2026 into daily rainfall and temperature summaries. Rainfall enters the water balance, while temperature drives a reference evapotranspiration estimate used as a surface-loss proxy.
In our synthetic two-day outage scenario, the proposed schedule maintains the reserve throughout the week, while the fixed schedule falls below it on five days. This requires more pumping; 7,875 m³ versus 5,000 m³; so the result demonstrates a reserve-protection trade-off rather than water savings.
How we built it
We built the interface with React, TypeScript, Tailwind CSS and shadcn/ui, using Next.js and Vinext/Vite tooling. MapLibre, OpenStreetMap and OpenFreeMap provide the geographic context.
A shared TypeScript module calculates the daily water balance, applies pumping constraints and compares schedules. Historical Conduit observations supply measured rainfall and temperature inputs. The FAO-56 Hargreaves equation converts temperature observations into an estimate of climatic evaporative demand.
We also used Adaption to prepare operator-action training data and run model-training experiments. Those experiments remain a separate research track; the displayed schedules come from the transparent planner, not a served AI model.
Brian Mwangi focused on backend engineering, Adaption model training and data aggregation. Patrick Leon focused on frontend development, UI/UX, QA and GIS.
Challenges we ran into
The biggest challenge was connecting environmental observations to a defensible calculation. During QA, we found and corrected a radiation-to-water-depth conversion error in the evapotranspiration calculation and added a regression test.
Live-data availability also varied, so we used the official historical CSVs for a reproducible demonstration.
Operator-approved reservoir records were unavailable. We therefore clearly labelled storage, capacity, demand, pumping and outages as synthetic assumptions. Reference evapotranspiration remains an estimate of climatic demand, not measured reservoir evaporation.
Our model-training experiments also remained below our target performance, so we kept them separate from the working numerical planner.
Accomplishments that we're proud of
- Connected official Conduit observations to the water-balance calculation.
- Built a working workflow for adjusting assumptions, comparing schedules and exporting results.
- Made reserve breaches, additional pumping and unserved demand visible.
- Preserved source provenance and distinguished observations from estimates and assumptions.
- Verified water conservation across 200 stress scenarios.
- Created a responsive GIS interface and a four-minute captioned demonstration.
What we learned
Meaningful data use requires a traceable connection between an observation and an output. It also requires honesty about when the data does not change the recommended action.
For example, the corrected Conduit replay adds 35.6 m³ of estimated surface loss compared with the fixed assumption. That changes the storage trajectory but leaves the default pumping schedule unchanged.
We also learned that plausible-looking environmental results still need careful unit checks, and that a useful recommendation must explain its assumptions and trade-offs.
What's next for MajiShift
Our immediate next step is an operator review to obtain approved storage, demand, pumping and outage records.
We will replace the synthetic operating layer, calibrate surface-loss estimates, verify reservoir geometry and infrastructure, and evaluate the planner against historical operating periods.
Further development could introduce forecast-based scenarios and a human-reviewed explanation layer, once the Adaption model has passed appropriate validation. Our aim is to progress from a transparent prototype to a tool whose usefulness is demonstrated with operators and real records.
Built With
- adaption
- gis
- maplibre
- node.js
- openfreemap
- openstreetmap
- react
- typescript


Log in or sign up for Devpost to join the conversation.