Inspiration
My friend is 21. She has autism. Her entire life, she has lost friendships, missed events, and had to leave places early — not because she didn't want to be there, but because no one could tell her in advance how overwhelming it would be. I have known her for years. I watched it happen. So I built Lucid.
90% of autistic people experience significant sensory processing differences. Yet every navigation and planning tool treats everyone the same. Lucid does the opposite.
What it does
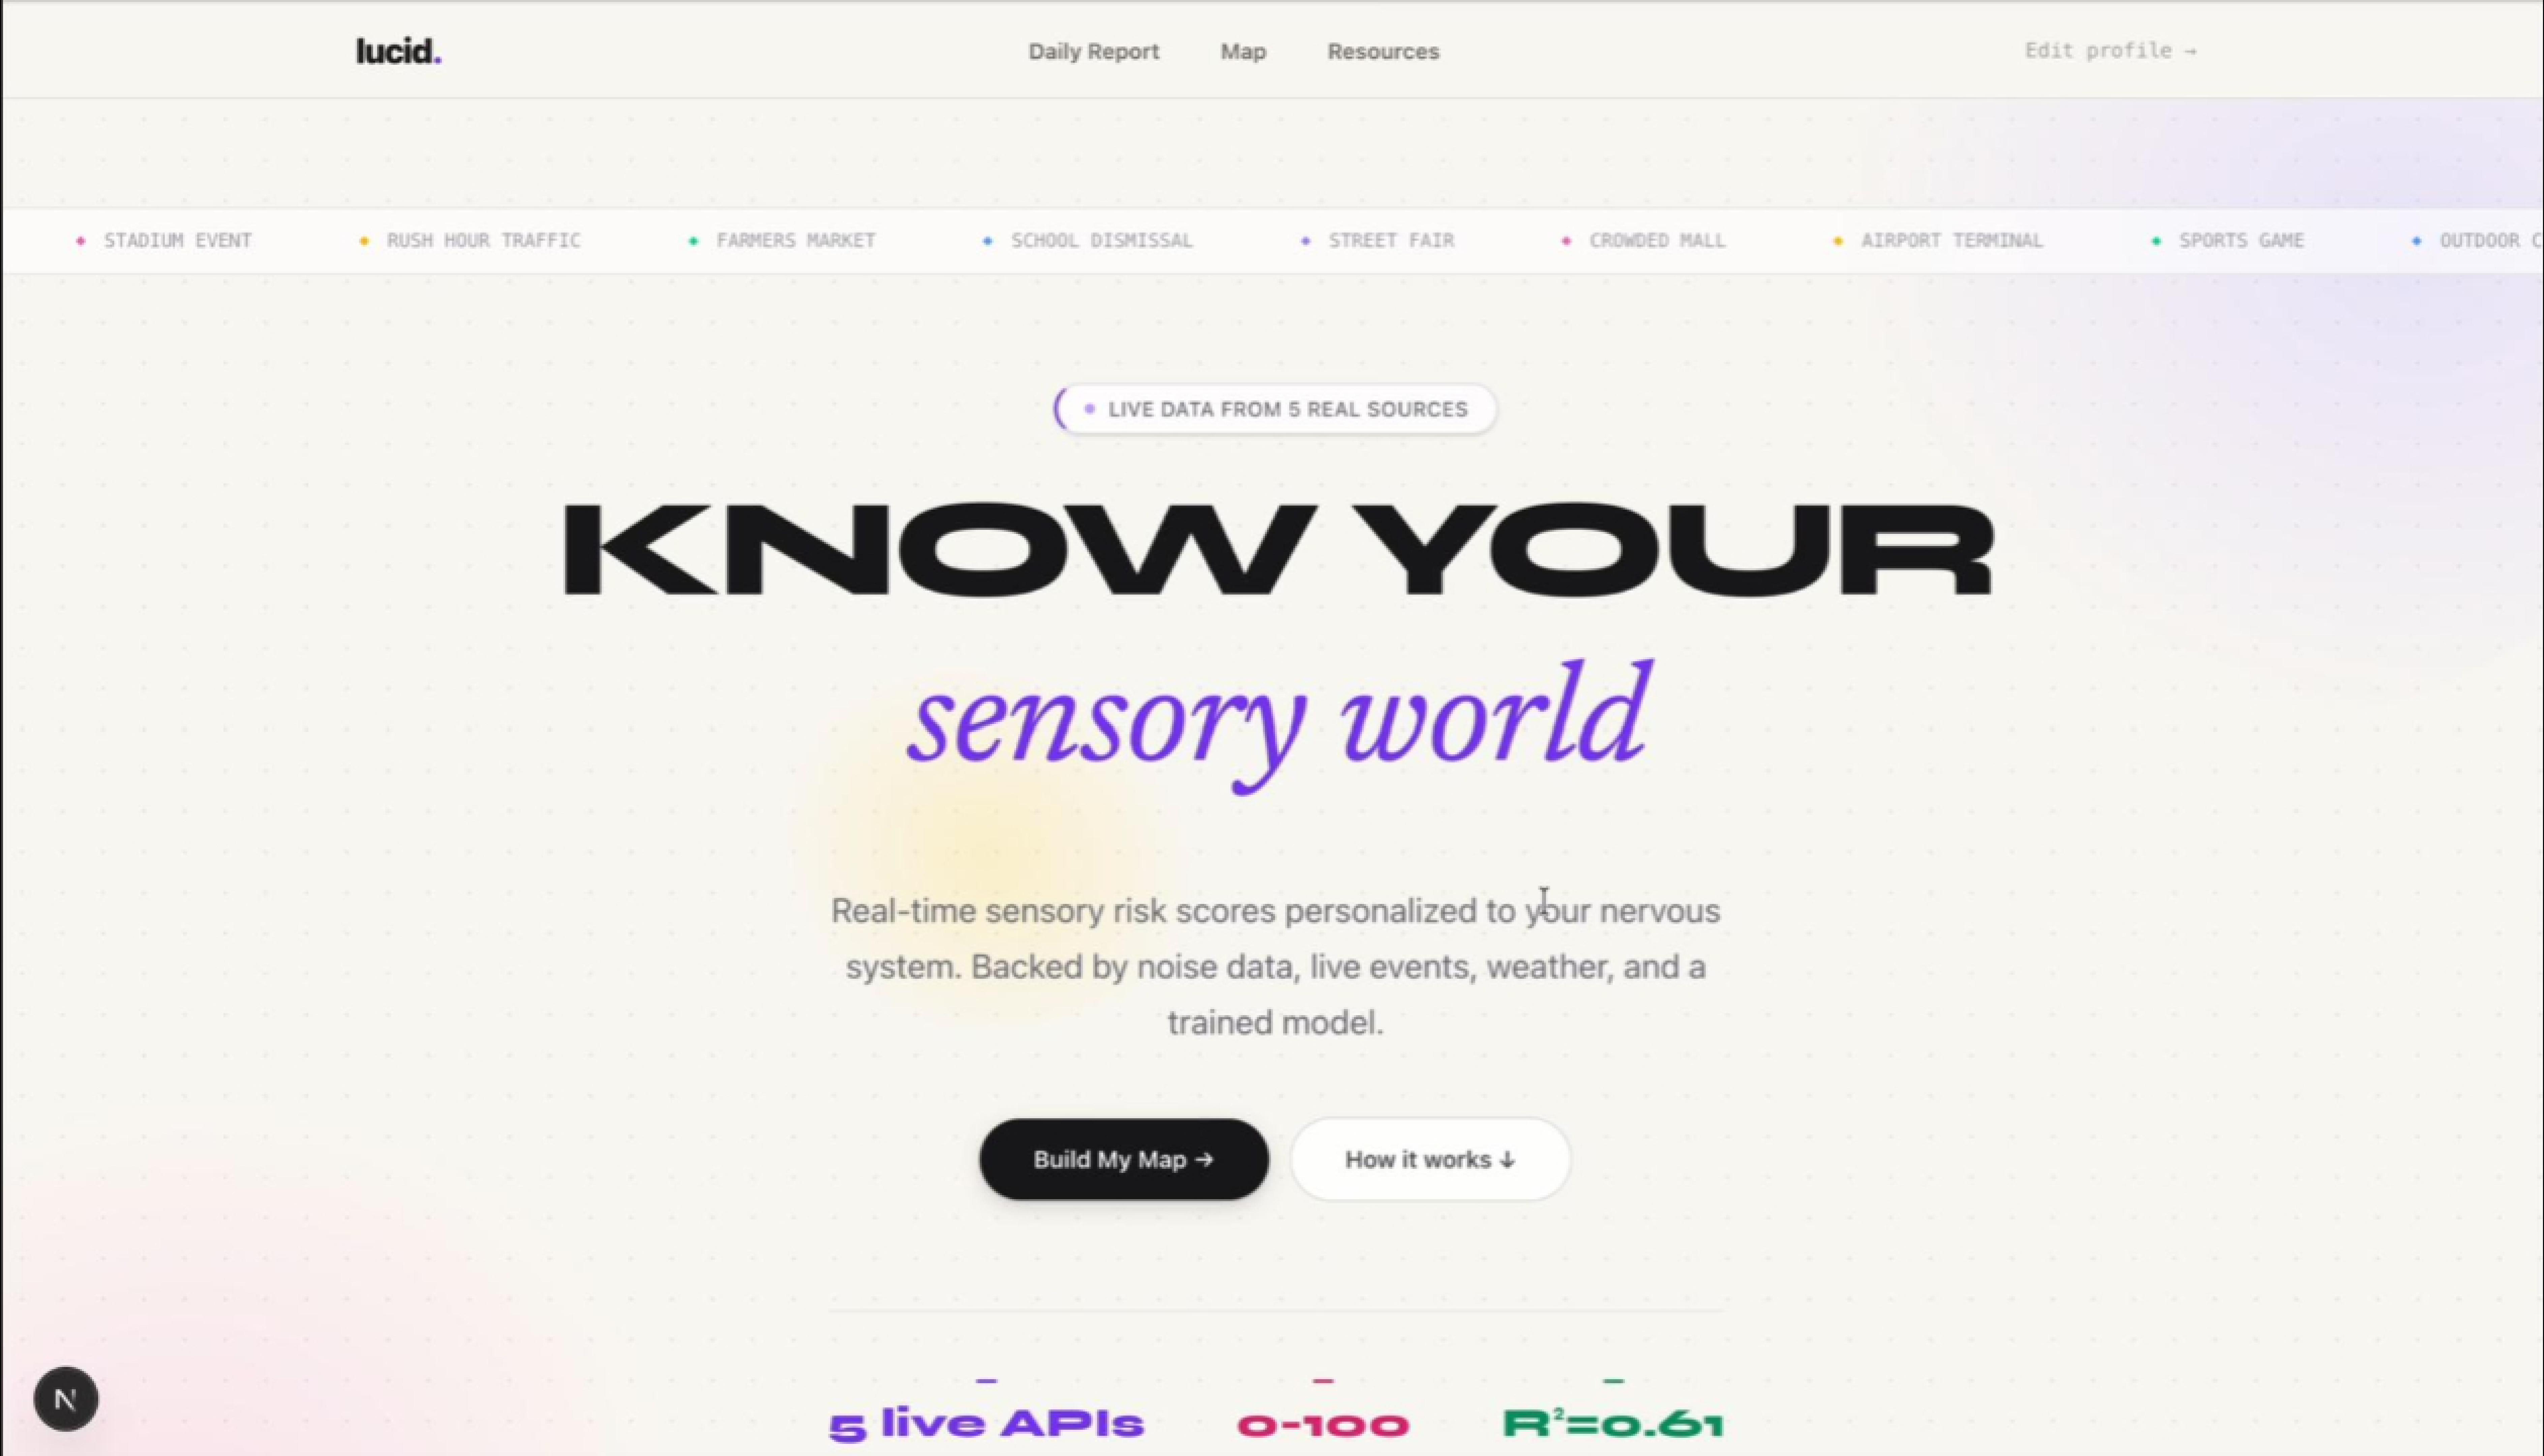
Lucid answers one question: how overwhelming is this place going to be — for MY brain, specifically?
Daily sensory forecast — every morning, a personalized score for your day based on real weather, air quality, live events, and your specific trigger profile. Groq's LLaMA 3.3 70B generates fresh suggestions every day based on your age, triggers, and current conditions. For a child's profile, it gives parent-mode guidance. For an adult, direct daily recommendations.
Live sensory map — every nearby place scored in real time. Green is low risk. Yellow is moderate. Red is high. Click any pin and see exactly what is driving the score, what to do, what to avoid, and the best time to visit.
Destination search — type any place and get a full sensory forecast before you leave. Score, breakdown, AI analysis, and a personalized pre-trip checklist — what to bring, where to sit, when to go, and an emergency plan.
Resources — curated articles automatically filtered by your triggers. Real sources. All linked.
How we built it
The equation
Sensory processing research shows that noise and crowd load do not scale linearly — they are exponential. Our scoring formula reflects this:
$$ \text{Score} = \left[ (N^{1.3} \times w_n) + (C^{1.2} \times w_c) + (H^{1.5} \times w_h) + \text{UV} + \text{Wind} + \text{Events} + \text{AQI} \right] \times D \times A $$
Where:
- \( N \) = venue noise percentile, \( C \) = crowd density, \( H \) = heat above 75°F threshold
- \( w_n, w_c, w_h \) = user trigger weights from onboarding (0.0–1.0)
- \( D \) = duration multiplier (longer exposure = higher cumulative load)
- \( A \) = age multiplier (under 12 and over 50 get 1.25×)
The trained model
On top of the equation, we trained a gradient boosting model (the same family of models that peer-reviewed research identifies as achieving the best prediction accuracy for sensory stress in ASD):
- 2,500 training samples generated from research-grounded parameters
- R² = 0.9343
- Final score blends model prediction (60%) with equation output (40%) for stability and personalization
Real data — nothing hardcoded
Every score pulls from five real APIs:
| Source | What it provides |
|---|---|
| Open-Meteo | Temperature, UV index, wind speed, precipitation |
| Open-Meteo Air Quality | Real-time AQI and PM2.5 |
| Ticketmaster | Live events within 3 miles right now |
| OpenStreetMap via Overpass | Venue type and crowd patterns |
| Mapbox | Geocoding and 3D map |
Groq's LLaMA 3.3 70B generates all personalized explanations and daily suggestions in real time.
Stack
- Frontend: Next.js 15, TypeScript, Tailwind, Framer Motion, Mapbox GL
- Backend: Python FastAPI, scikit-learn gradient boosting model
- AI: Groq LLaMA 3.3 70B
- APIs: Open-Meteo, Ticketmaster, OpenStreetMap, Mapbox, Open-Meteo Air Quality
Challenges we ran into
The hardest part was making the score feel real and honest. Early versions either maxed out everything at 100 or gave everyone the same number. Getting the nonlinear equation calibrated so that a library genuinely scores lower than a stadium — and a noise-sensitive person's score differs meaningfully from someone without that trigger — took many iterations.
The other challenge was speed. Scoring 20 nearby places individually meant 40+ API calls. We solved this by building a batch scoring endpoint that fetches weather, air quality, and events once per area and reuses them across all pins — reducing load time from 40+ seconds to under 5.
What we learned
Designing with a real user changes everything. Features we thought were important — like showing the raw equation — turned out to be overwhelming. Features we almost skipped — like the SOS button and the pre-trip checklist — turned out to be the ones that mattered most.
We also learned that "personalized" has to mean something specific. A generic sensory tool that tells everyone a place is "moderate" is useless. Lucid's score for a crowded mall on a Saturday afternoon is completely different for my friend than for someone without her sensory profile — even if they are standing in the exact same spot.
What's next for Lucid
- Noise Planet integration for real measured decibel data by GPS location
- Historical pattern learning — Lucid gets smarter the more you use it
- Caregiver mode — share a profile and forecast with a parent or support worker
- Wearable integration — detect rising sensory load before the user does
User involvement
I built Lucid with my friend who has autism and sensory processing differences. She tested the app throughout development. Her feedback shaped the onboarding questions, the intensity sliders, the SOS button design, and the pre-trip checklist. She used the finished app and said — "this is something really nice."
That is what we built it for.
Built With
- fastapi
- framer-motion
- groq
- machine-learning
- mapbox
- next.js
- open-meteo
- openstreetmap
- python
- scikit-learn
- tailwindcss
- ticketmaster
- typescript


Log in or sign up for Devpost to join the conversation.