-
-
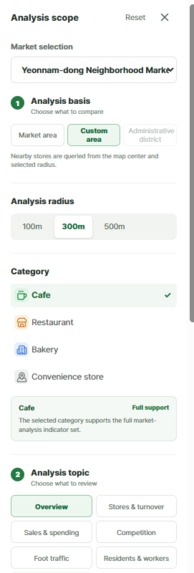
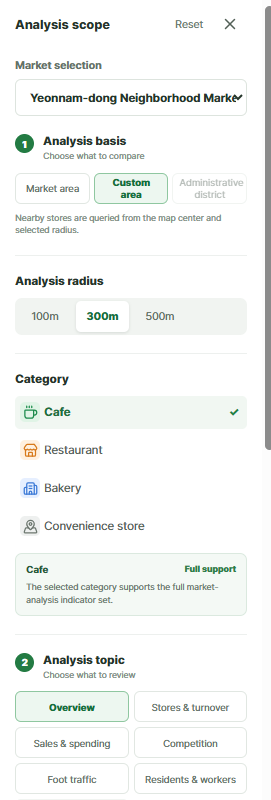
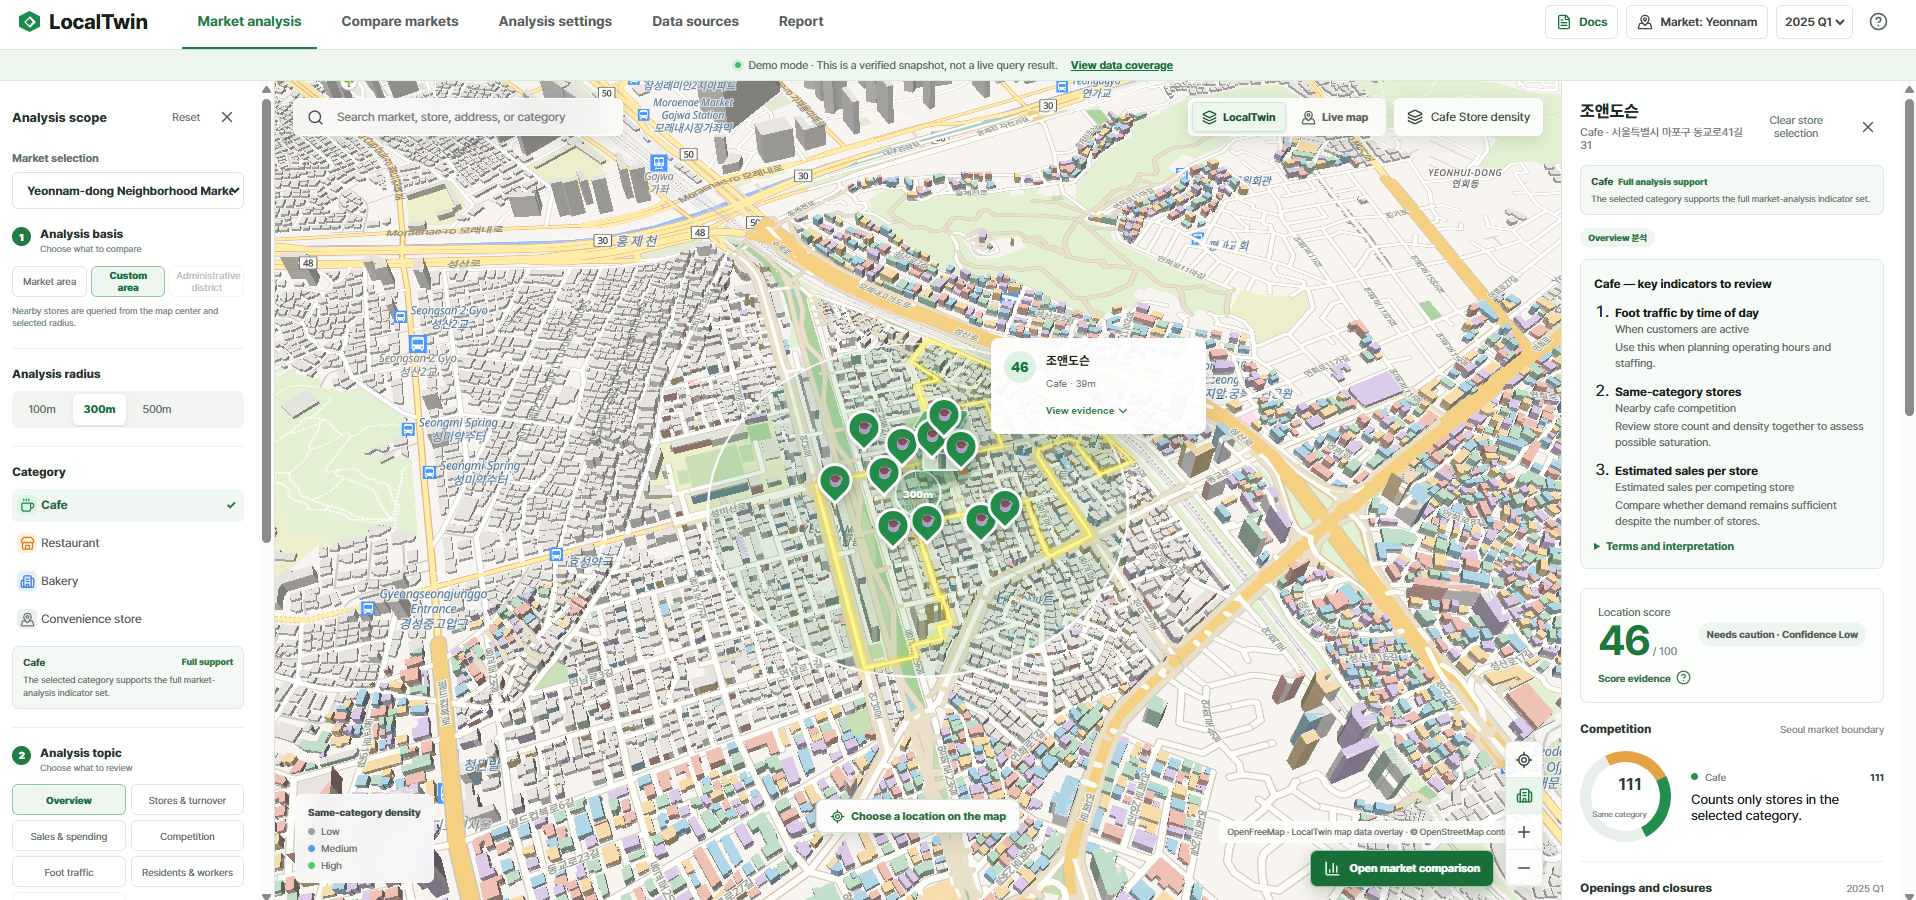
Set the analysis area, walking radius, business category, and indicators to review.
-
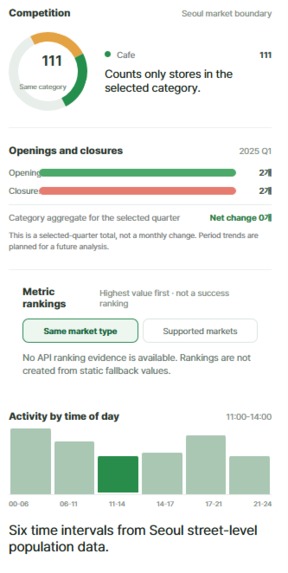
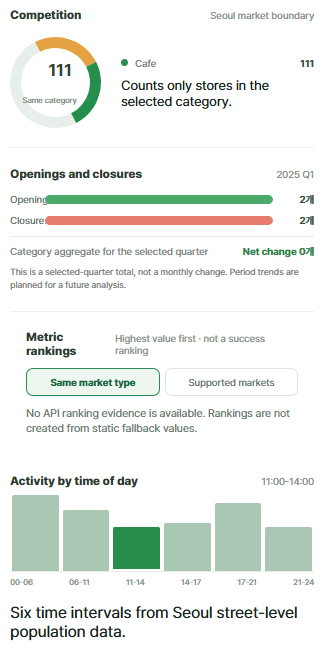
See same-category competition, openings and closures, peer rankings, and time-of-day activity.
-
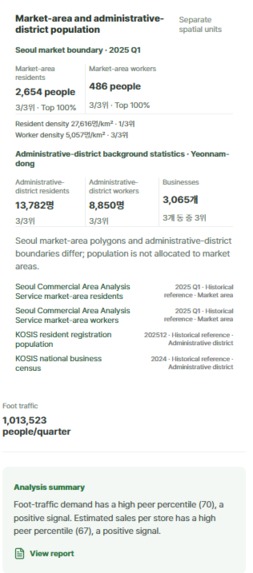
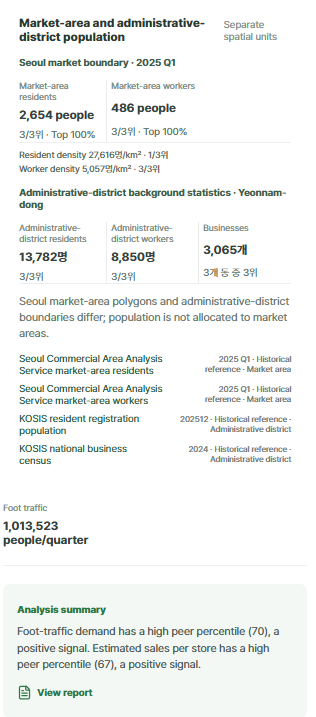
Trace each insight to its market-area or administrative-district source, period, and spatial boundary.
-
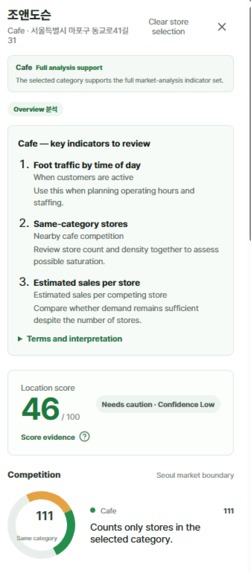
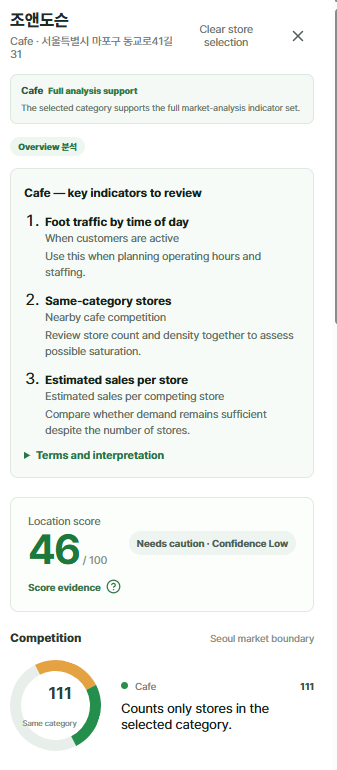
Review category-specific demand, competition, estimated sales, and an evidence-based location score.
-
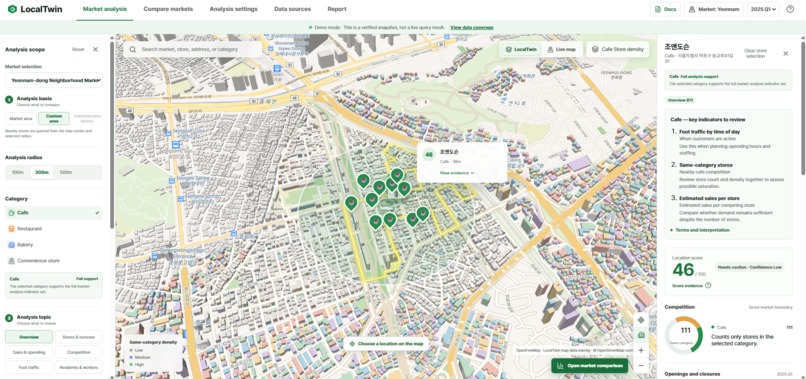
Interactive market map Explore a market area, choose a category and radius, and inspect nearby stores on the map.
Inspiration
Choosing where to open a small business is often based on a few walks around a neighborhood, online reviews, and intuition. That is understandable, but it makes it hard for a prospective owner to compare locations with evidence.
In Korea, useful public data exists for commercial areas, stores, sales, foot traffic, and population, but it is fragmented across different sources, periods, and category systems. I wanted to turn that scattered information into a map-first exploration experience: not a tool that promises the “perfect” location, but one that helps a person ask better questions before making a costly decision.
What it does
LocalTwin is an evidence-based commercial-area explorer for prospective small-business owners.
Users can search a supported Seoul commercial area or store, choose an industry, and inspect the result on an interactive map. The product brings together same-category competition, opening and closing signals, foot-traffic context, population context, and an explainable location score. Analysis results include their period, unit, method, and source information so that a number is not shown as unexplained certainty.
The current data-backed demonstration focuses on Yeonnam, Hongdae, and Hapjeong. This is an intentional vertical slice, not a claim that the product already supports all of Seoul.
The live-data experience is currently Korean-only. The underlying public datasets use Korean place names, industry categories, and field definitions, so the English demo is only a localized interface preview and does not claim to show live Korean public-data analysis. I chose to keep this limitation explicit rather than translate categories inaccurately or show unsupported data.
How we built it
I built LocalTwin as a React, TypeScript, and Vite web application with MapLibre for the interactive map. The frontend communicates with a FastAPI service, which uses SQLAlchemy and Alembic to access Supabase PostgreSQL.
For the data pipeline, official snapshots are collected and validated into a canonical SQLite database before being seeded into PostgreSQL. This gives the project a repeatable way to inspect source data, validate row counts and relationships, and keep runtime queries separate from raw-data processing.
I used Codex as an implementation partner throughout the project. It helped me inspect an existing codebase, split large components and API functions into smaller responsibilities, design focused tests, review edge cases, and keep commits and issues connected to verification results. I still made the product decisions, checked generated changes, and used tests and runtime behavior to confirm that a refactor preserved the intended result.
Challenges we ran into
The hardest challenge was not rendering a map. It was deciding what each number should mean.
Commercial-area boundaries, administrative boundaries, individual store coordinates, and data periods do not always line up. For example, an administrative-area population number cannot automatically be treated as the exact population of a commercial area. I had to keep the data source, period, unit, and calculation method visible so that the interface would not imply more precision than the data supports.
Another challenge was keeping the project realistic. It was tempting to add city-wide search, advanced ranking, and a 3D exploration feature using Gaussian Splatting—similar in concept to using Google Maps to inspect a place before visiting it. The idea was to let prospective small-business owners view foot-traffic data alongside a visual representation of the surrounding streets and environment, helping them gain a more tangible sense of the location. Instead, I limited the supported area, kept the 3D scene API disabled in the public environment until privacy and authorization controls are complete, and focused on a working search-to-analysis flow.
Accomplishments that we're proud of
- Built a working React → FastAPI → PostgreSQL search and analysis flow instead of relying only on static mock data.
- Created a repeatable public-data pipeline with source metadata, validation, canonical SQLite checks, and PostgreSQL migration and seed steps.
- Made the location score explainable through peer comparisons, source information, periods, units, and calculation evidence.
- Refactored large frontend and backend responsibilities into smaller, testable modules while preserving behavior through regression tests.
- Kept the public demo honest about its supported geography, Korean-data limitation, and unverified 3D/privacy features.
What we learned
Using AI coding tools was most useful when the task had a clear boundary: inspect a module, explain its current responsibility, propose a small change, add a focused test, and verify the result. Codex accelerated repetitive work such as tracing dependencies, drafting test cases, finding duplicated responsibilities, and suggesting a safe sequence for refactoring.
It also taught me where AI should not be trusted blindly. AI can produce code that looks plausible while changing a data meaning, hiding an edge case, or assuming that a source is reliable. For this project, I learned to treat generated code as a proposal rather than an answer: check the source data contract, keep the change small, run the relevant tests, inspect the actual UI or API response, and document what is still unverified.
The biggest benefit was not simply writing code faster. It was being able to ask better technical questions while building: where should a state live, what does this metric actually mean, what belongs in a database versus a fixture, and what evidence proves that a change works?
What's next for LocalTwin
Next, I plan to improve the core exploration experience rather than expand language support first.
The immediate focus is map and analysis UX: making selected locations, commercial-area boundaries, filters, nearby stores, dates, and analysis panels update together in a way that is easy to understand. I also want to make each metric explain what it means for the selected industry, instead of only showing a chart or score.
A second focus is the 3D site-exploration feature. LocalTwin already has an experimental path for processing a captured scene and viewing a Gaussian Splatting asset. The next step is to validate that workflow with real user-captured photos or 360-degree video, add privacy processing for faces and license plates, and keep scene assets protected behind authentication, ownership checks, and usage limits before exposing them publicly.
The goal is to make LocalTwin feel less like a collection of data panels and more like a trustworthy decision-making workspace: explore a location, understand the evidence, and inspect the site in context.
Built With
- alembic
- codex
- fastapi
- gaussiansplatting
- maplibre
- nerfstudio
- openstreetmap
- postgresql
- pytest
- python
- react
- render
- sqlalchemy
- sqlite
- supabase
- three.js
- typescript
- vercel
- vite
- vitest

Log in or sign up for Devpost to join the conversation.