Empty offices, meet your new tenants. From spreadsheets to bedsheets.
Inspiration
Every night, downtown Houston lights up a skyline of empty offices. A few miles away, a family is choosing between rent and groceries. We kept asking one question: why can't those towers be their home?
Houston has too much office space.
- About one in four square feet of Houston office space sits empty: 25.2% at the end of 2025 (CBRE) and 25.6% in Q3 2026 (Newmark). Downtown's rate is one of the highest in the country.
- In Q1 2026, Shell's downtown lease of more than 500,000 sq ft expired.
- Owners have started demolishing office buildings, because "land now outweighs the building."
Houston doesn't have enough homes people can afford.
- More than half of Houston-area renters spend over 30% of their income on rent (Kinder Institute, State of Housing 2026).
- Average rent in the region was \$2,050 a month in Q1 2026 (Houston Association of Realtors). The median household income is about \$65,000 (US Census).
The law changed: Texas SB 840 and SB 2477, in effect since 1 September 2025.
- An office building at least five years old can now become homes by right: no rezoning, no traffic study, no extra parking.
- The condition: at least 65% of the building has to become homes.
- It is starting. Downtown's One City Centre, at 1021 Main Street, is being converted into 553 homes.
So why are the towers still empty? Conversions happen one building at a time, after months of consultants, and most towers never get looked at. Three things stand in the way:
- The floors are too deep. A bedroom needs a window, but the middle of a typical downtown floor is 60 to 120 ft from the glass. 52 of the 58 downtown towers we mapped are more than 90 ft deep, and on average only 47% of a floor is close enough to a window for a bedroom.
- The tenants are in the way. A tower that is 40% empty can't reach 65% homes while its tenants sit on scattered floors with long leases.
- Nobody trusts the numbers. Occupancy records, floor heights and scans disagree, and one wrong guess about floor height can sink a whole project.
We built Lightwell to answer, for the whole of downtown in minutes: which tower should we look at first, and why?
What it does
You ask in plain English:
"Find offices downtown I can turn into homes for under \$300k a home."
A team of AI agents takes it from there, and you watch every step live.
- It turns your words into a brief. The request becomes clear rules on screen: cost cap, minimum homes, how close a bedroom must be to a window, whether a courtyard can be cut, and which data must be real.
- It reads the market and the building.
- CoStar records: leasing, empty floors, tenants and lease ends, year built, sprinklers, sales.
- Matterport 3D scans: the clear ceiling height inside the building.
- OpenStreetMap: the real footprints and heights of 1,220 downtown buildings.
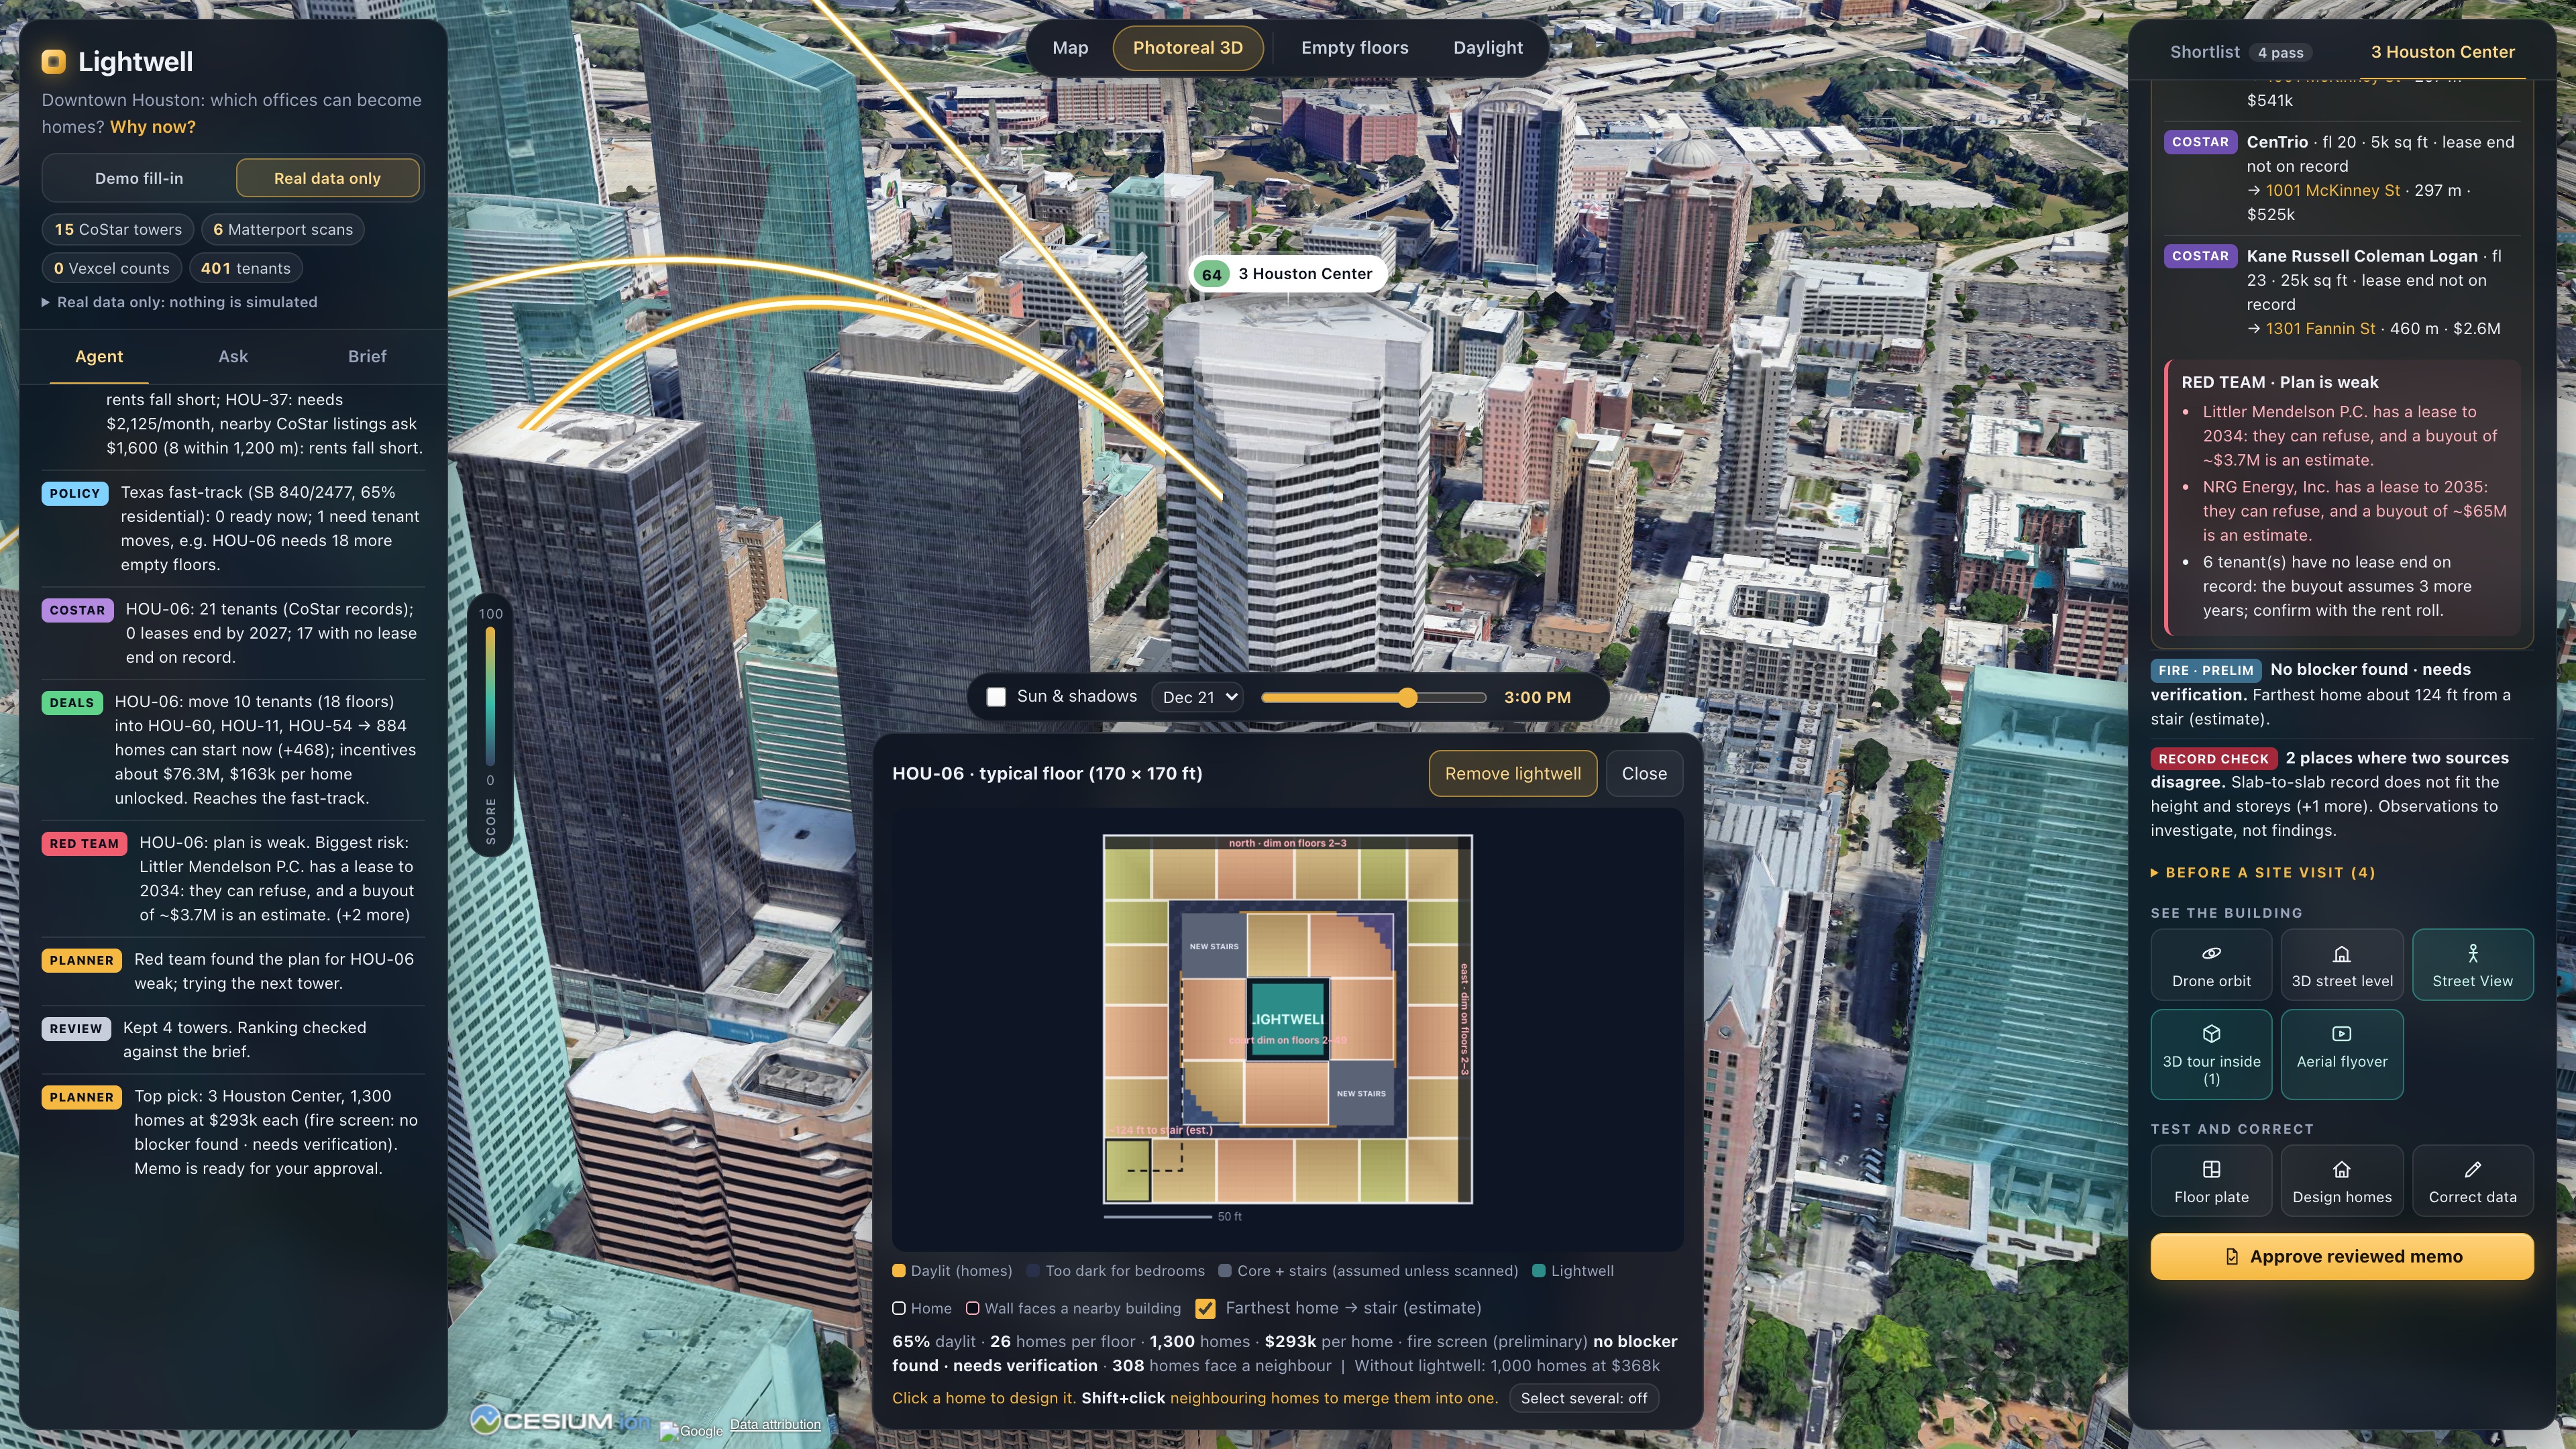
- It tests every floor of all 58 office towers. It lays out homes, keeping only those where the bedroom is within about 30 ft of a window. Where a floor is too deep, it cuts a lightwell, a courtyard down through the middle of the floor, and re-runs homes, cost and score.
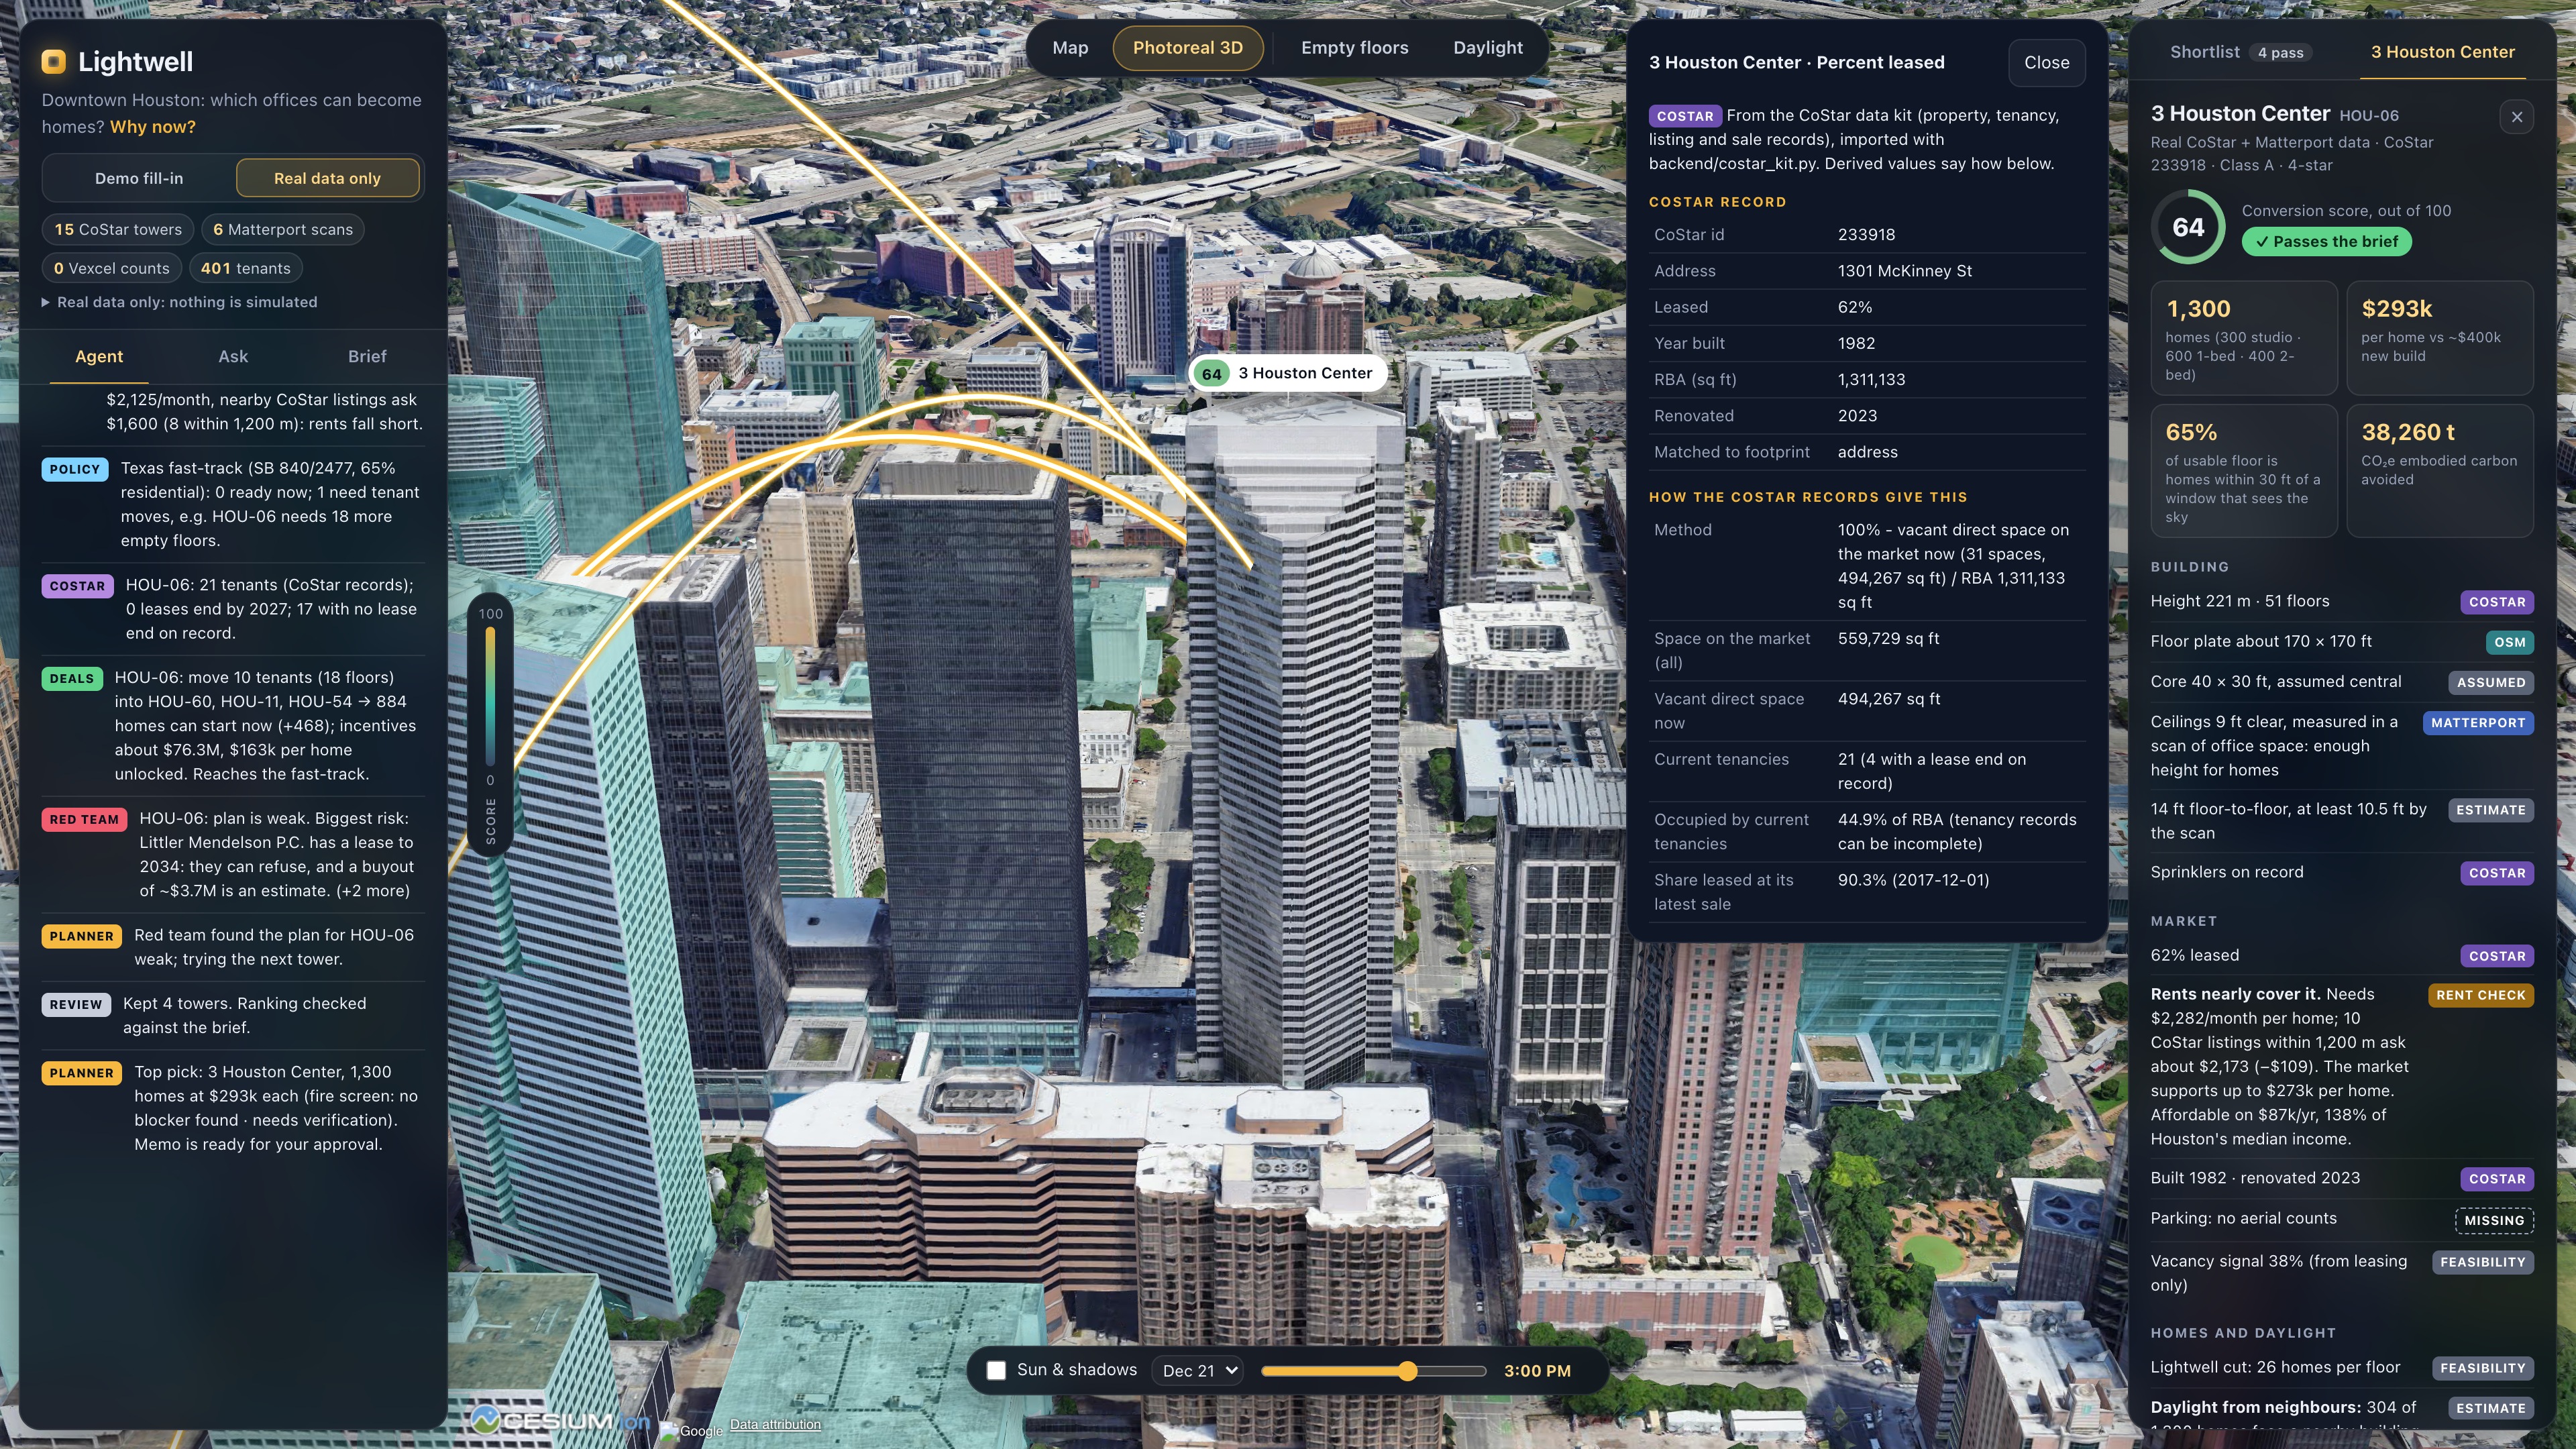
- Daylight X-ray. A window that faces a wall isn't really a window.
- Every window wall is checked, floor by floor, against the real neighbouring buildings.
- Red lines point to the building that blocks the light.
- Photoreal 3D plays real sun shadows for any hour of the shortest and longest days.
- It runs a preliminary fire screen. Distance from the farthest home to a stair, the distance between stairs, and whether sprinklers need adding. It says what is measured and what is assumed, and it never calls a tower fire-safe.
- It checks the Texas 65% rule, then plans the tenant moves that unlock a tower.
- A deal-maker agent moves the tenants whose leases end soonest into nearby half-empty offices and prices the incentives. Gold arcs on the map show every move.
- A red-team agent then attacks the plan. If it breaks, the planner moves on to the next tower.
- It checks the rent. It compares the rent each home needs to pay back its conversion with real CoStar asking rents nearby. It also shows the most the market can pay to build each home, and the income needed to afford it.
- It asks you the one question that matters, then replans. It tries a worse plausible value for every estimate on the shortlist. If one would change the decision, it stops and asks you for that measurement: > "HOU-53 now fails: floor-to-floor under 10.5 ft. New leader: HOU-34."
Where a Matterport scan already measured the ceiling, it doesn't ask at all: "settled without a site visit."
- It fills gaps without inventing data. A data-scout agent estimates occupancy for towers CoStar doesn't cover, from the most similar towers it does cover. Each estimate comes with a range, a confidence and the towers it used, and is labelled ESTIMATE. The scout also ranks which towers to ask CoStar about next.
- It cross-checks the records. Where two sources disagree, it shows both sources and both values. These are observations to investigate, never accusations.
- It shows you the homes, not just the numbers.
- Click any home on a floor plate for 3 to 5 concept apartment plans. Every plan is checked: no bedroom without a window, no room under the minimum size.
- Merge two neighbouring homes into a family-sized one.
- Take the Matterport 3D tour inside the real building, or watch a Google aerial flyover of it.
- You stay in charge.
- Correct any value and the agent re-ranks.
- Ask the built-in Ask Lightwell chat "Why is the top pick #1?" or "What if the cap were \$350k?"
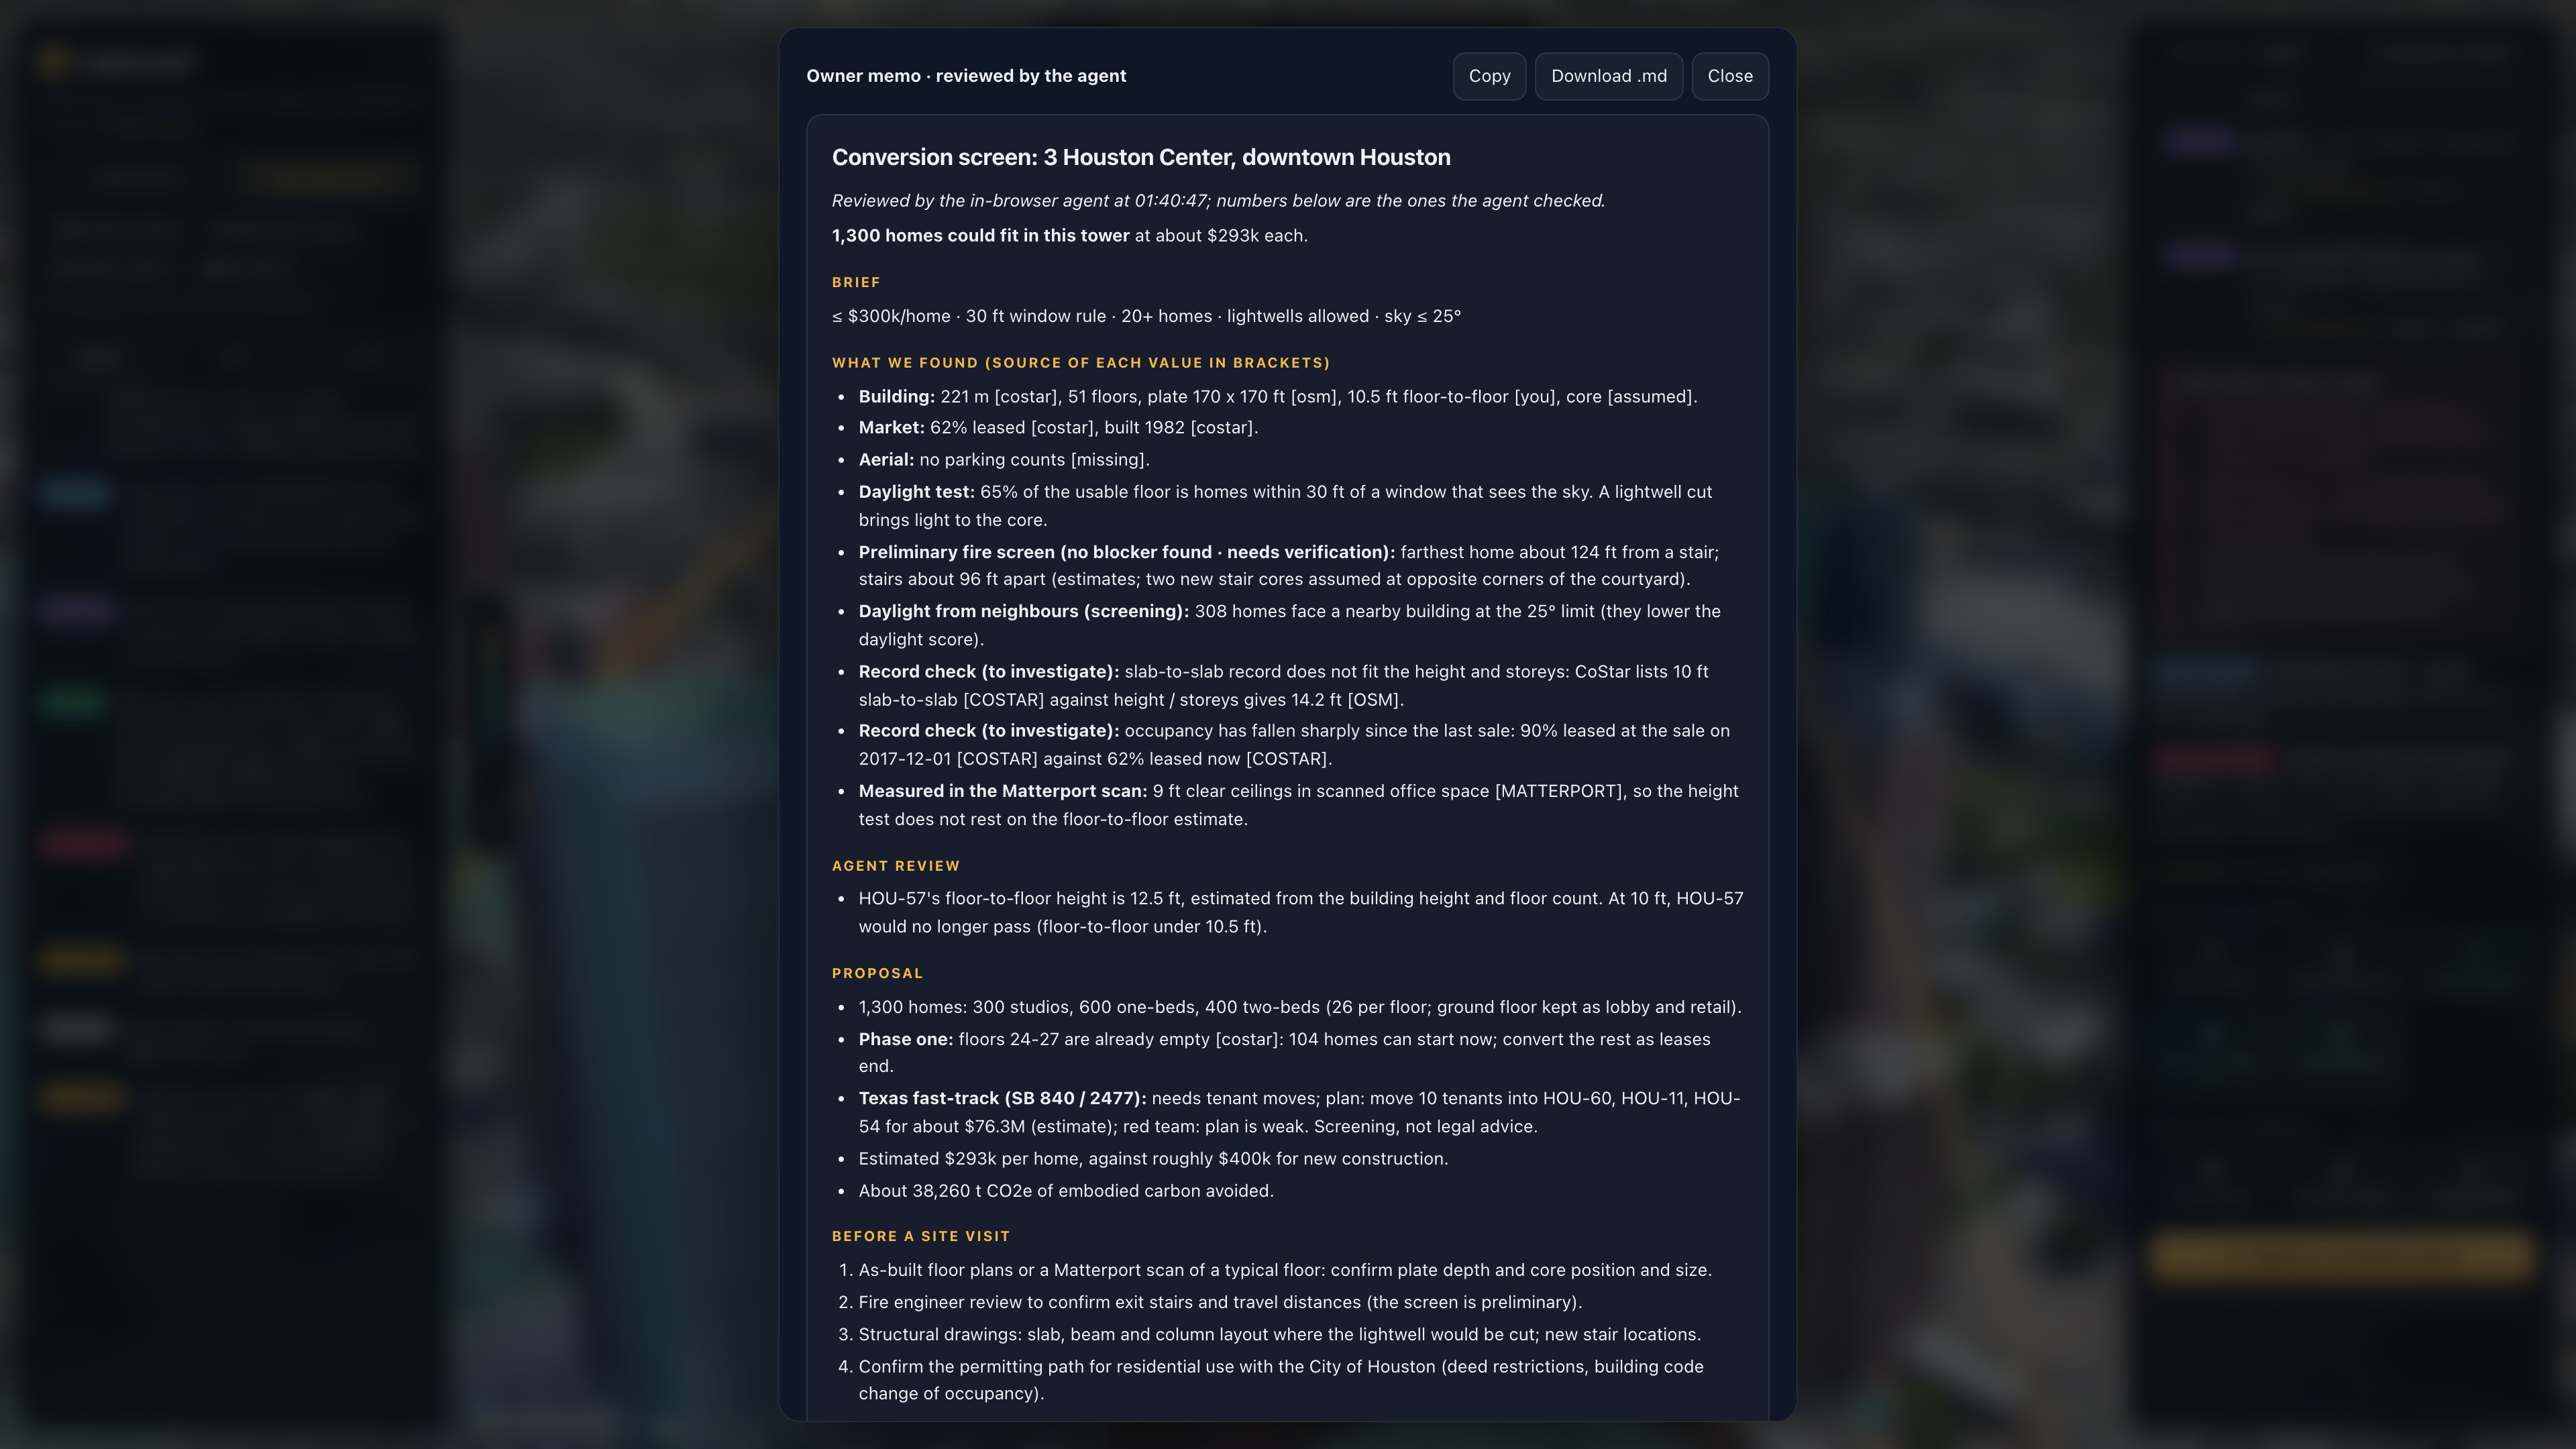
- Approve the owner memo the agent drafts.
- Lightwell remembers your brief and corrections, and the team's runs are saved to a shared history.
Every number carries a source tag: COSTAR, MATTERPORT, OSM, ESTIMATE, ASSUMED, SIMULATED, MISSING or YOU (a value you entered yourself). Click a tag to see the evidence behind it.
What you get out of it
The top tower in our demo run (HOU-53, a 12-storey downtown office tower):
| Homes | 110 (66 studios, 44 one-bed) |
| Share of the floor with daylight for bedrooms | 74% |
| Cost per home | \$245k, against about \$400k to build new |
| Embodied carbon avoided | about 2,900 t CO₂e (an estimate; the assumptions are editable) |
| Rent each home needs | about \$2,010 a month |
| Ready to hand over | owner memo, site-visit checklist, CSV with a source for every field |
Across all 58 downtown towers, the floor plates hold room for about 35,000 homes with a bedroom near a window. Reusing those towers instead of building new would avoid roughly 1.3 million tonnes CO₂e. Both are upper-bound screening estimates; cost, tenants and the fire screen narrow them to a short list.
Who it's for
- Owners and lenders with a half-empty tower and a loan coming due: convert, sell or demolish?
- Brokers and developers looking for the next conversion.
- City housing staff: which towers could deliver homes under SB 840, how many, and what incentive would close the gap.
[TO DO] We consulted *[person], [role] at [business]*: "[quote]". What they asked for now leads every site-visit checklist and owner memo. (Delete this paragraph if the interview didn't happen.)
How we built it
The agents: LangChain deepagents + Claude
- A planner built with
create_deep_agent, with six sub-agents: market-analyst, data-scout, feasibility-engineer, policy-analyst, deal-maker and red-team. - 25 tools, including ranking, daylight, fire, the 65% rule, tenant moves, the rent check, evidence review and the owner memo.
- The planner can stop mid-run to ask a human a question, then replan from the answer.
- Ask Lightwell is a second deepagent with the same tools.
- Served by FastAPI, with every step streamed live to the page.
- Without an API key, the same tools run in a fixed order, so the demo never depends on an AI service.
The engine: written twice, tested to match. All the maths runs in JavaScript (the page) and Python (the agent). A parity test checks that both give identical numbers on every tower in eight scenarios. Another test runs every apartment plan on every home of every tower.
The three formulas behind the decisions:
Conversion score. It combines daylight share D, vacancy V, cost K, ceiling height H, building age A and the fire screen F, each from 0 to 1:
$$S = 100\,(0.30\,D + 0.26\,V + 0.20\,K + 0.06\,H + 0.08\,A + 0.10\,F)$$
Rent needed per home. From cost per home C, target yield y (6.5%), yearly running cost O (7,000 dollars) and vacancy v (5%):
$$R = \frac{C\,y + O}{12\,(1 - v)}$$
For HOU-53:
$$R = \frac{245{,}000 \times 0.065 + 7{,}000}{12 \times 0.95} \approx 2{,}010 \text{ dollars a month}$$
Embodied carbon avoided. From the converted floor area A in m², 500 kg CO₂e per m² for new construction and 60% saved by reuse:
$$E = A \times 500 \times 0.6 \text{ kg CO}_2\text{e}$$
The 60% sits inside the 53–75% range published studies report for building reuse.
The data
- CoStar hackathon data kit: downtown office towers, tenants and leases, sales and asking rents.
- Matterport Model API: ceiling height and floor area from CoStar's scans.
- OpenStreetMap: 1,220 footprints and heights. A precomputed sky view from every wall of every tower powers Daylight X-ray.
- [TO DO] Vexcel: say whether aerial images were loaded. Built and ready: the parking importer and a Claude-vision car counter that turns a parking-lot photo into an occupancy signal.
The views: MapLibre GL for the 3D map; CesiumJS with Google Photorealistic 3D Tiles for the real city with real sun shadows; Matterport 3D tours; Google Aerial View flyovers.
Live on the web: one Docker image on DigitalOcean serves the site and the agent API. MongoDB Atlas stores every run as the team's shared history, and an Atlas aggregation shows which towers keep winning across everyone's briefs.
Challenges we ran into
- Honest data. Real records, estimates and gaps sit side by side, so we tagged every field, not every building. A made-up number never sits next to a real building's name.
- Scans aren't floor plans. Most Matterport scans cover one suite or a lobby, so we use only scans of office space, require 2,000 sq ft of them per building, and use what they truly measure: ceiling height and floor area.
- Daylight is 3D. A window 20 ft from a bedroom is useless if a tower stands 40 ft away. We precomputed what every wall can see, so the check runs instantly in the browser.
- Two engines, one answer. Every rule had to give the same number in JavaScript and Python, down to the rounding.
- Knowing when to ask. An agent that asks about everything is as useless as one that asks about nothing. Ours asks only when the answer would change the decision.
Accomplishments that we're proud of
- The agent settles its own biggest unknown, "is the floor tall enough?", from inside the building, using CoStar's records and Matterport's scans together.
- A tenant-move plan that a second agent tries to break before you ever see it.
- A rent check that uses only real CoStar asking rents. With no rents loaded, it says so instead of inventing them.
- It never calls a tower fire-safe and never accuses anyone: screens are called screens, and discrepancies are observations.
- It works end to end without an API key, and gets smarter with one.
What we learned
- Combining layers is where the value is. A record, a scan and a footprint each look fine alone. Side by side, they show which towers are worth a visit and which records need checking.
- Trust comes from showing the working. People believed the agent more when it said "this is an estimate, and here's what changes if it's wrong."
- Housing is a geometry problem first. Before money or law comes one question: does the bedroom get a window?
What's next for Lightwell
- Vexcel parking counts over several dates, as a third, independent read of occupancy.
- Full-floor scans to measure floor plates directly.
- More Texas cities. SB 840 also covers Dallas, Austin and San Antonio, so the same agent works there with their data.
- A "what would make it work?" solver that finds the smallest change (incentive, rent or lightwell) that makes a failing tower pass.
Sources:
- CBRE Houston Office Q4 2025
- CRE Daily on Newmark Q3 2026
- Partners Houston Office Q1 2026
- CRE Daily on Houston's demolitions
- Kinder Institute, State of Housing 2026
- ABC13 on the HAR affordability study
- Foley on SB 840 and SB 2477
- The Real Deal on One City Centre
- Historic England on embodied carbon
Tower counts, depths, daylight shares, homes and carbon were computed by Lightwell from OpenStreetMap footprints, with the default assumptions shown in the app.
Lightwell is a screening tool: it tells you where to look first. An architect, a fire engineer and a cost consultant make the final call.
Built With
- anthropic
- cesium
- claude
- costar
- deepagents
- digitalocean
- docker
- fastapi
- google-3d-tiles
- google-aerial-view
- google-maps
- javascript
- langchain
- maplibre
- matterport
- mongodb-atlas
- openstreetmap
- python
