Inspiration
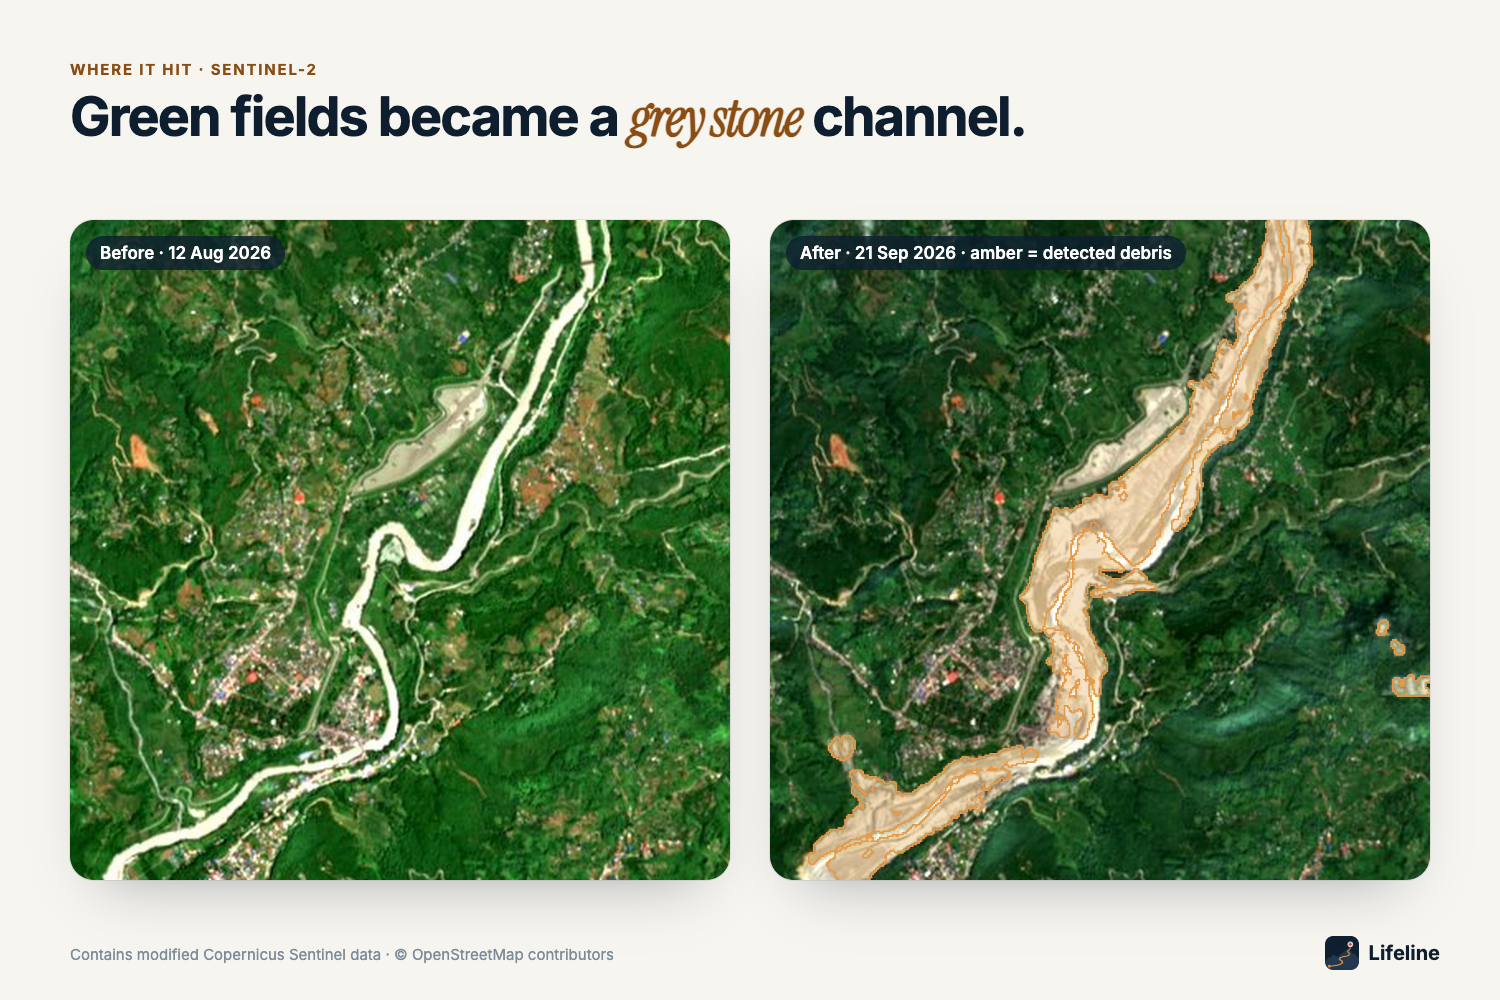
On 26 August 2026 a glacier collapsed above the Bhote Koshi in Nepal and sent a debris flood down the Trishuli valley. Monsoon cloud hid it from the free optical satellites for weeks. For a district disaster office the first question is which villages can still reach a hospital, and which repair gets most of them back. Lifeline answers that from free satellite data.
What it does
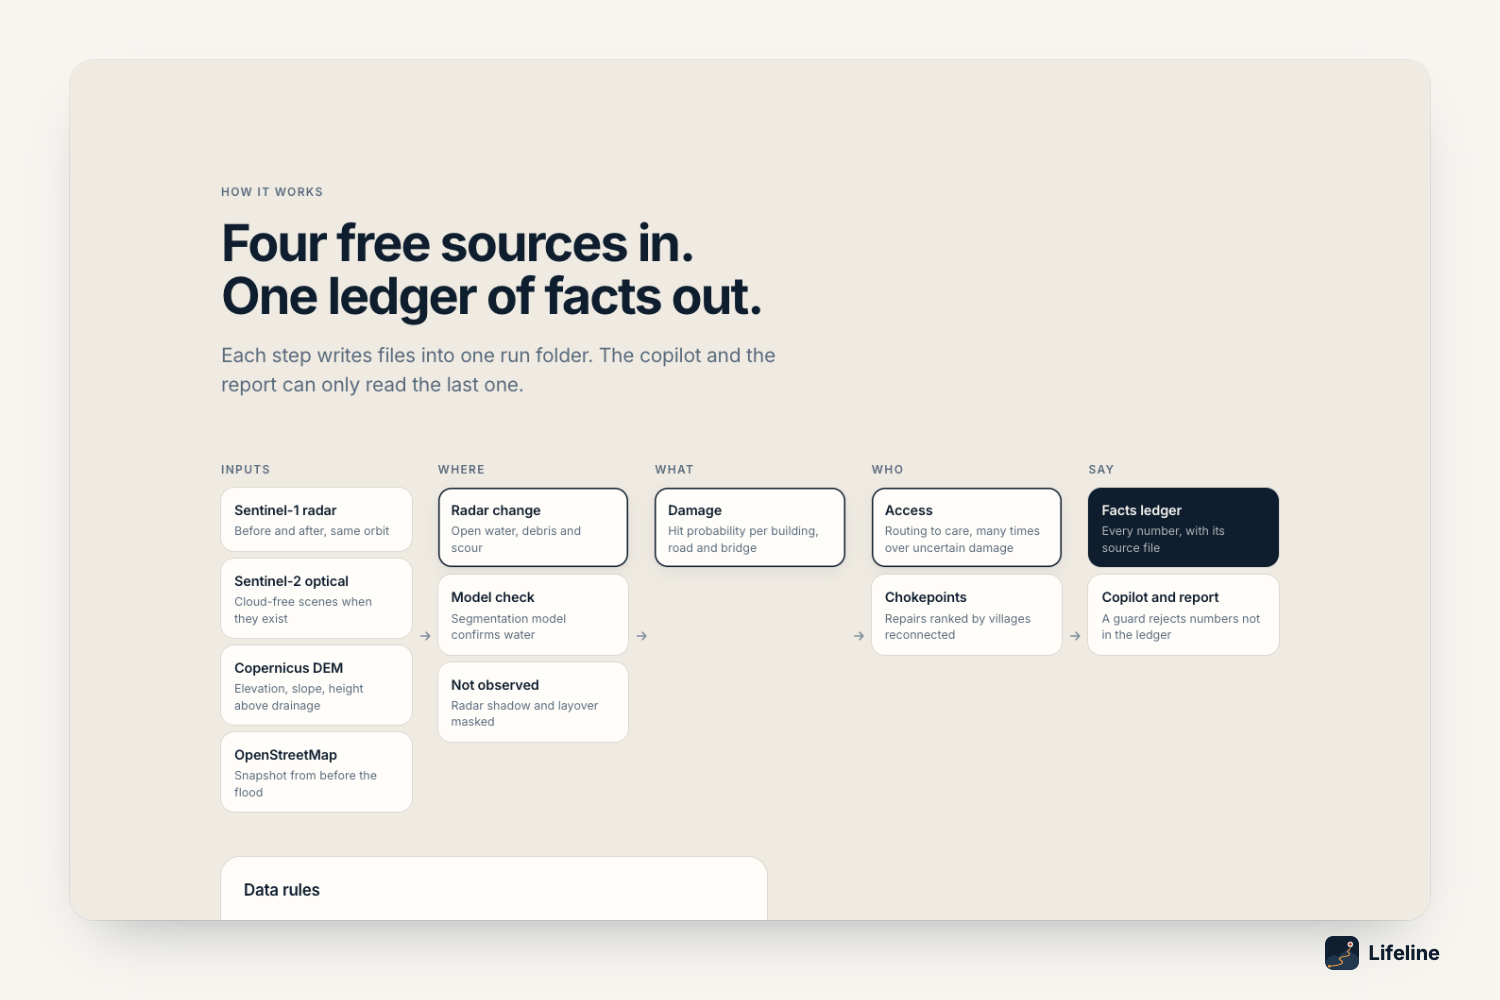
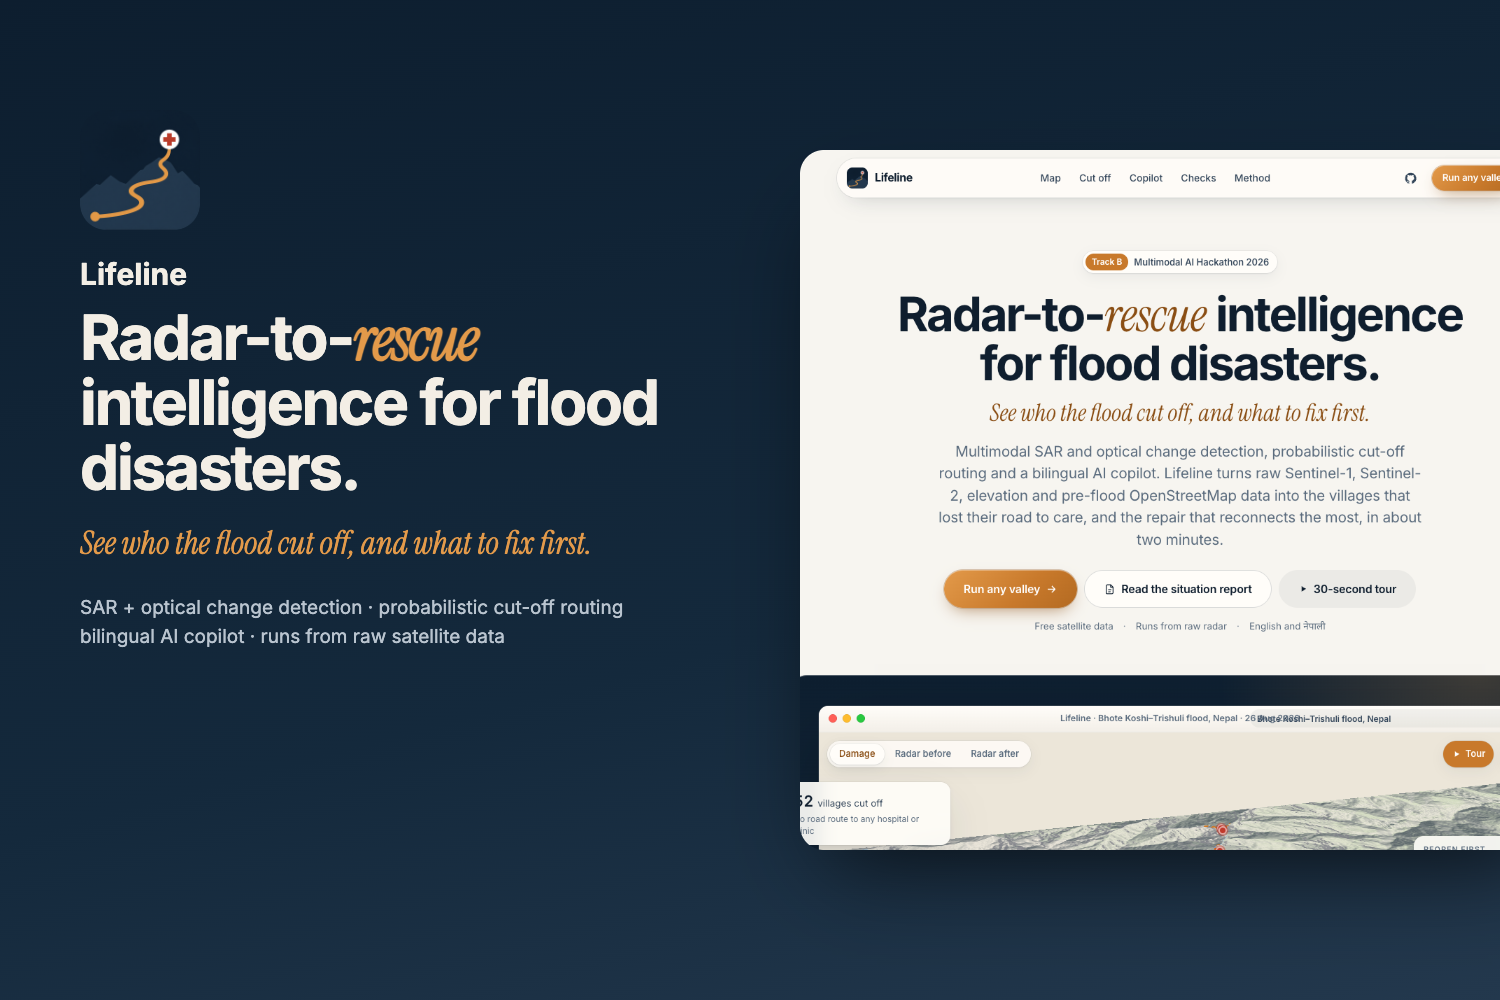
Radar-to-rescue intelligence for flood disasters. Give it any area and any flood date. It reads Sentinel-1 radar, Sentinel-2 optical, the Copernicus 30 m elevation model and OpenStreetMap as it stood before the flood, and answers the three Track B questions:
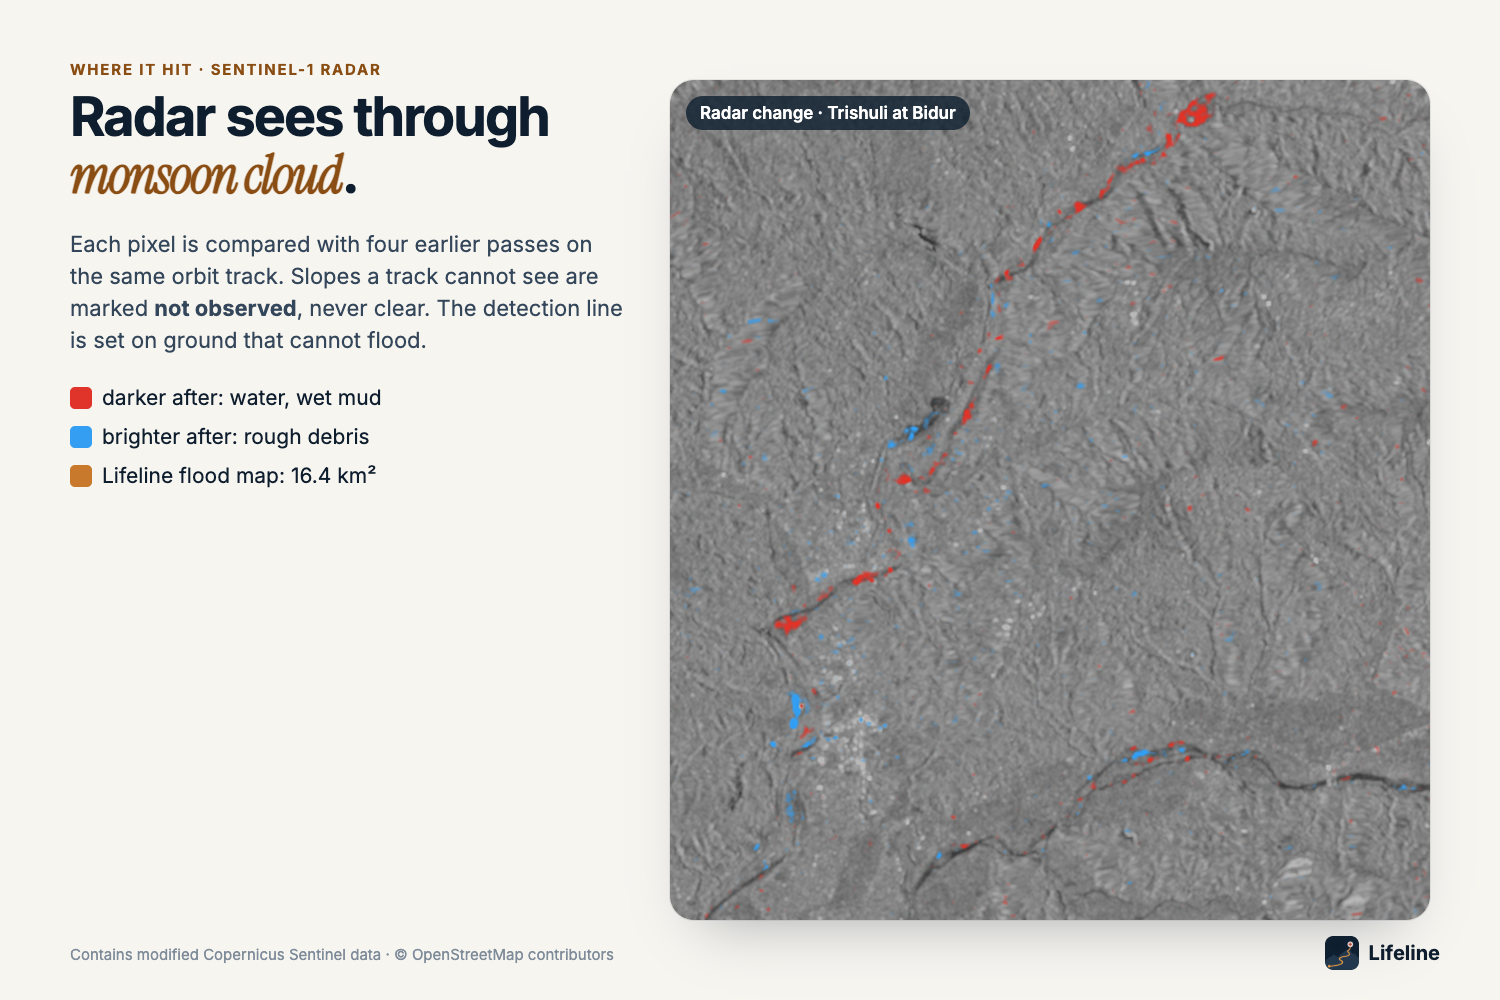
- Where did the flood hit? Same-orbit radar change detection against each pixel's own pre-flood normal, fused with Sentinel-2 where the sky cleared. Slopes the radar cannot see are marked not observed, never "clear".
- What was damaged? Every building, road and bridge in pre-flood OpenStreetMap gets the flood probability it is exposed to.
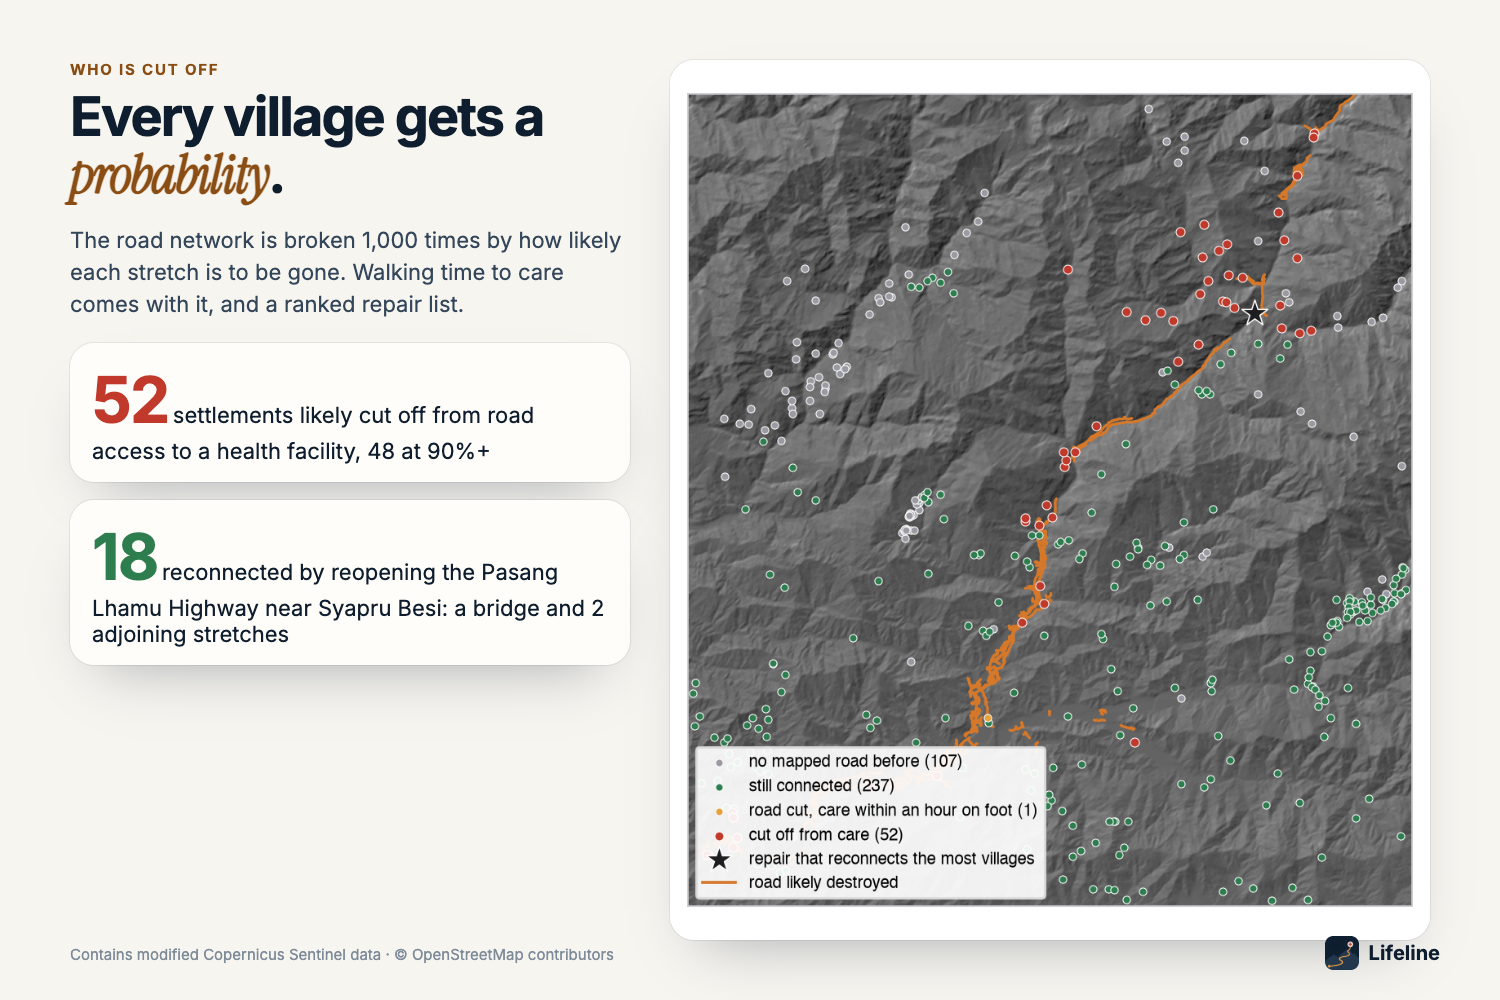
- Who is cut off? The road network is broken 1,000 times by how likely each stretch is to be gone. Every settlement gets a probability of having no road to a hospital or clinic, plus drive and walking times, and a ranked repair list.
Both AI options are built and tested:
- Flood segmentation model: a U-Net (ResNet-34) trained on Sen1Floods11 with India and Pakistan held out entirely.
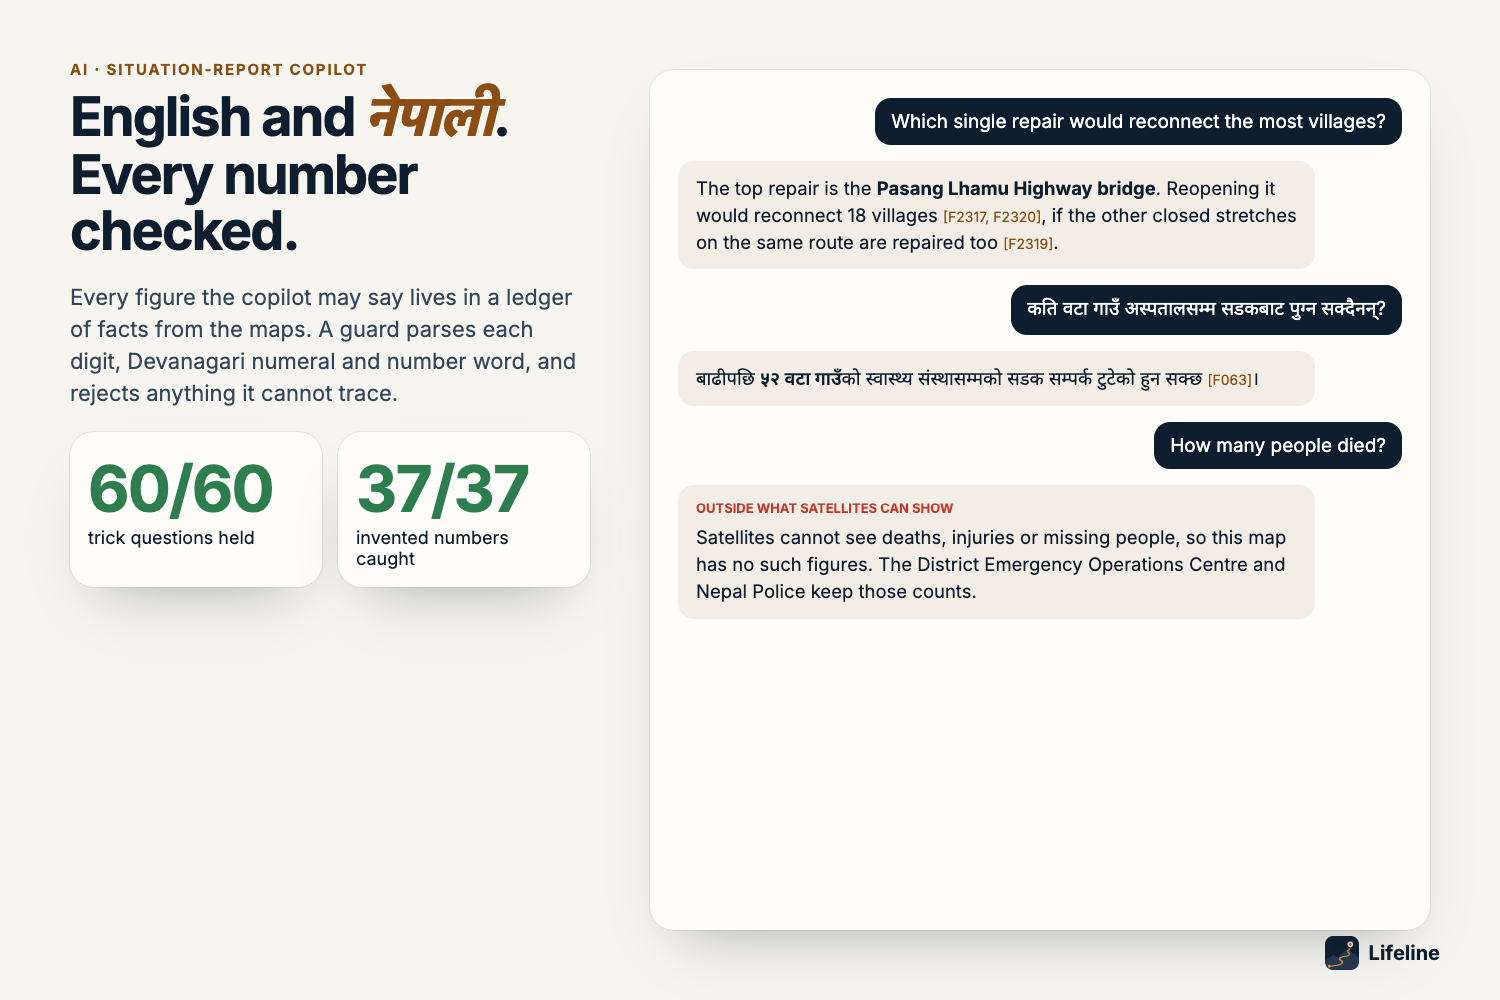
- Situation-report copilot in English and नेपाली: every number it may say lives in a ledger of facts built from the maps, and a guard rejects any figure it cannot trace.
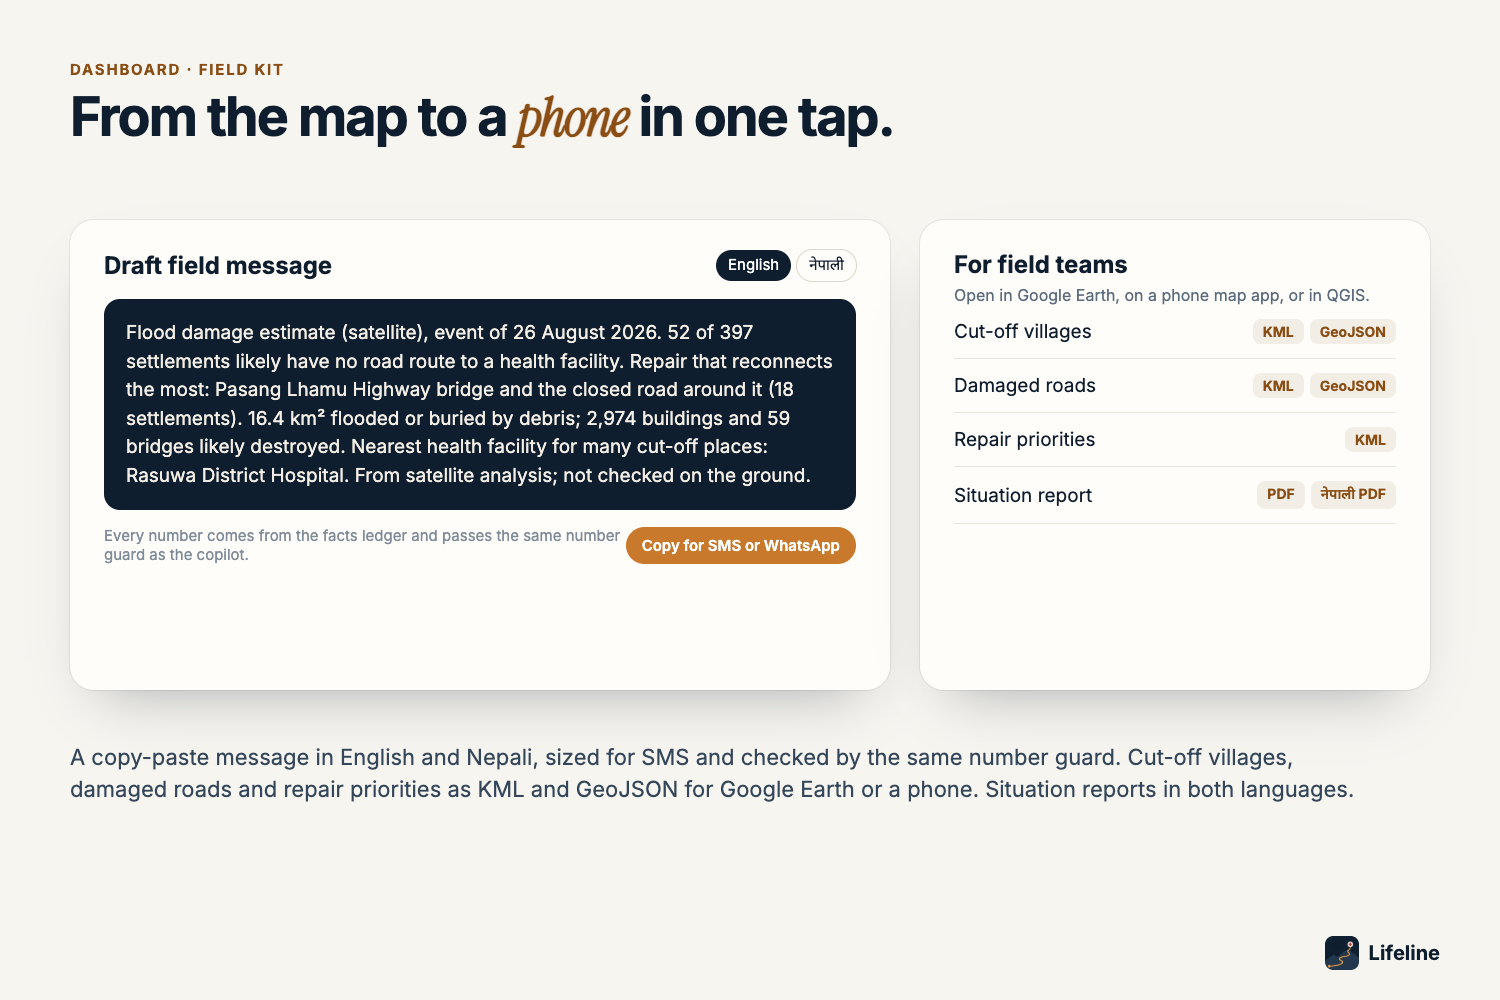
Bonus: flood path tracing from any upstream point, a copy-paste SMS/WhatsApp field alert in both languages, KML/GeoJSON downloads for field teams, and a 30-second guided 3D tour.
Case study: Bhote Koshi-Trishuli, 26 August 2026
- 16.4 km² flooded or buried by debris (2.3 km² new water, 14.1 km² debris)
- 108.9 km² the radar could not see, marked as such
- 2,974 of 188,933 buildings likely destroyed
- 99.6 km of road under mapped debris
- 59 of 353 bridges likely destroyed
- 52 settlements likely cut off from road access to a health facility (48 at 90%+)
- Top repair: reopening the Pasang Lhamu Highway near Syapru Besi (a bridge and two adjoining closed stretches) reconnects 18
Checked against the official maps
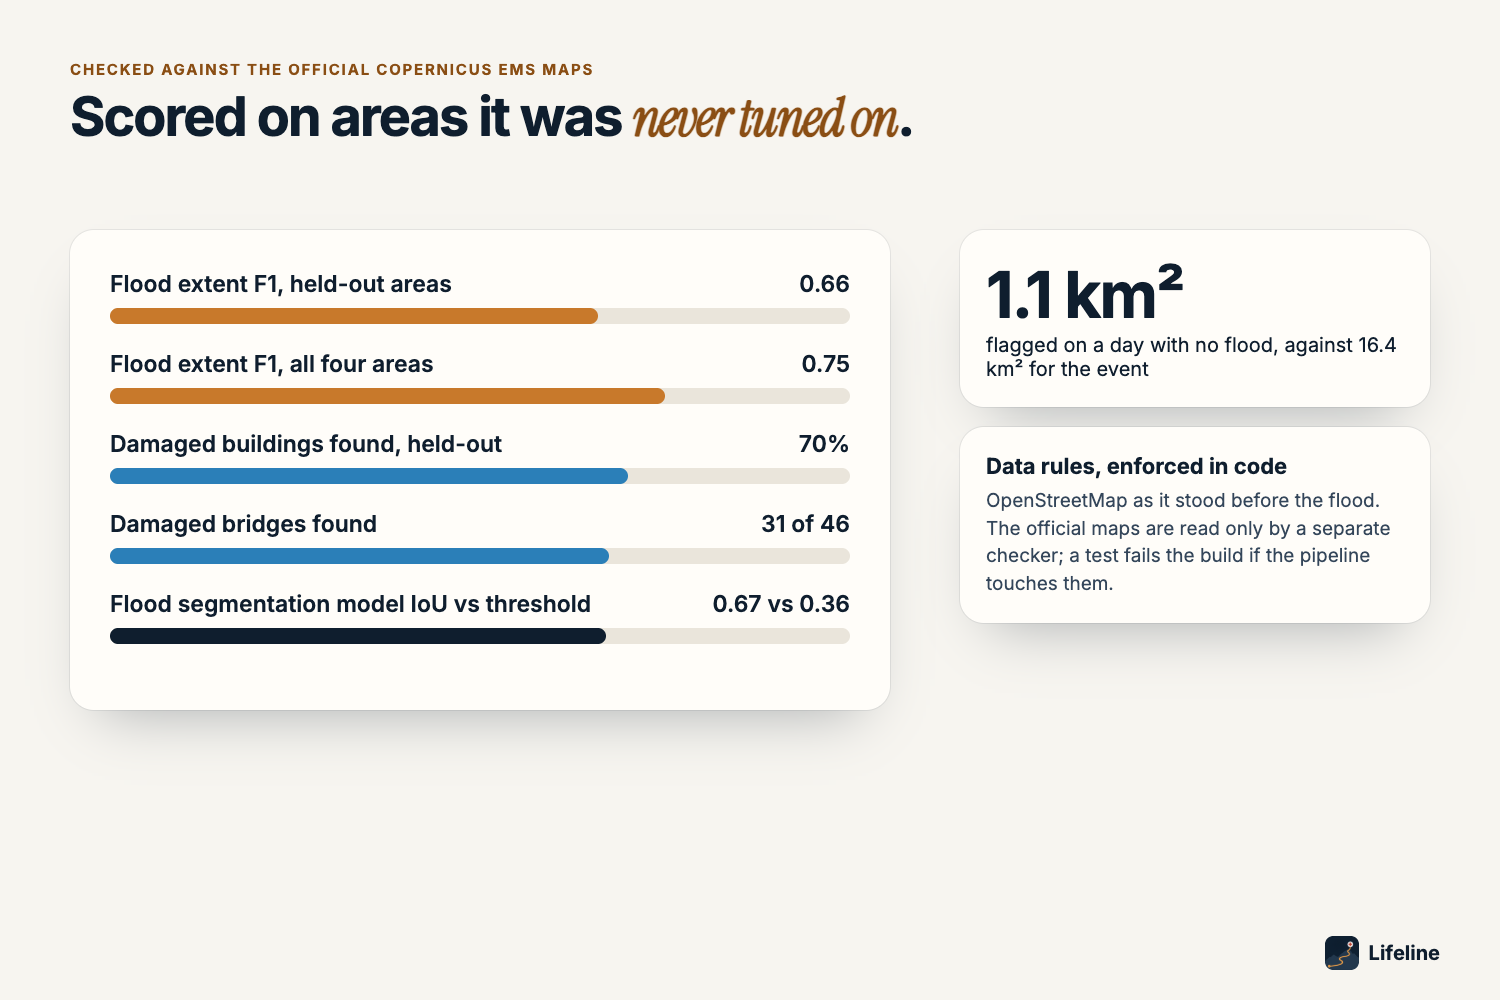
Copernicus EMS activation EMSR927 was used only by a separate checker, never as input; a test scans the pipeline source code for references to the EMS files and fails if it finds one. Settings were chosen on one official area only and frozen.
- Held-out areas: flood extent F1 0.78 for the full map (detected flood plus water from the flood model and an inferred river corridor) and 0.66 for detected flood alone; Phosretar 0.85. 70% of officially damaged buildings found, 18 of 28 damaged bridges. Damage and cut-off use detected ground only.
- All four areas: F1 0.75, precision 0.86; 88% of damaged buildings; 31 of 46 bridges.
- Who is cut off: routing on the same drivable roads with the EMS-graded destroyed roads closed, EMS implies 38 settlements cut off; Lifeline finds 33 (recall 87%). On routes that cross an EMS area, 33 of its 35 cut-off calls are confirmed (94%), and agreement is 57 of 64 against 26 for calling nobody cut off. (An earlier version of this check routed over footpaths too and implied only 7.)
- False alarms: 727 of the 2,617 buildings Lifeline flags inside the EMS areas have no EMS damage record (about 72% have one). 47% of the graded road length it flags lies on stretches EMS saw as undamaged.
- A day with no flood: 1.1 km² flagged, against 16.4 km² for the event (this date also constrained the radar settings).
- Water model: IoU 0.67 against 0.36 for a radar threshold on Sen1Floods11; 0.47 against 0.37 on South Asian floods it never saw. On the Trishuli scene it never saw, checked against the official extent: precision 0.97 against 0.94 for the radar water rule, recall 0.17 against 0.12 (that extent is mostly debris, which a water model is not trained to see).
- Copilot red team: 60 of 60 attack and ordinary prompts in English, Nepali and romanised Nepali pass; 37 of 37 planted fabrications caught.
How we built it
- Data: Sentinel-1 RTC, Sentinel-2 L2A and Copernicus DEM from Microsoft Planetary Computer (STAC, no account); OpenStreetMap from the ohsome API at a snapshot no later than 27 July 2026, so no post-flood edit can enter.
- Mapping: each pixel's after-image value is scored against its own pre-flood history on the same orbit track,
$$ z = \frac{x_{\text{after}} - \operatorname{median}(x_{\text{before}})}{1.4826 \cdot \operatorname{MAD}(x_{\text{before}})} $$
with four earlier passes as the baseline; per-track layover and shadow from the DEM; a detection line set on ground more than 150 m above any stream, so the false-alarm rate comes from the data, not the answer key; hysteresis growth along low valley ground; Sentinel-2 NDVI loss and new water fused on valley ground next to radar damage.
- Access: a routable graph from pre-flood roads with Monte Carlo closures per OSM way. Each village's probability of being cut off is the share of 1,000 simulated networks in which it cannot reach any health facility:
$$ p_{\text{cut-off}}(v) = \frac{1}{N}\sum_{i=1}^{N} \mathbb{1}\left[\, v \not\leadsto H \text{ in network } G_i \,\right], \quad N = 1000 $$
Also: health facilities as destinations, walking access, a greedy repair ranking that compares single fixes with multi-stretch repairs, and single-point-of-failure bridges.
- AI: PyTorch and segmentation-models-pytorch for the U-Net; the Anthropic API for the copilot, with four read-only tools over the facts ledger, a number guard for digits, Devanagari numerals and number words, one retry, then fixed templates. Spend is capped in code.
- Product: a FastAPI engine hosted on Modal (scales to zero), a MapLibre dashboard on Vercel, ReportLab for the bilingual one-page PDF.
Challenges we ran into
- Water drained within two days. The event shows as debris and scour, which can brighten or darken radar, so we test change in both directions and in VH.
- In the narrow gorge, debris barely changed the radar signal. Sentinel-2 vegetation loss, with settings chosen on one development area, lifted held-out F1 there from 0.28 to 0.55.
- An early cut-off model let every road keep a small closure chance; over long hill routes it cut off villages far from any damage. Only roads the map flags or cannot see can close now.
Accomplishments we're proud of
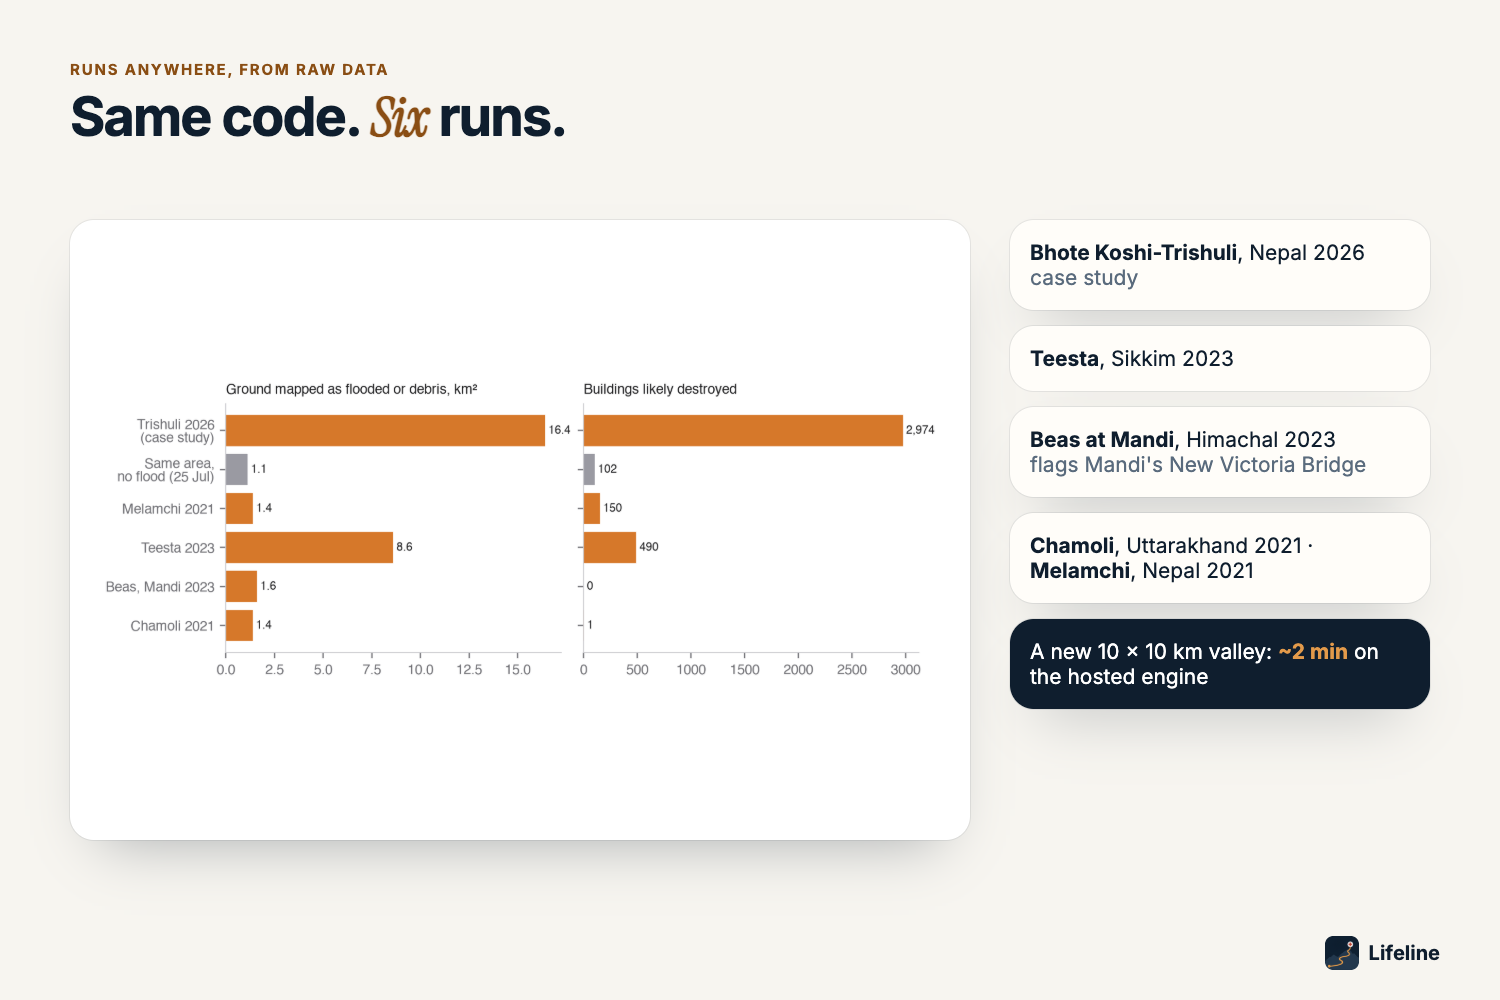
- A per-village probability of being cut off, with the repair that reconnects the most, from raw satellite data: a 10 × 10 km area in about 25 s to 2 minutes on the hosted engine, the 3,037 km² case study in 297 s.
- Outputs that state their limits: not observed where the radar cannot see, held-out scores up front, and a public list of every design choice the official maps influenced.
- The same code ran unchanged on Melamchi 2021, Teesta 2023, the Beas at Mandi 2023 (it flags Mandi's New Victoria Bridge) and Chamoli 2021.
Limitations
- Walking times follow only roads and footpaths mapped in OpenStreetMap. Where bridges are destroyed some walks become long detours (about 30 hours from Syapru Besi, the longest for a cut-off settlement), so they are an upper bound.
- The case-study box reaches a few kilometres into Tibet; places there are counted (one of the 52 cut-off settlements).
- Radar and Sentinel-2 settings were chosen on one EMS area (Bidur) and frozen. The other three were scored for every candidate but not used to choose, and their held-out scores are reported separately.
What we learned
A grey "not observed" is more useful to a rescuer than a confident but wrong "clear". The number guard has to check units as well as digits.
What's next
Field checks with a district emergency operations centre, population layers for people counts, and Sentinel-1 interferometric coherence for debris that leaves radar brightness unchanged.
Links
- Demo video: https://youtu.be/qGb5TOB1SoI
- Live dashboard: https://lifeline-flood.vercel.app
- Code: https://github.com/kinnuworks/lifeline
- Six-page report: https://github.com/kinnuworks/lifeline/blob/main/docs/REPORT.pdf
AI tools used
Code, documentation and analysis scripts were written with the help of Claude Code. The copilot calls the Anthropic API (Claude) to phrase answers; every number in those answers is checked against the facts ledger.
_Contains modified Copernicus Sentinel data 2026. Produced using Copernicus WorldDEM-30 © DLR e.V. 2010–2014 and © Airbus Defence and Space GmbH 2014–2018 provided under COPERNICUS by the European Union and ESA; all rights reserved. © OpenStreetMap contributors. The other case studies contain modified Copernicus Sentinel data 2021-2025. European Union, Copernicus Emergency Management Service data (EMSR927), used for checking only. Training data: Sen1Floods11 (Bonafilia et al. 2020).
Built With
- copernicus-dem
- fastapi
- gdal
- geopandas
- javascript
- kuro-siwo
- maplibre-gl
- modal
- numpy
- ohsome
- openstreetmap
- planetary-computer
- pyproj
- pystac-client
- python
- rasterio
- reportlab
- scipy
- segmentation-models-pytorch
- sen1floods11
- sentinel-1
- sentinel-2
- shapely
- uvicorn

Log in or sign up for Devpost to join the conversation.