💡 Inspiration
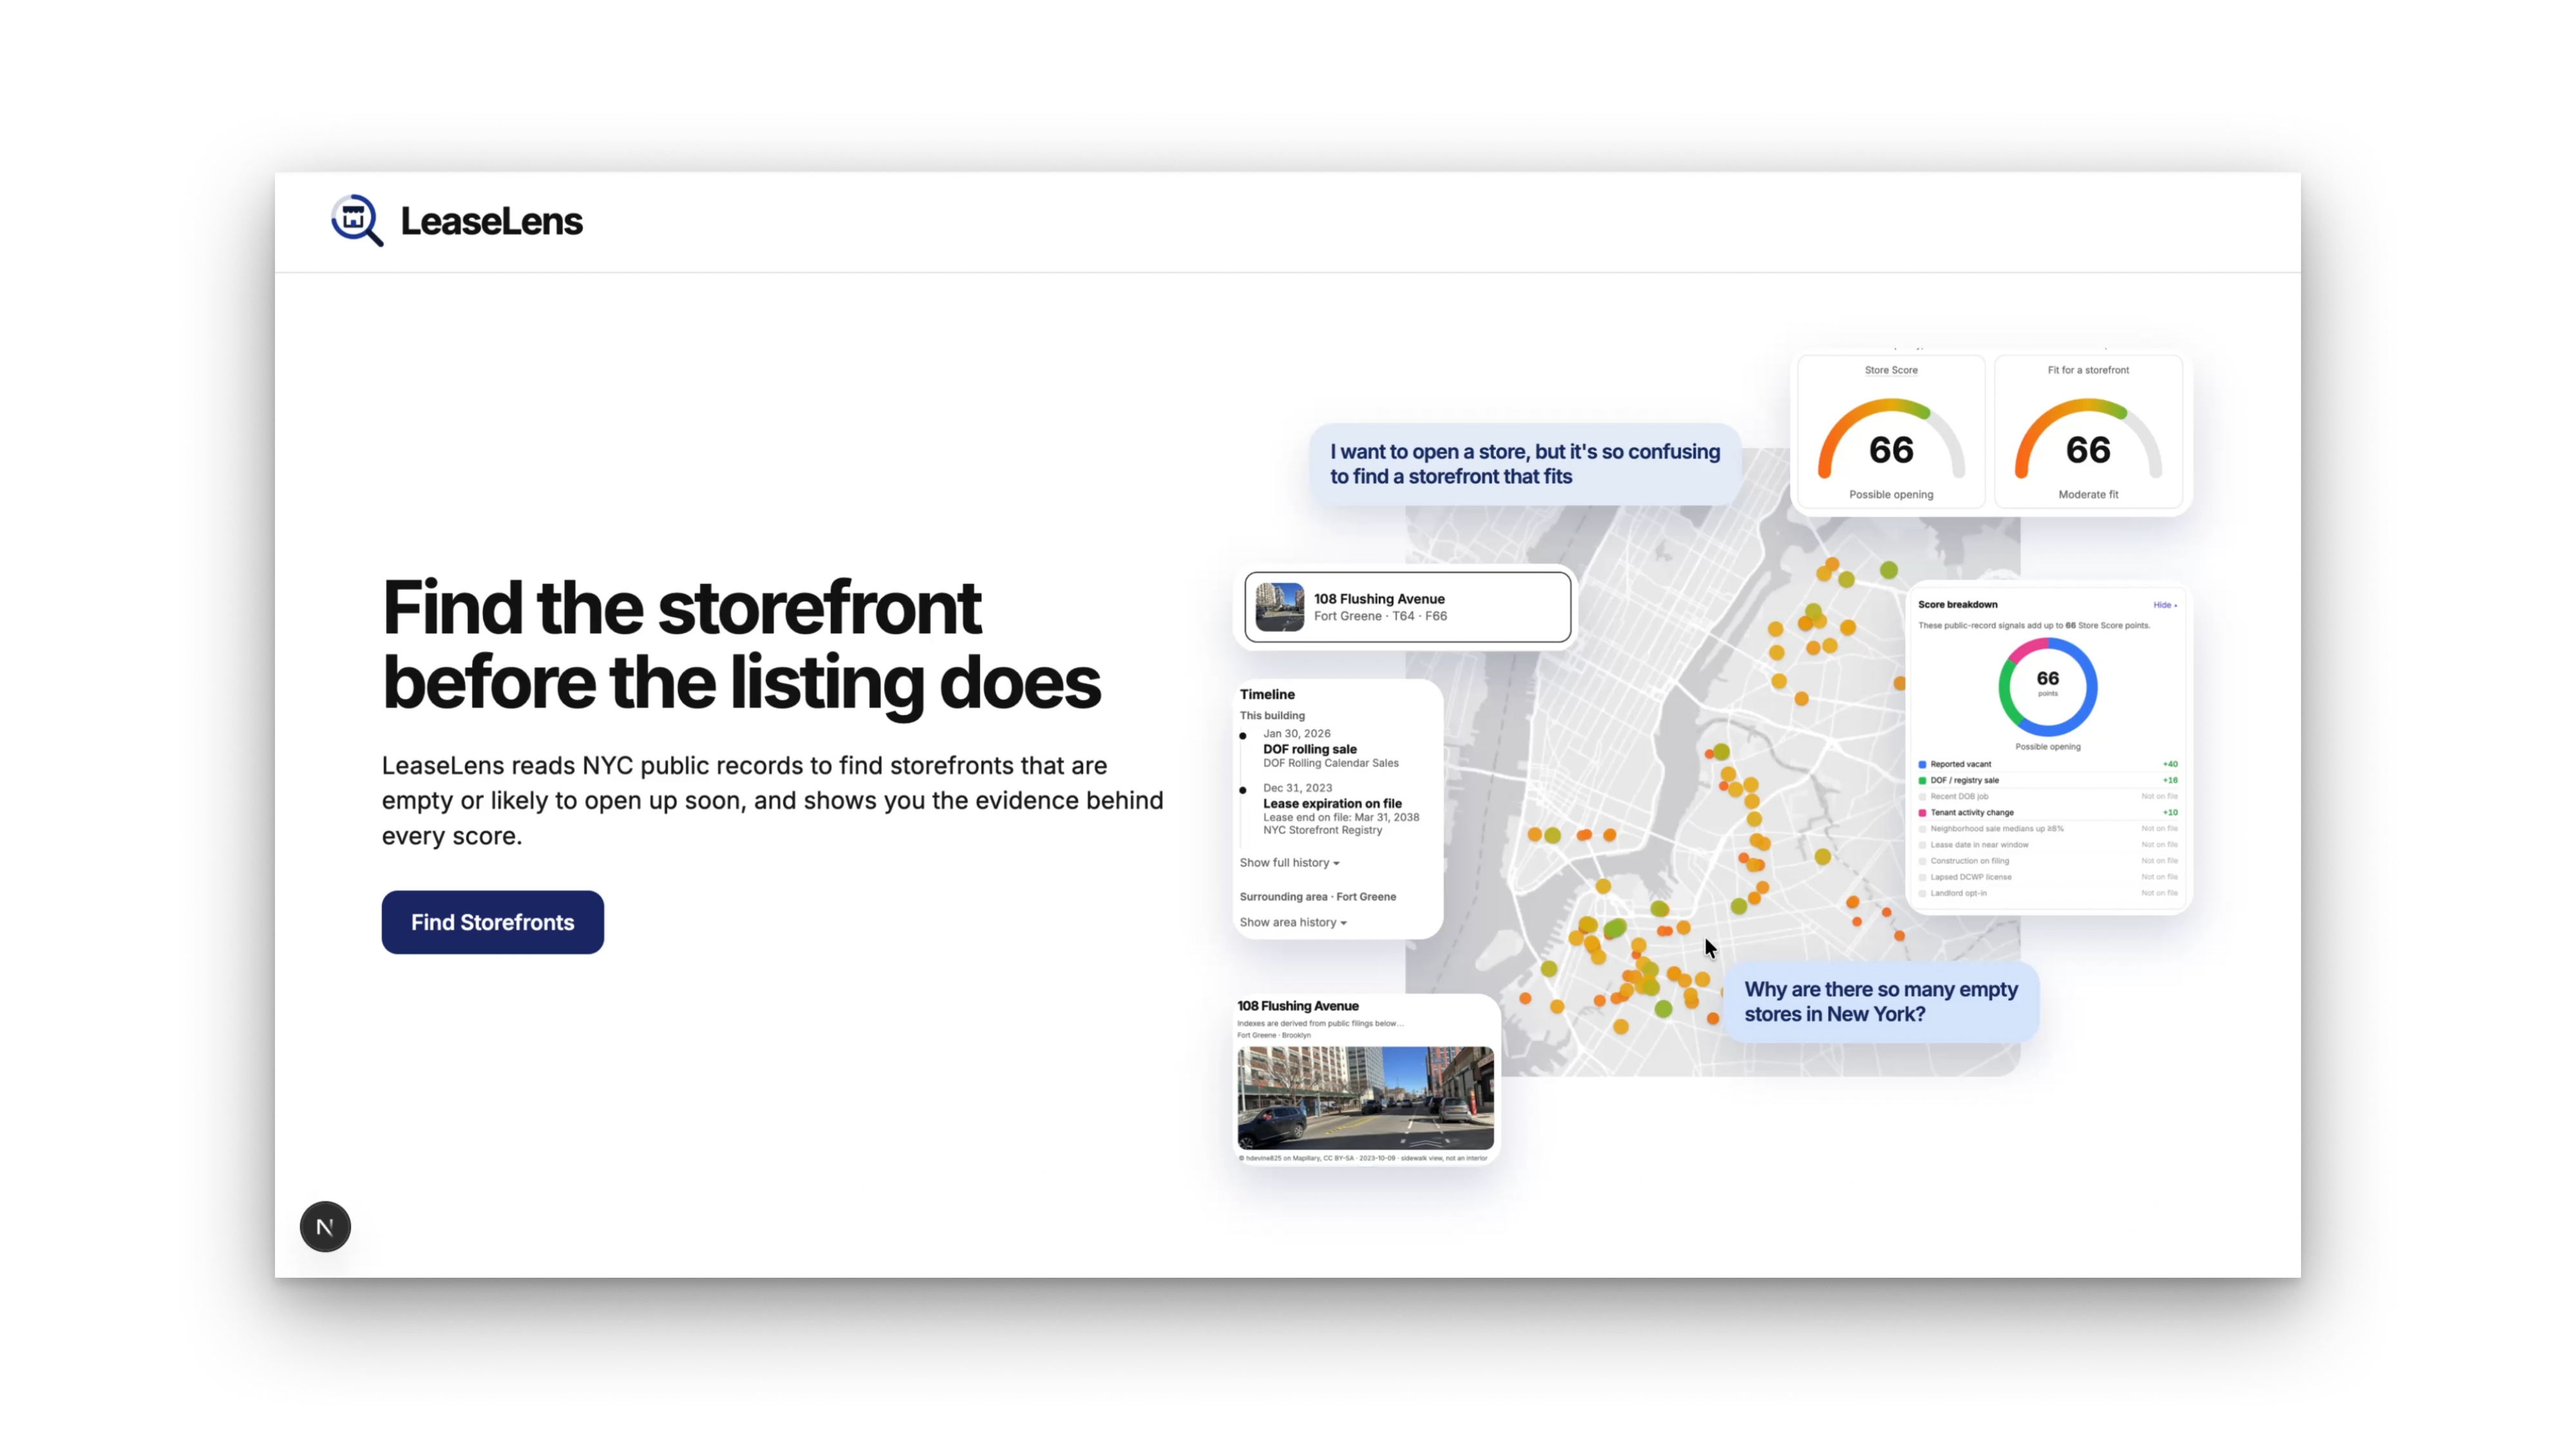
"I want to open a store, but it's so confusing to find a storefront that fits me." But at the same time: "Why are there so many empty stores in New York?"
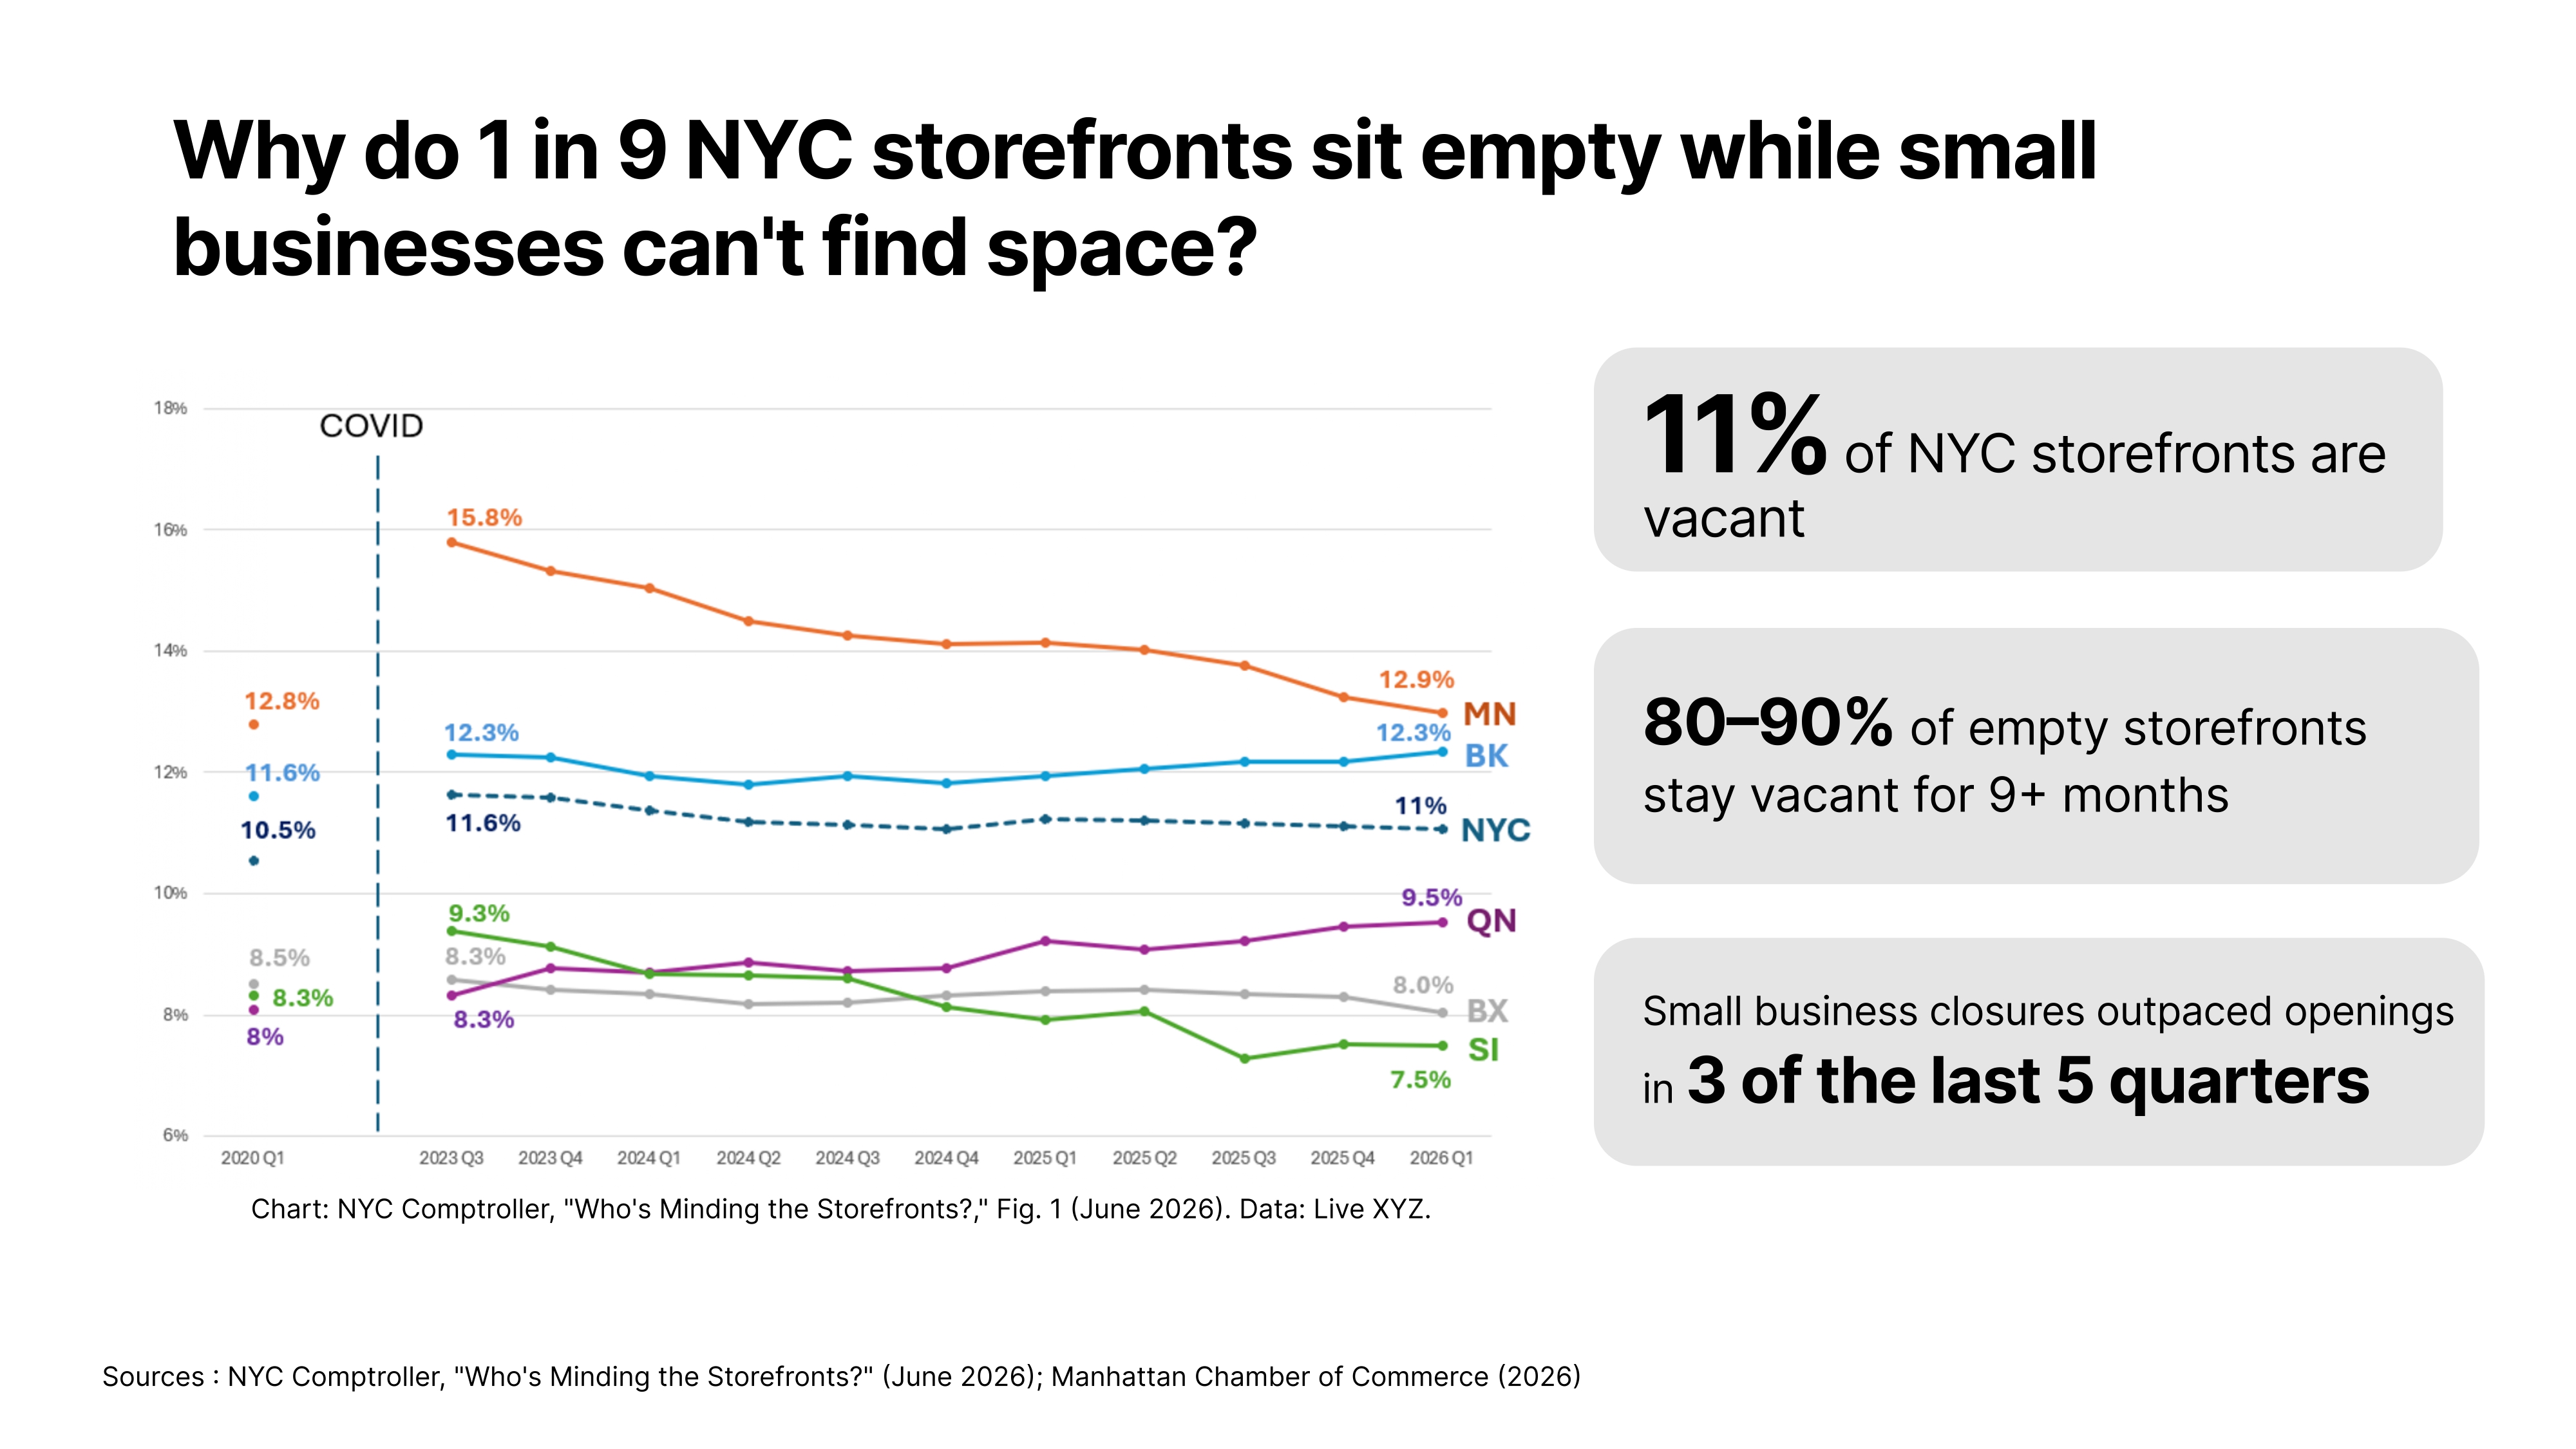
Our inspiration started from these gaps, which we realized are the same problem from opposite ends. Future small business owners can't find spaces because listings are scattered; it's hard to know what the perfect fit is, and when they do find a strategic space, someone else has already claimed it. Meanwhile, about 11% of NYC storefronts are vacant, and 80–90% of them stay empty for nine months or more (NYC Comptroller, Who's Minding the Storefronts?, June 2026). This creates a problem, as more small businesses closed than opened in 3 of the last 5 quarters (Manhattan Chamber of Commerce, 2026).
It clicked when we learned why so many stores are dark in New York: landlords report vacancies to the city, and sales, permits and license changes are all public. It's just buried across different agencies.
So, we built "LeaseLens," a data visualization and search app, to pull those signals together into one clear store score. We want to help business owners find storefronts that are likely to open up, and see why they're a perfect fit, before they're gone. At the same time, we hope to help New York's economy and make your neighborhoods more lively!
🔍 What it does
Our website first collects the criteria or requirements small businesses want for their store, which can also be changed by editing the filters.
Then it returns 3 different results:
- a list of potential stores,
- a map of these stores, and
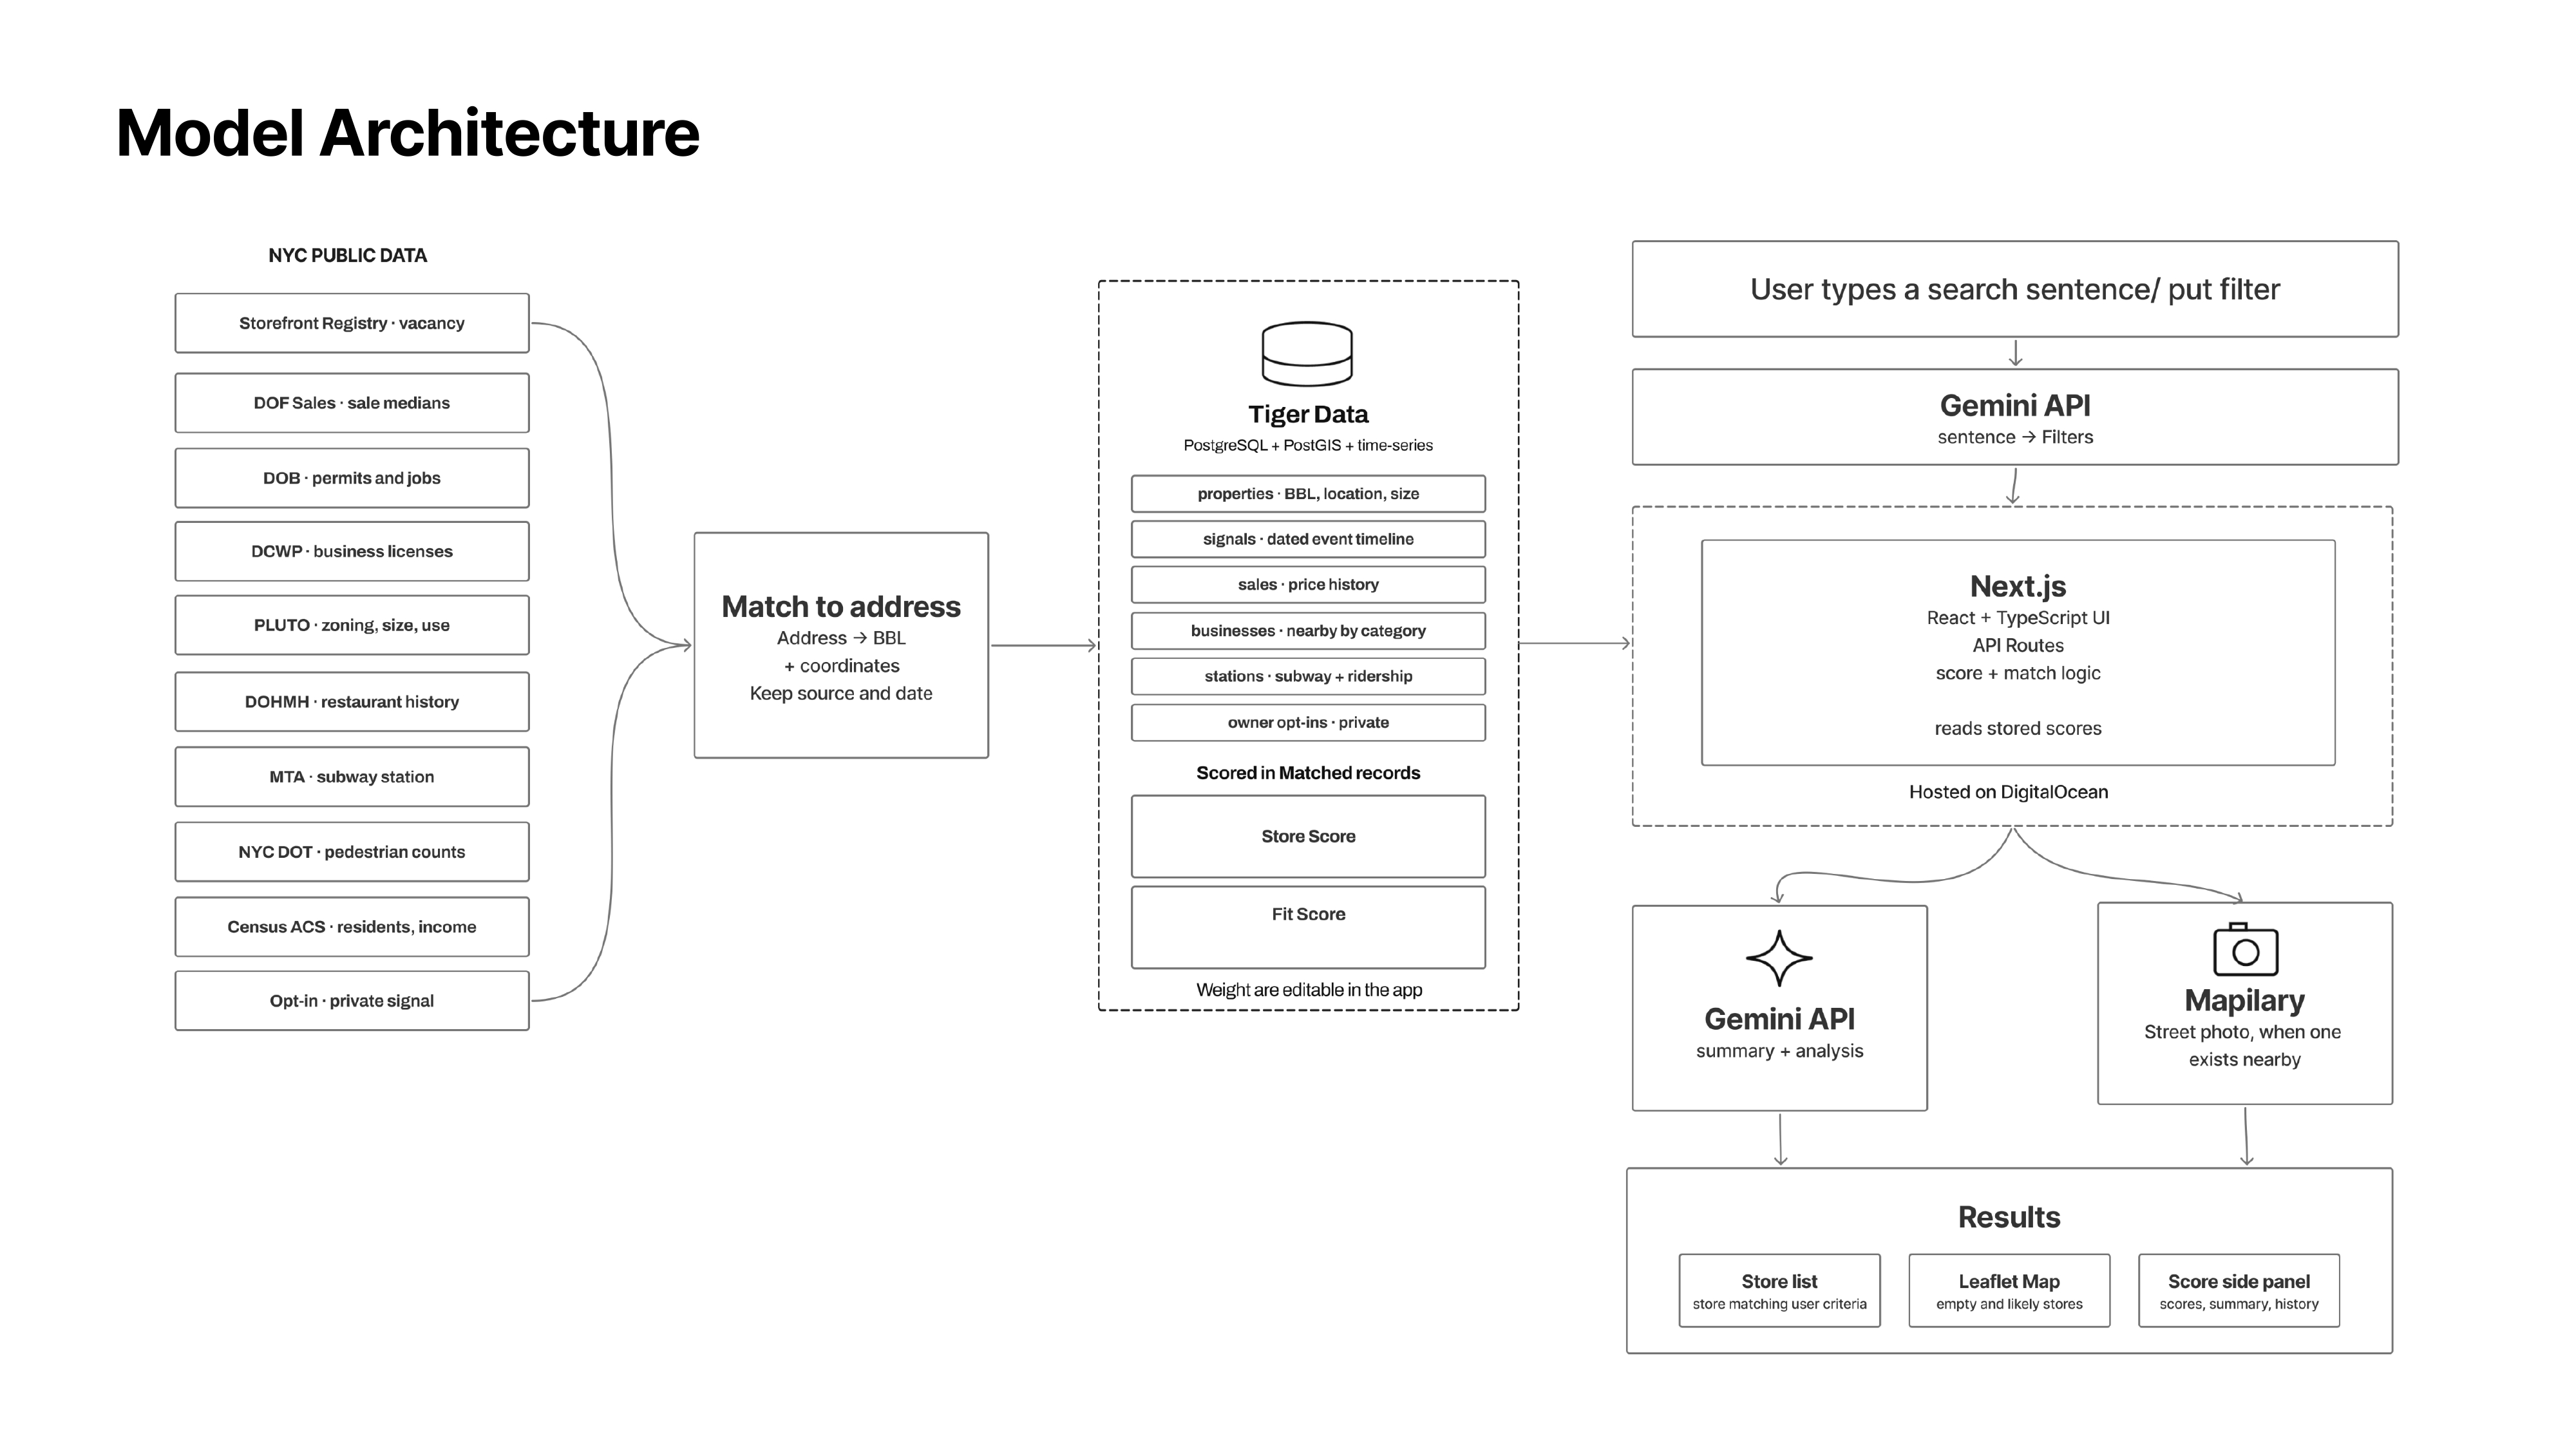
- a score side panel, calculated with specific metrics and backed up by different data.
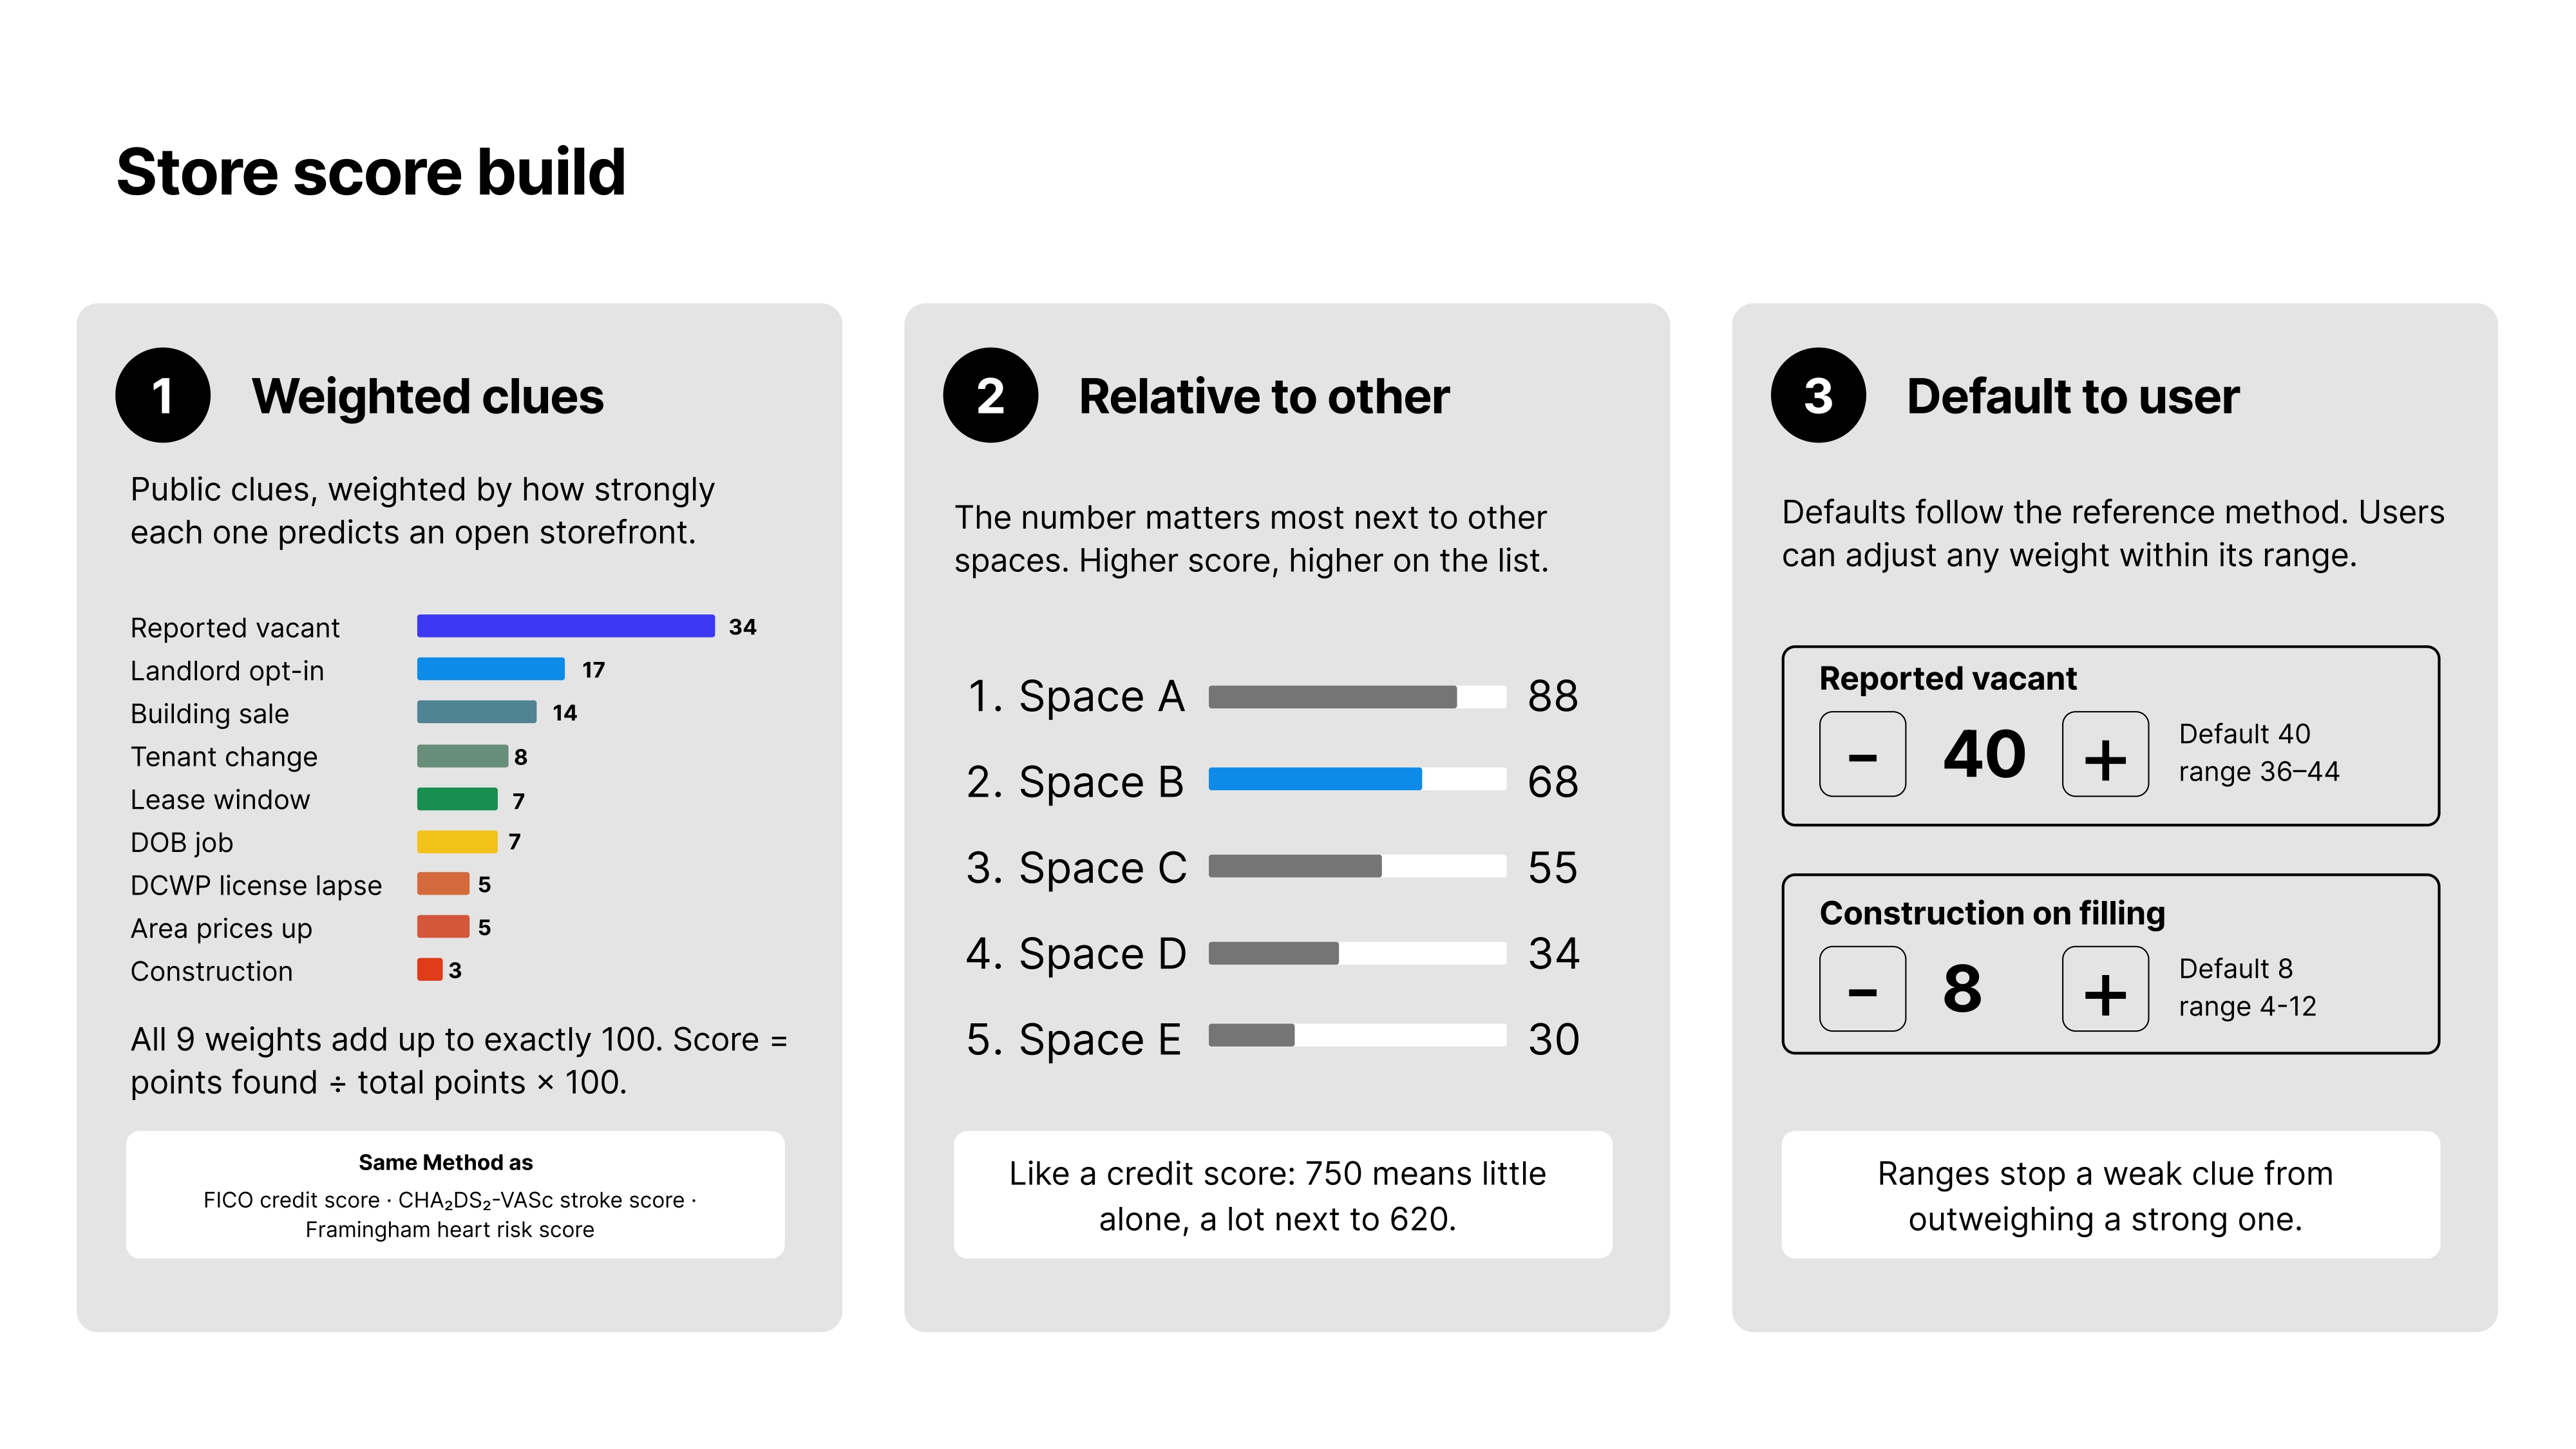
The main health score is "Store Score," which measures how many signs of change are already on file. Each storefront gets a Store Score from nine public-record signals: reported vacancy, a lease date in the window, a sale, construction, a recent building permit, a lapsed license, a change in tenant activity, rising nearby sale prices, or a landlord who opted in. Each signal is then weighted by research-based defaults, like a FICO-style scorecard.
The other health score is "Fit," which comes from how well the storefront's filed use and location match what the user asked for, using storefront activity, subway distance, building class, retail area and zoning.
Other features in the results include an AI summary, store history, customizable index weights and more detailed information about the area.
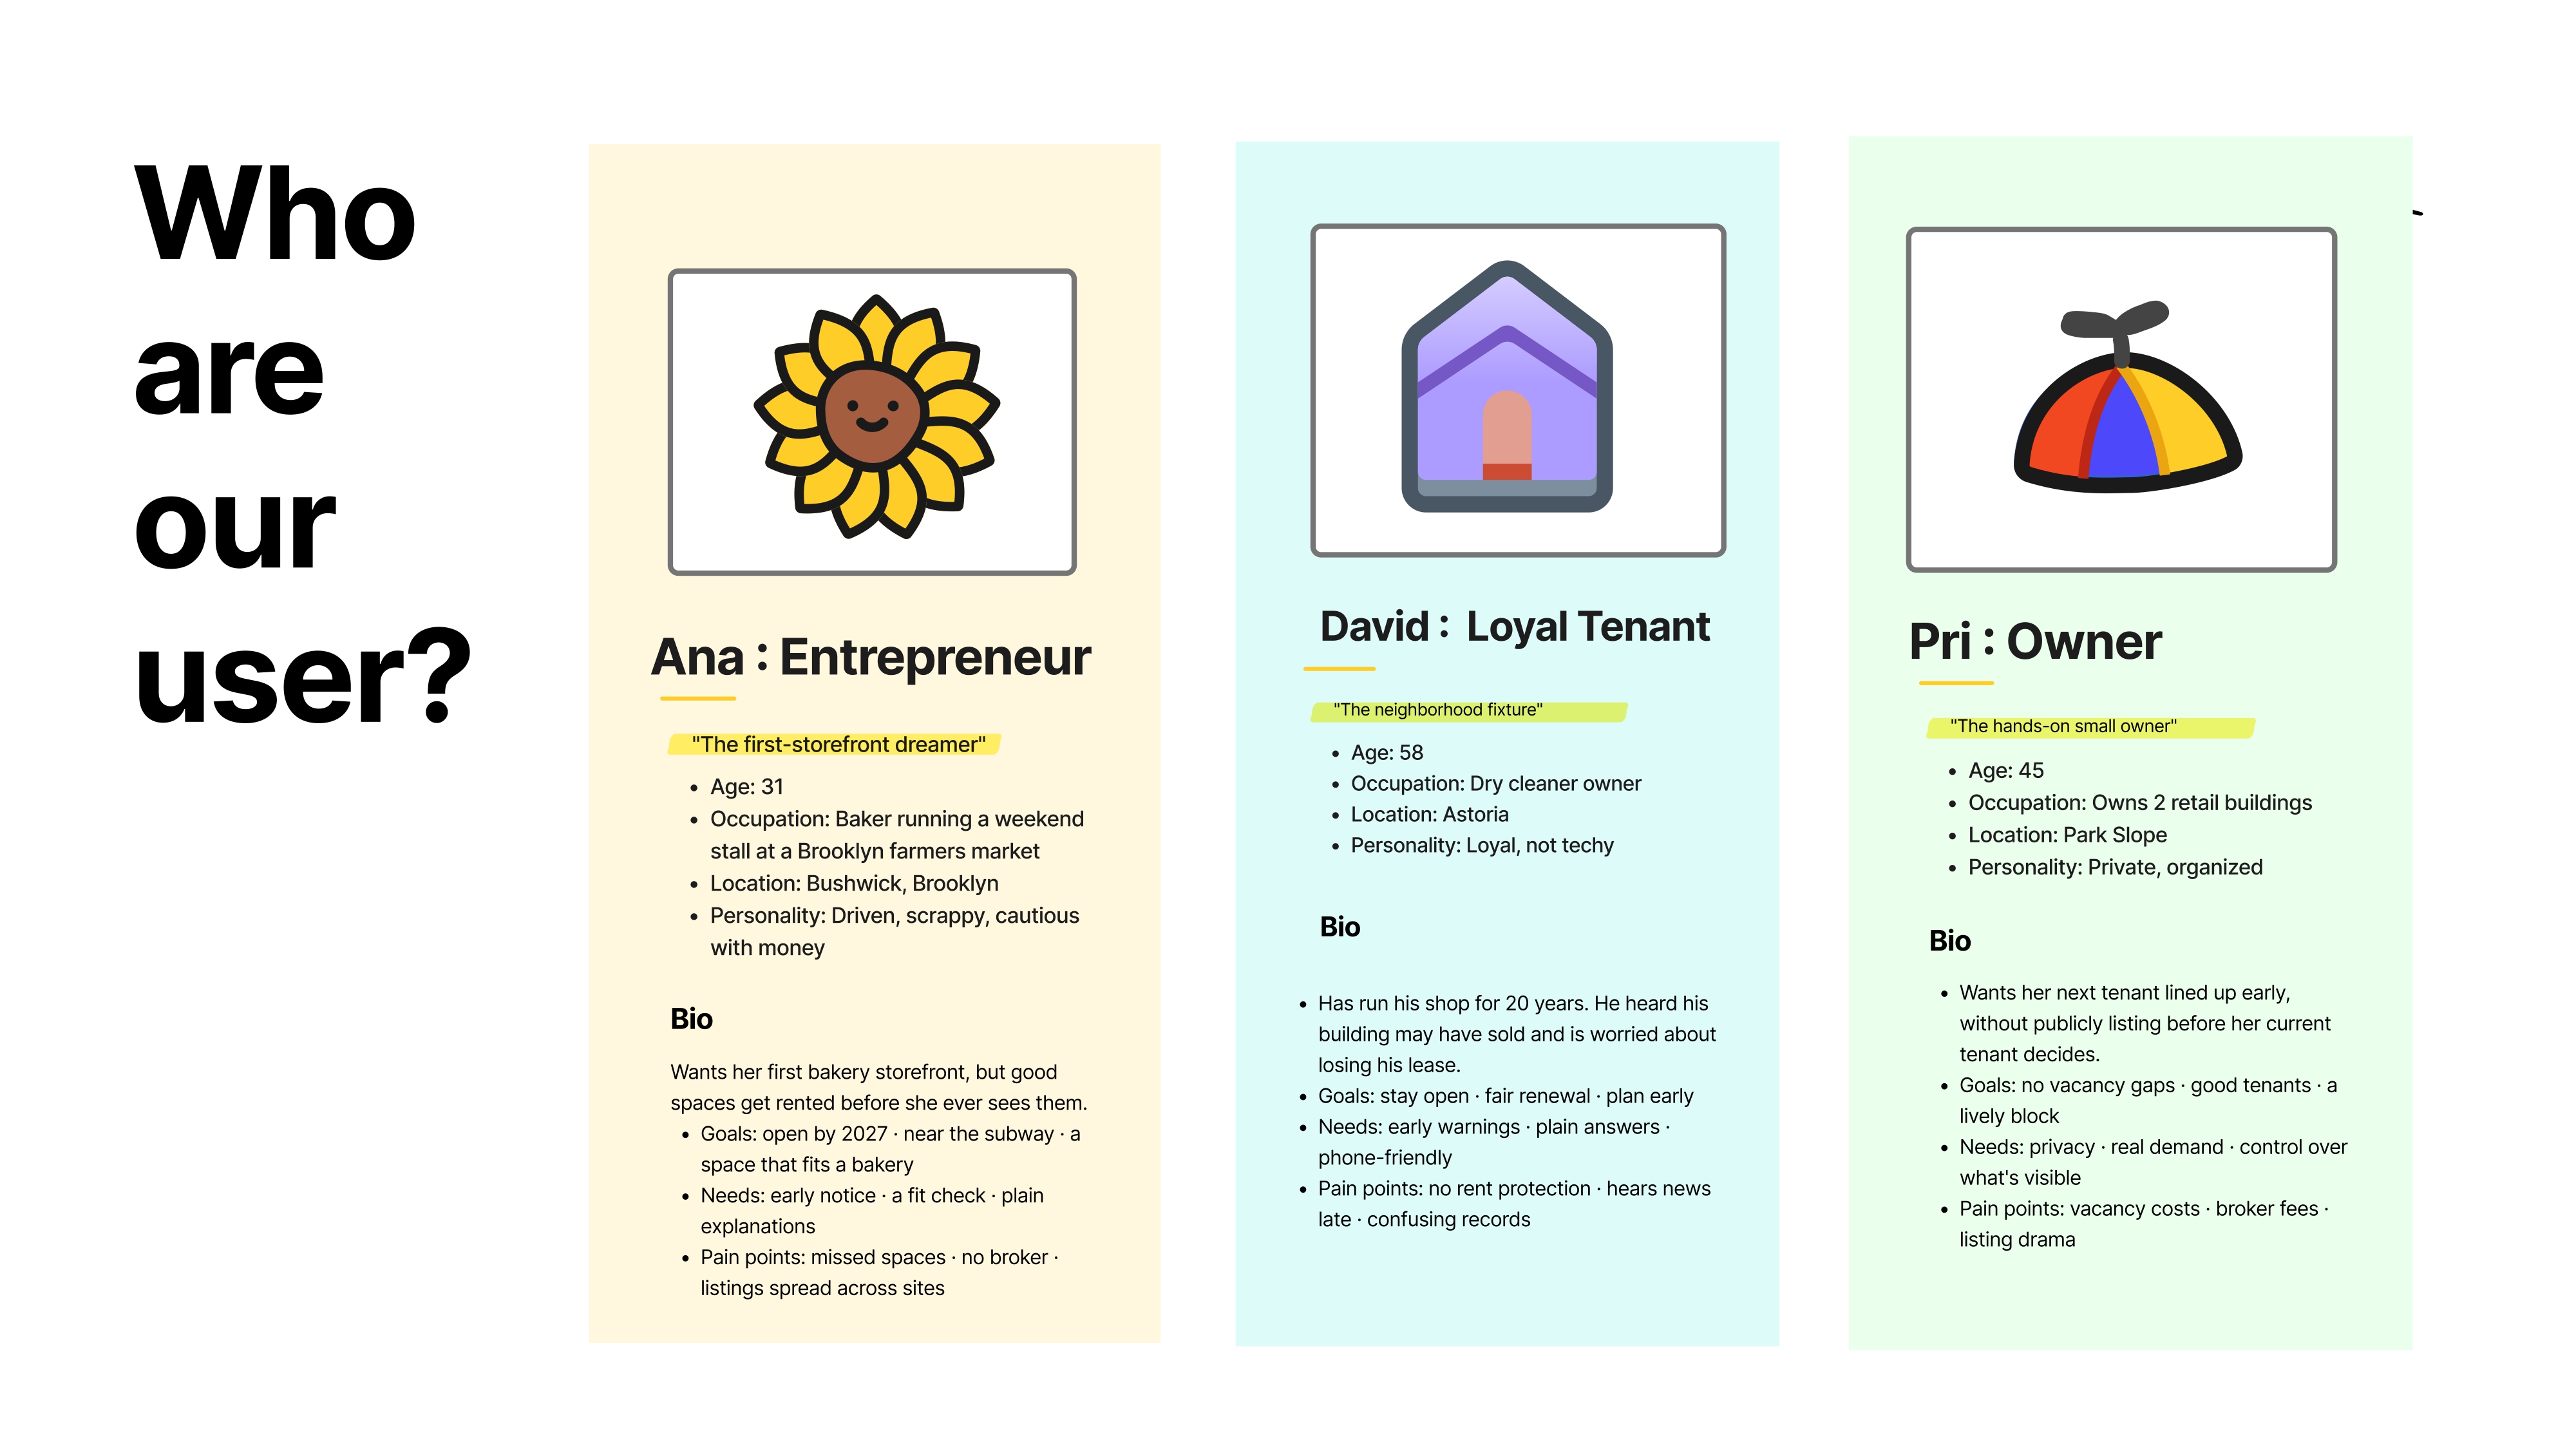
By using "LeaseLens," small businesses can plan ahead and spot spaces before they're gone, landlords can benefit from an early-availability signal, and the neighborhood can thrive without dark stores anymore.
🛠️ How we built it
We built LeaseLens as a Next.js app on a PostGIS and TimescaleDB database of NYC public records, with storefronts shown on a Leaflet map. Our backend calculates each storefront's Store Score and Fit score by matching its public records on the tax lot (BBL), then adding up the weighted signals it finds. We use Gemini to turn a search sentence into filters and to summarize and analyze the records we've pulled. When a street photo exists nearby, we pull it from Mapillary.
🧗 Challenges we ran into
A large challenge we ran into was pulling together different data and tools, like APIs, image sourcing, maps and data, and connecting them to work together. We worked in iterations, and with each iteration we tried to complete the product by adding features. However, with every iteration, something from the previous iteration broke, and we needed to figure out how everything connected. For example, the OpenStreetMap data kept becoming undefined and disconnecting from the API, so we changed map tile providers. We found it really stressful, but we learned which tools and data complement and connect with each other.
Other than that, we ran into a challenge in deciding the scoring system for the Store Score. There's hardly any precedent for this concept, and we needed to do research to decide the default weights for the scoring breakdown.
🏆 Accomplishments that we're proud of
Finishing on time was an accomplishment in itself, and we even had time left to polish the user interface and add details after testing it with a few people. We're really proud of how many iterations we went through and how each one added new tools and features. We're also proud of figuring out a good way to orchestrate all the data.
📚 What we learned
Other than learning that we shouldn't overthink and should just start iterating, we learned a lot about building user journeys and experiences. We discussed a lot about how to orchestrate data and how it should be presented in a way that's helpful, easy for first-time users and makes sense instead of being overwhelming. Technically, we also learned about many different tools, especially PostgreSQL, PostGIS, TimescaleDB, and bringing AI in to help explain the product.
Teamwork was also something we figured out along the way, since we had just met each other and our ideating took longer than others. We all come from different majors and cities, so we had to be deliberate about communication, but our teamwork was fantastic, and we learned how to cut scope and build lean products fast.
🚀 What's next for LeaseLens
We are thinking about adding a login feature where store owners can register their storefronts, so they can signal whether they are looking for a future tenant. We also want to add a chat box that connects businesses and store owners and makes the website actionable.
Built With
- .tech
- figma
- gemini-api
- github
- leaflet.js
- mapillary
- next.js
- node.js
- postgis
- postgresql
- react
- timescaledb
- typescript


Log in or sign up for Devpost to join the conversation.