-
-
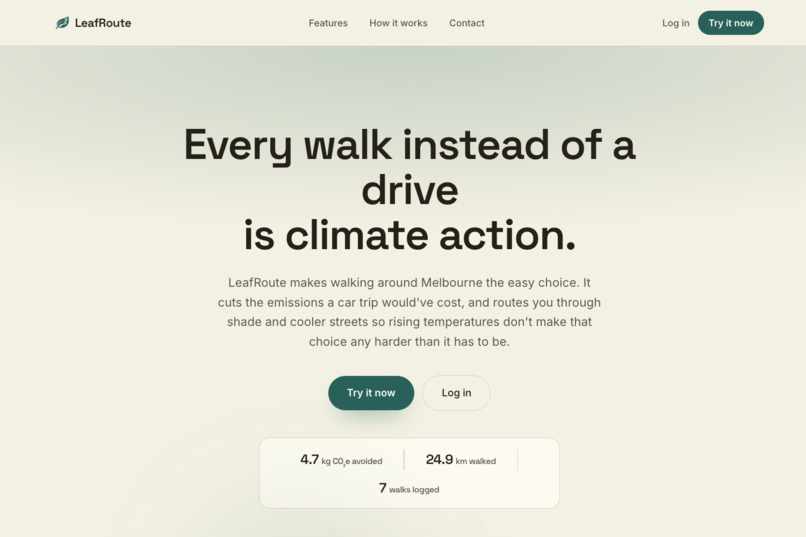
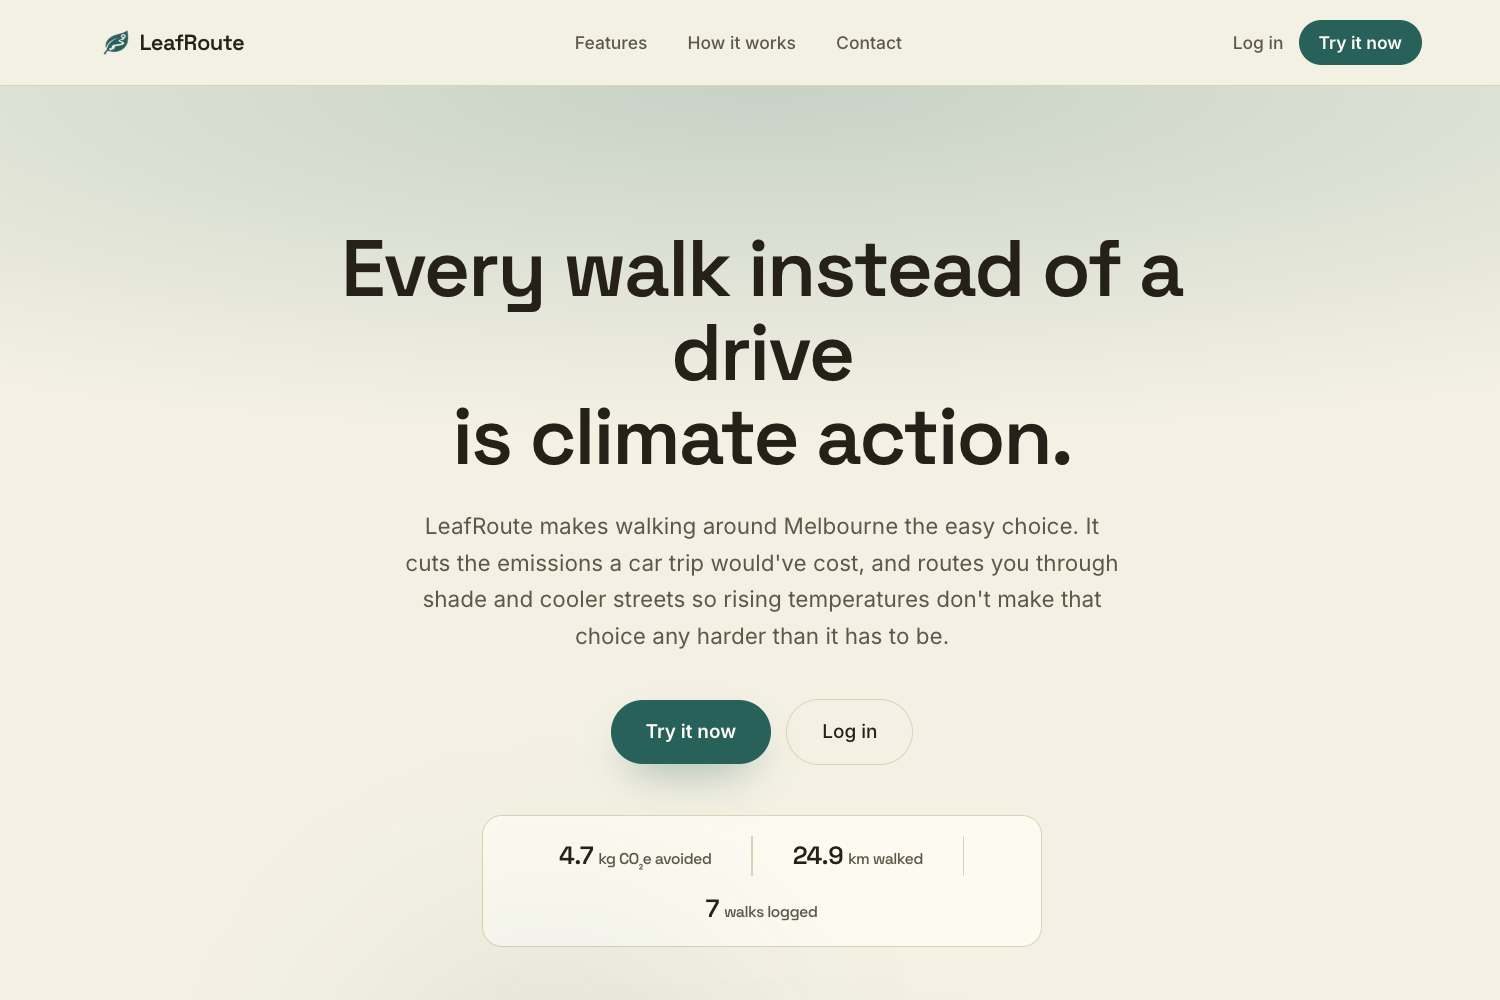
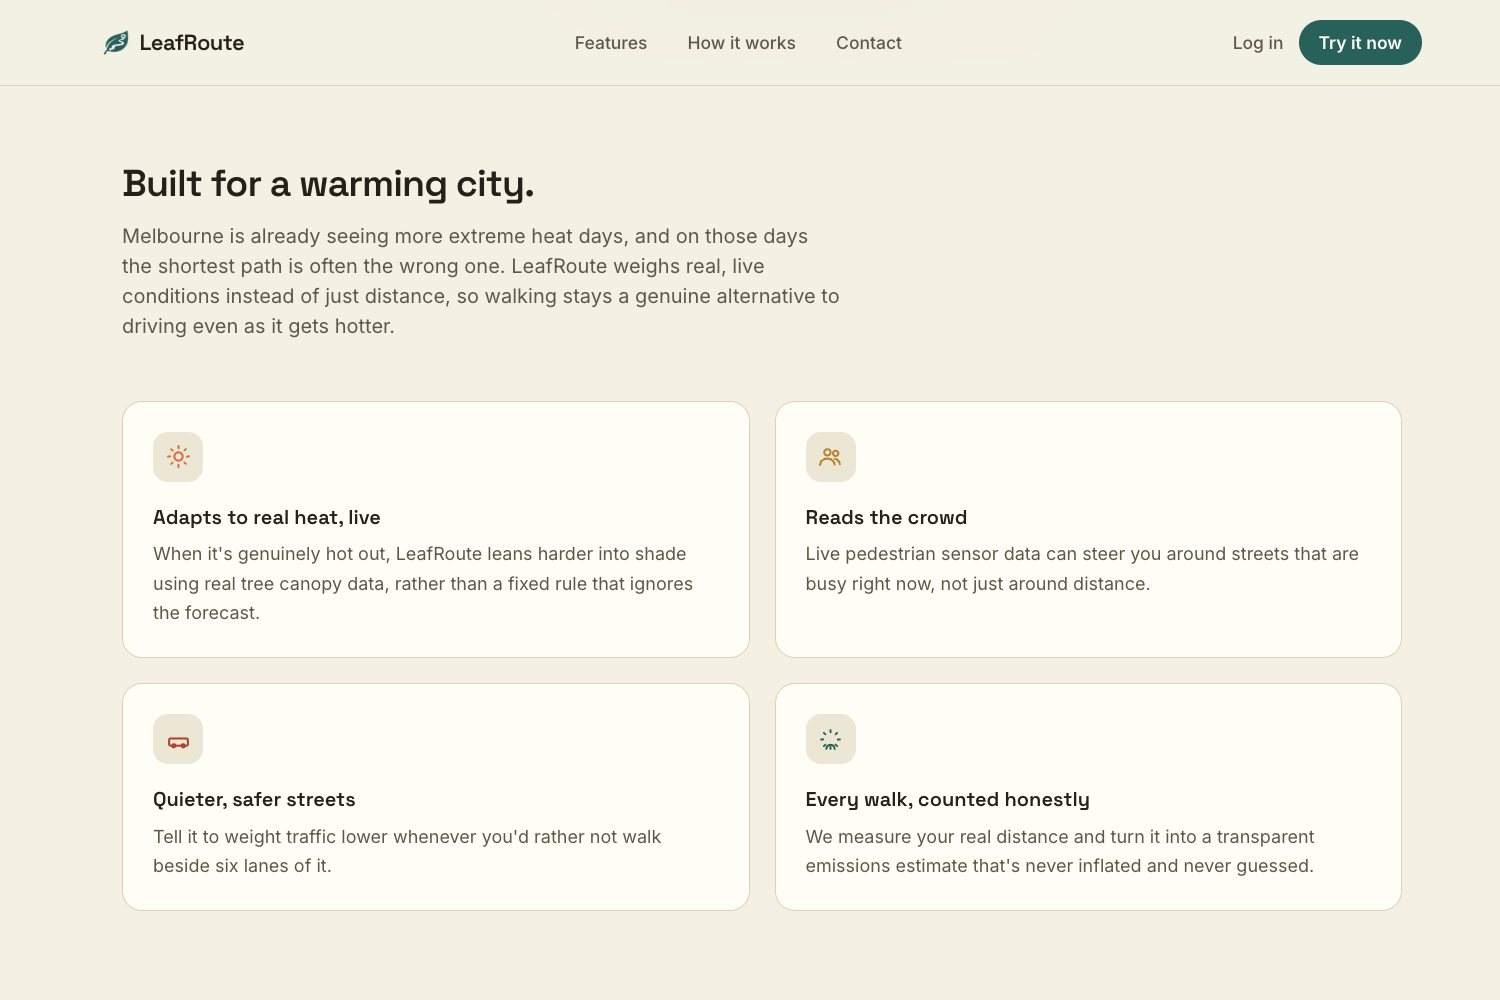
Landing page with live total CO2 Emmisions saved tracker
-
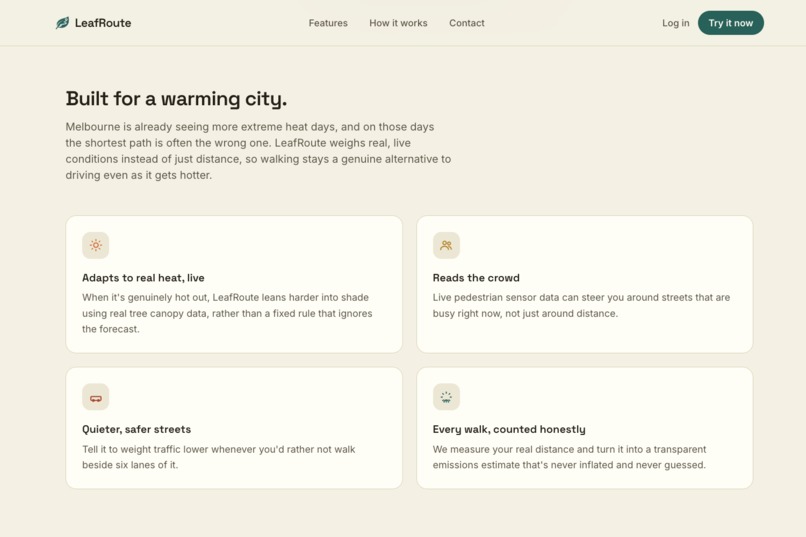
Leafroute features page
-
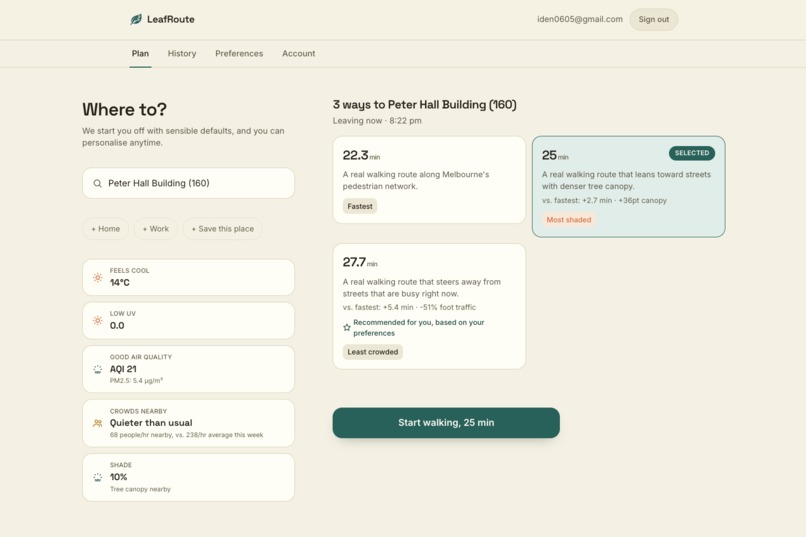
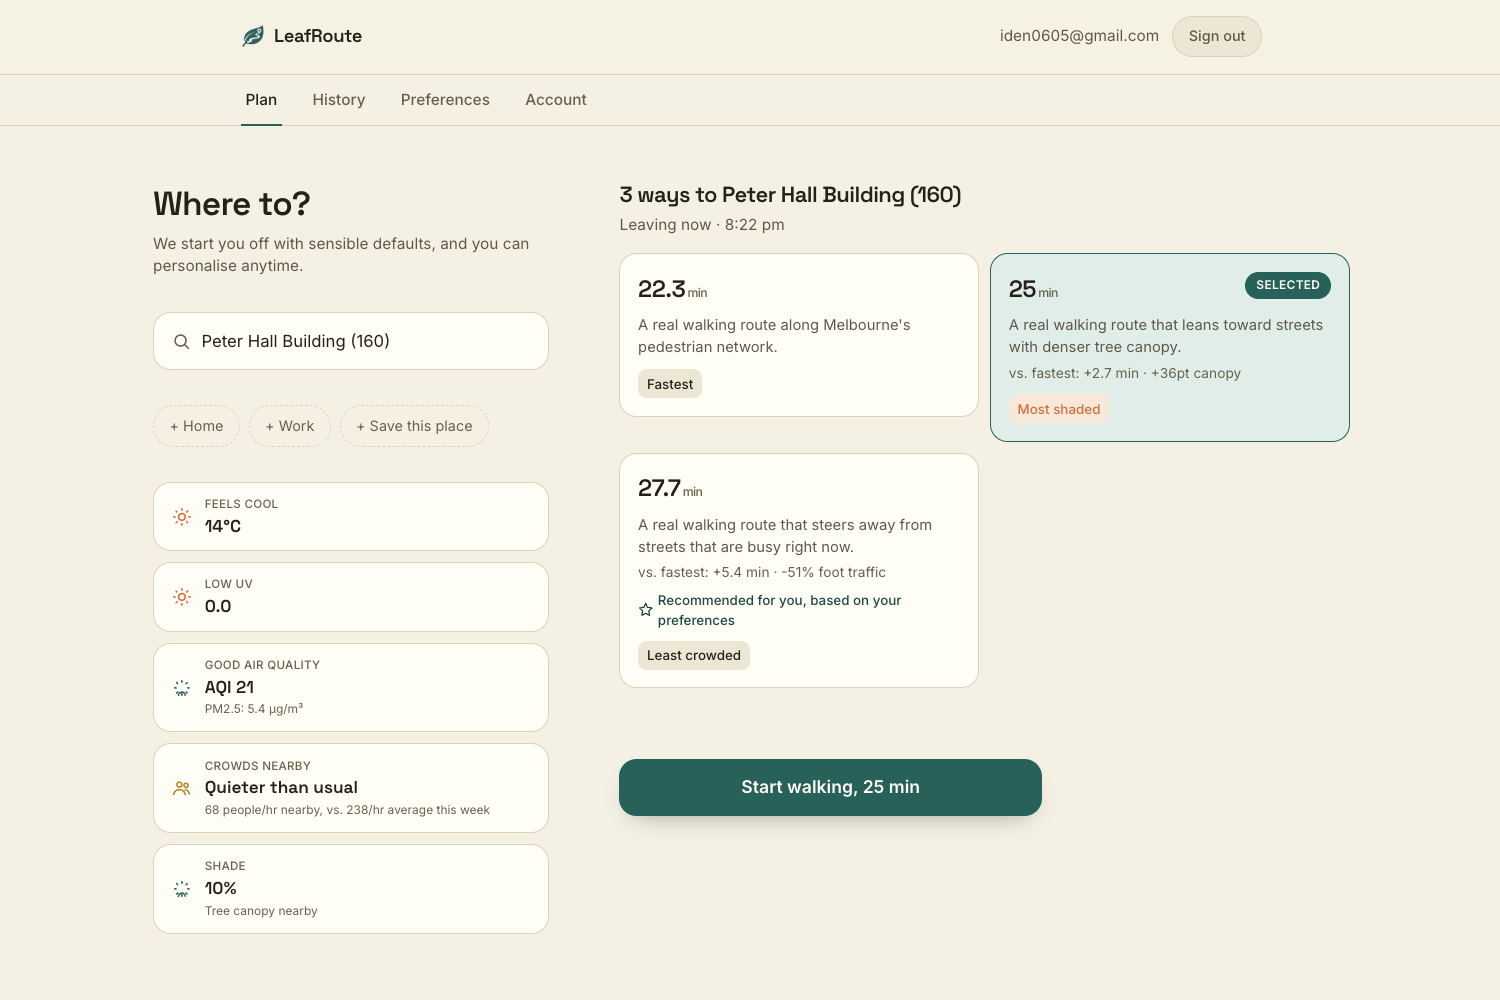
Route options and tags
-
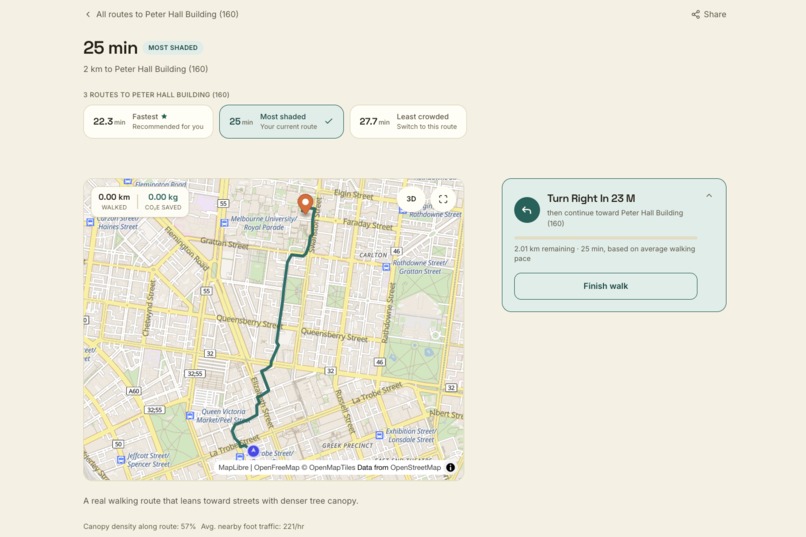
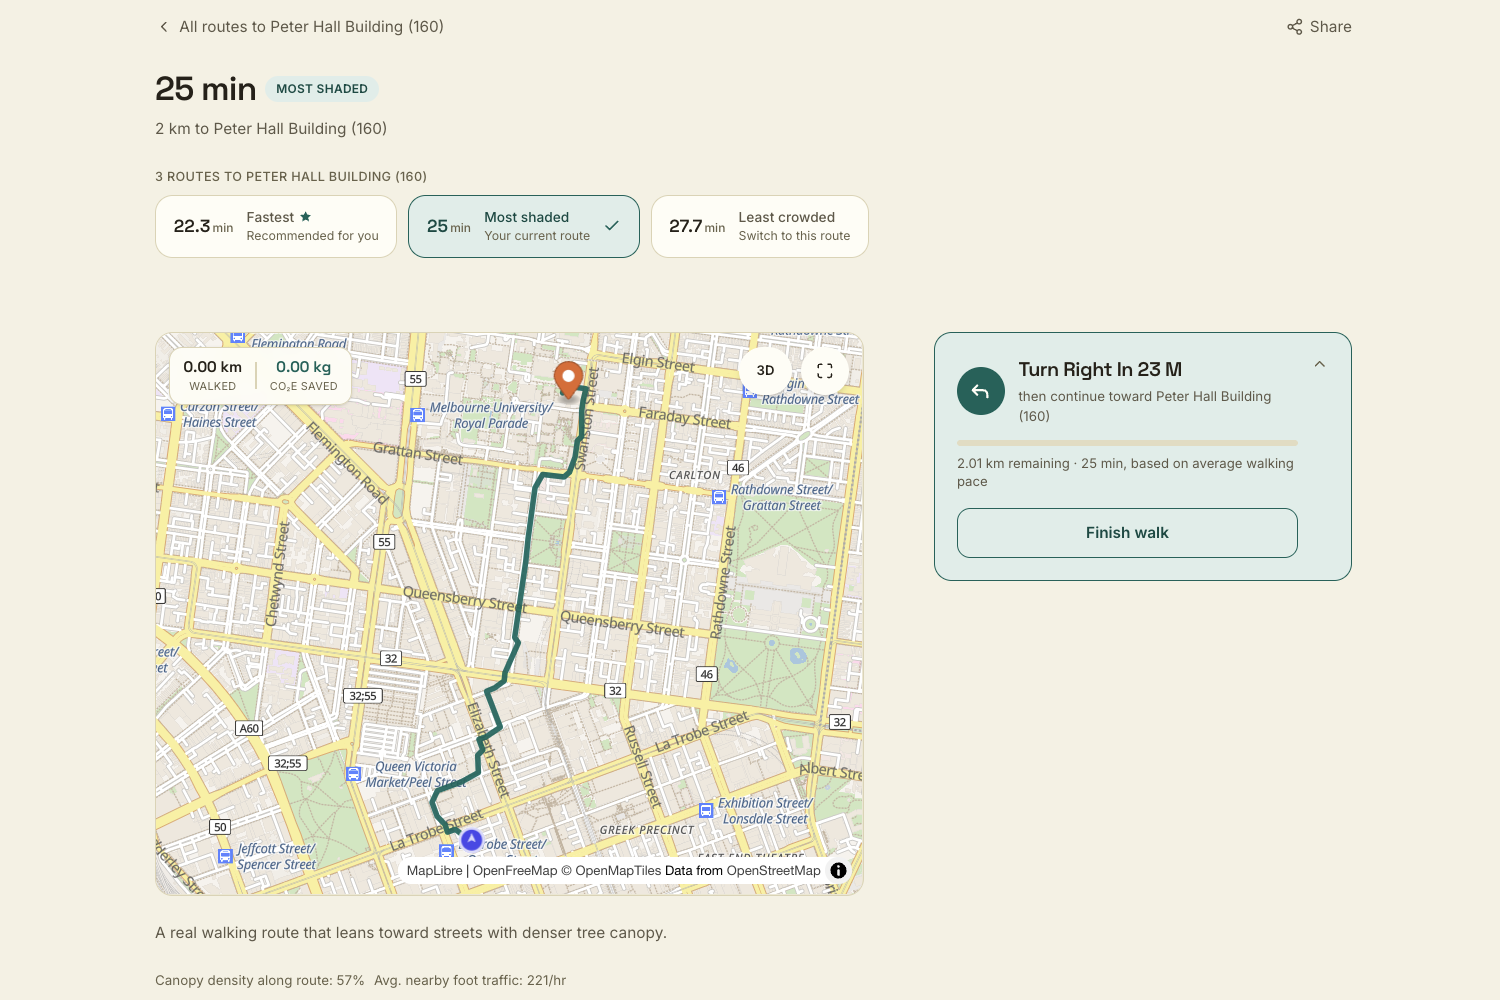
Route map page
-
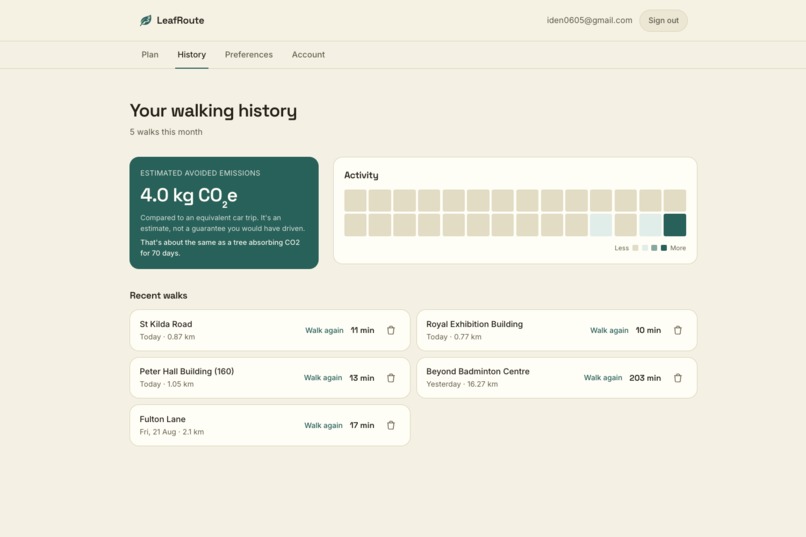
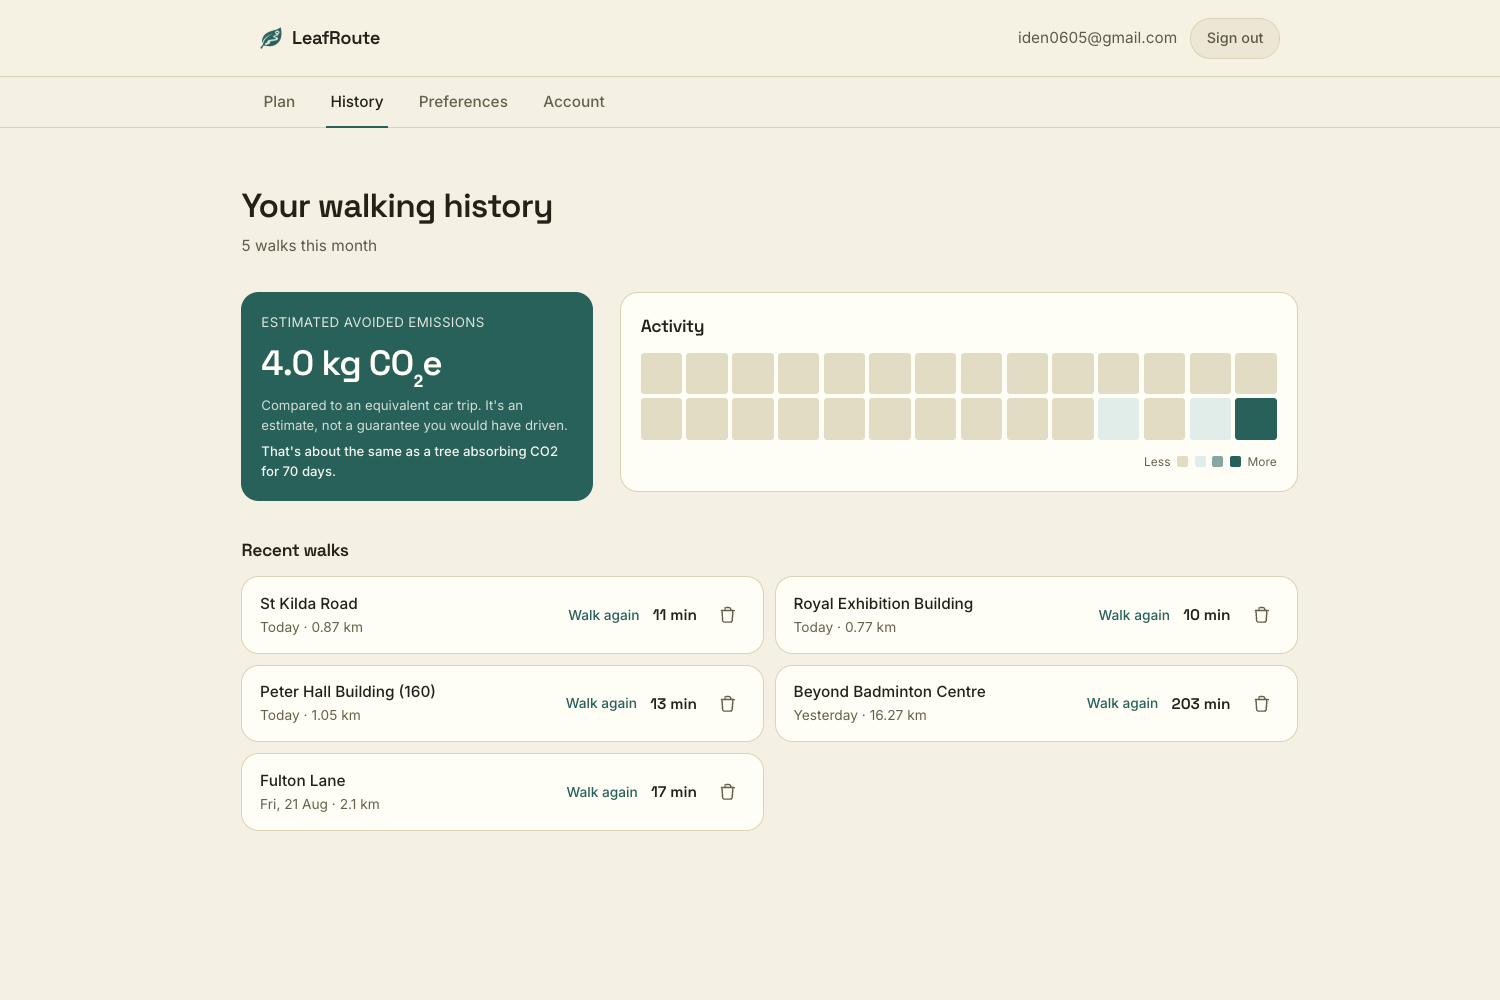
Application history page with Github-like CO2 Emmisions saved history
-
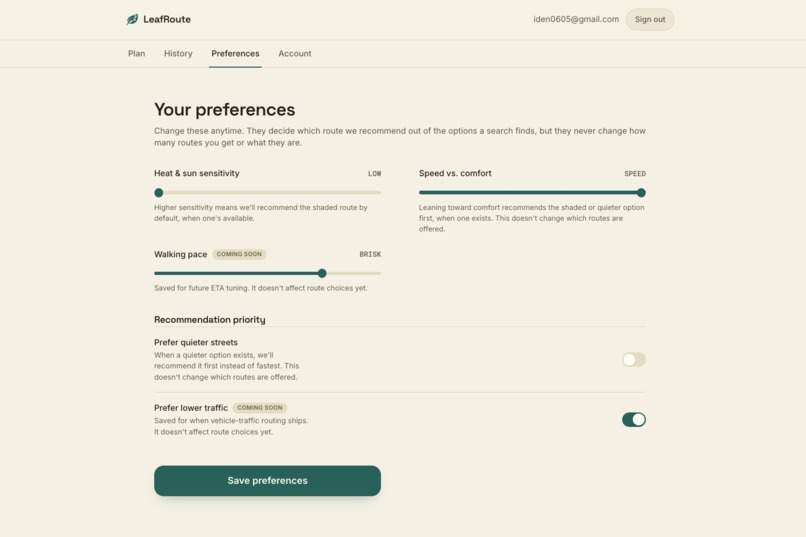
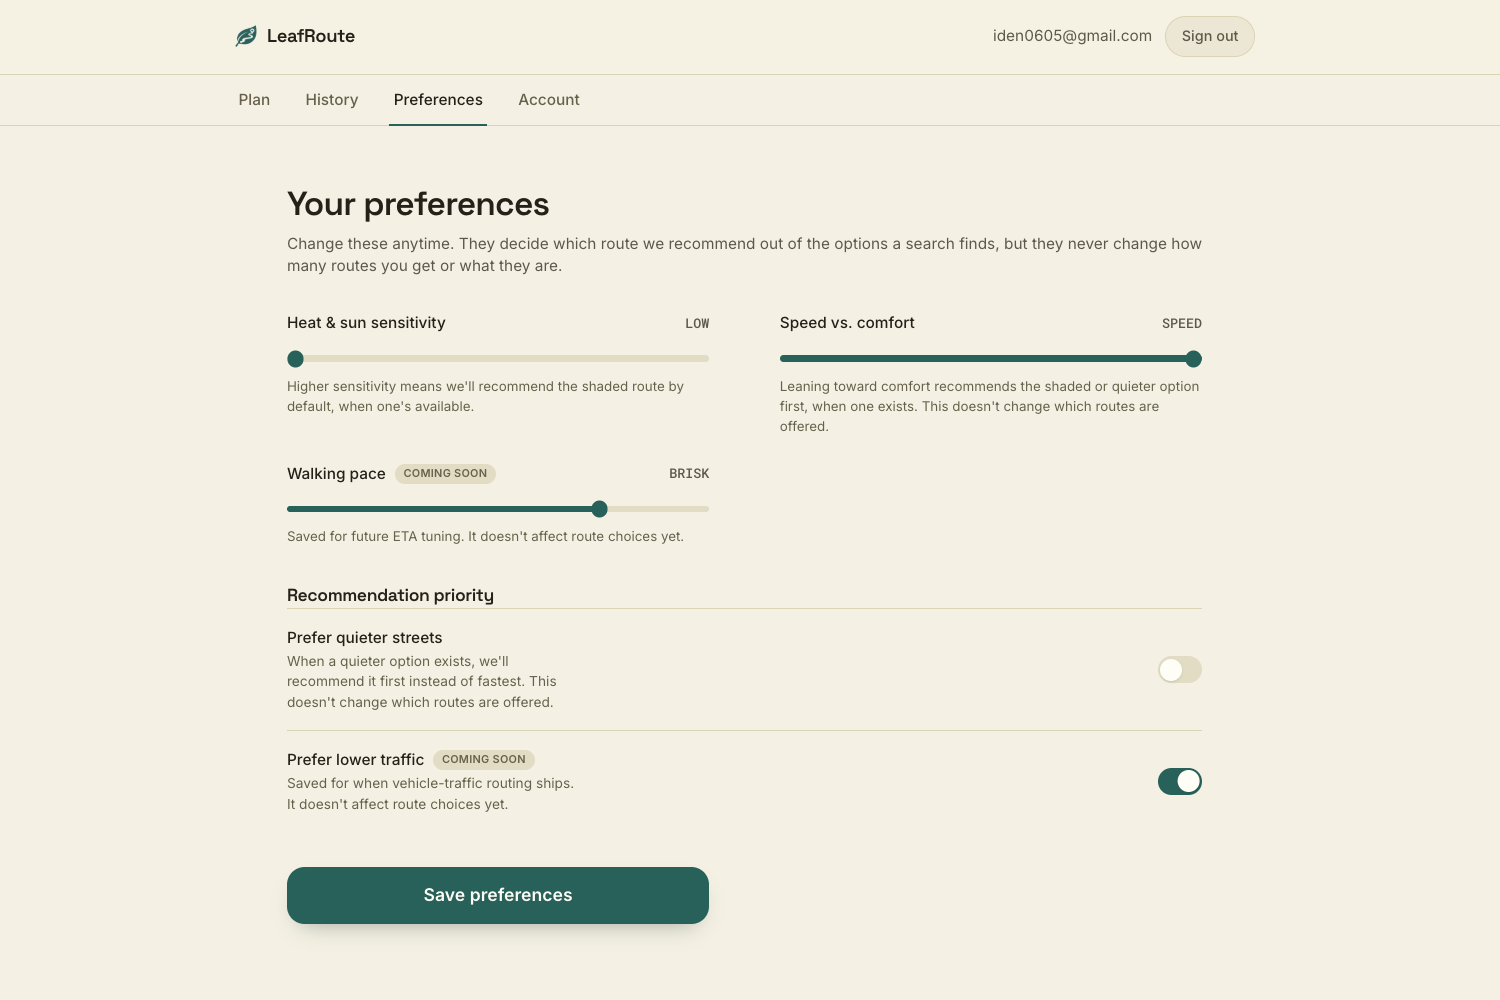
Preferences page
-
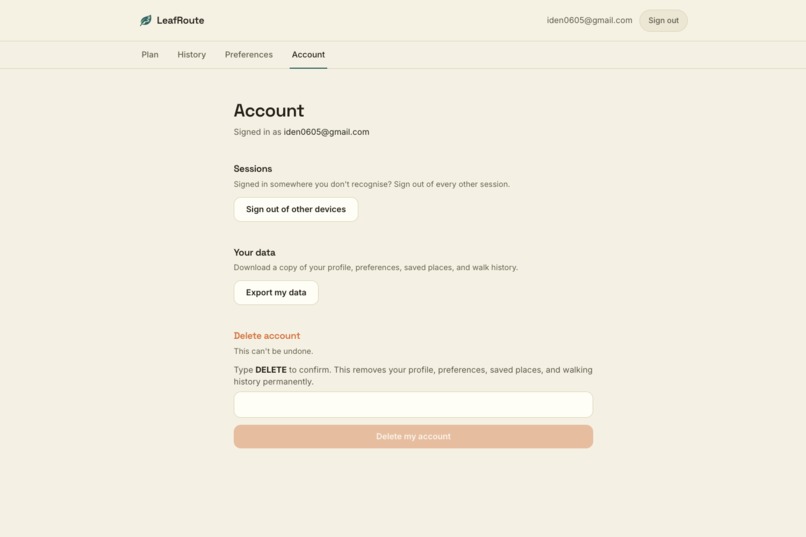
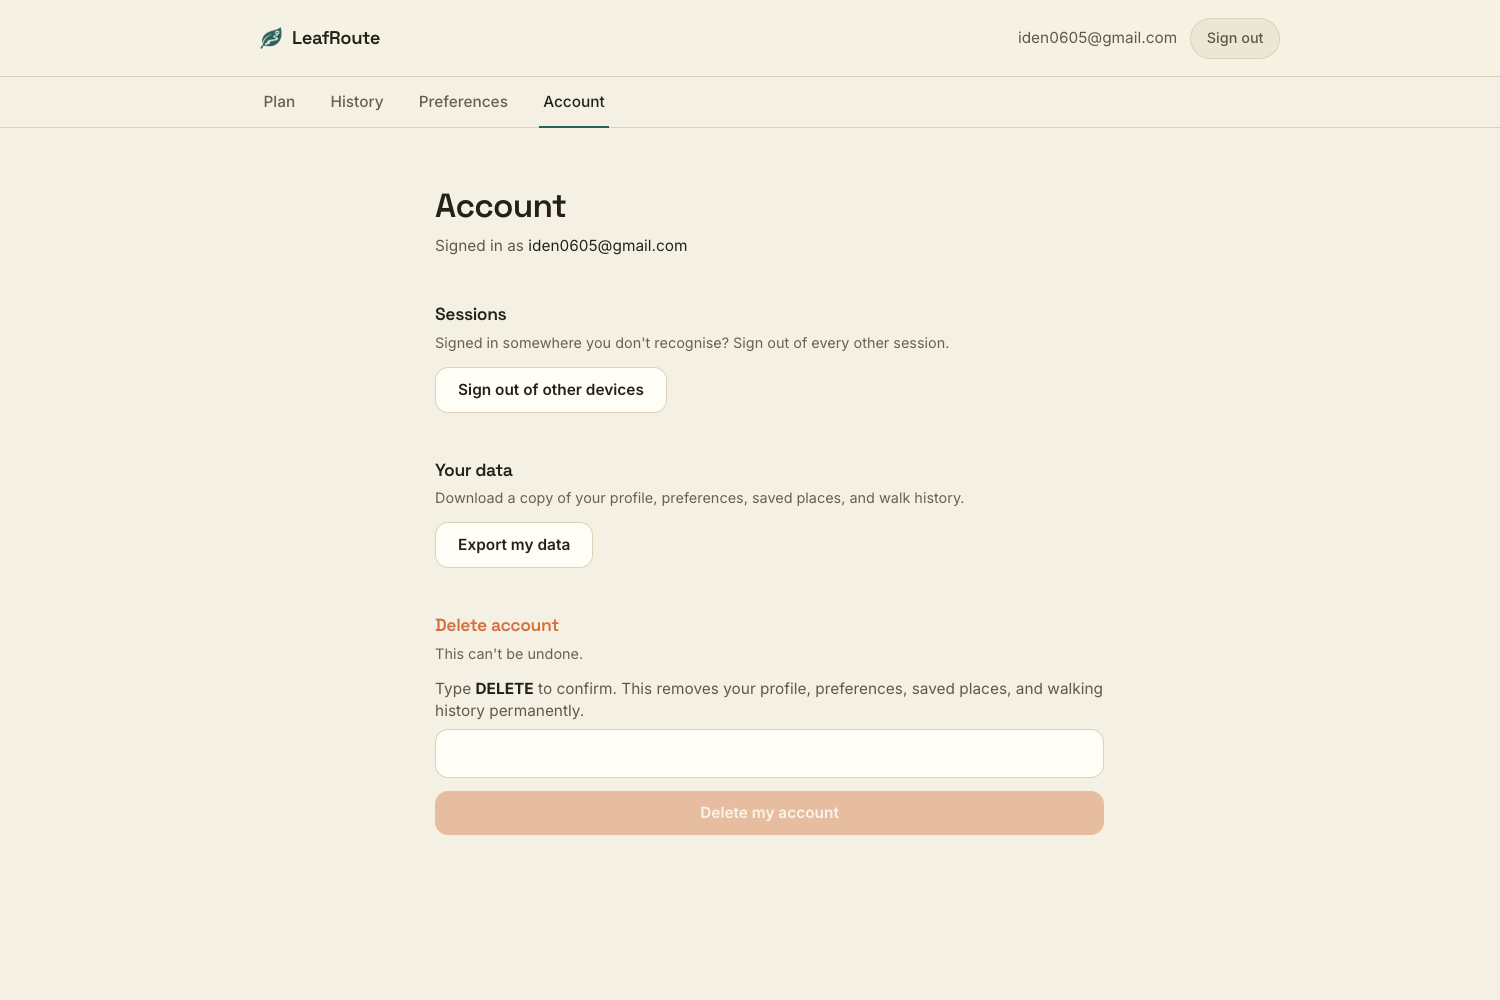
Application account page
LeafRoute
LeafRoute is a Melbourne walking route planner built around climate action. It cuts emissions by making walking the easy choice instead of driving, and it helps people cope with the heat, sun, and air quality that are already here by routing them through shade and cooler streets in real time, using live public data .
What it does
- Plans real walking routes over Melbourne's pedestrian network, with up to three different options: fastest, shadiest, and quietest, each backed by real differences in tree canopy or live foot traffic.
- Shows live conditions for any destination: temperature, UV index, air quality, nearby foot traffic, and tree canopy, pulled from public data sources at request time.
- Leans harder into shaded routing automatically as the temperature rises.
- Tracks distance walked and CO2e emissions avoided while a walk is in progress, and turns the total into something concrete once it's done, like a tree absorbing carbon for a day, instead of a bar figure.
- Remembers a signed in user's preferences (heat sensitivity, quieter streets, walking pace) and uses them to recommend a specific route option.
- Keeps a running public total of distance walked and emissions avoided across every walk ever logged, signed in or not, shown on the landing page.
Architecture
The frontend is a Next.js 16 app using React 19, TypeScript, and Tailwind CSS 4, deployed on Vercel. Route planning and the machine learning inference sit alongside it as Python functions under api/, also running on Vercel.
The walkable street network is a graph built by merging City of Melbourne's own pedestrian network dataset with an OpenStreetMap extract, joined with proximity based node snapping since the two datasets were digitised independently and don't share exact coordinates at the same intersection. Routes are computed with Dijkstra's algorithm over that graph, biased by live tree canopy density for shaded routing and by a real XGBoost model for quieter routing. That model is trained on Melbourne's public pedestrian counting sensors and served live at request time.
Weather, UV index, and air quality come from Open-Meteo. Tree canopy coverage comes from Melbourne's urban tree dataset. Public drinking fountain locations come from the City of Melbourne's open data portal.
Supabase provides authentication, and Postgres (via Supabase) stores saved places, preferences, and walk history, with row level security scoping every user's data to themselves.
src/app/          Next.js App Router pages and API routes
src/components/    UI components
src/lib/           Client and server utilities, Supabase clients, providers
api/               Python route planning and ML inference functions
ml/                Model training pipeline, datasets, and evaluation
supabase/          Database migrations
Data sources
- City of Melbourne open data: pedestrian network, pedestrian counting sensors, urban tree canopy.
- OpenStreetMap, via the Overpass API, for street coverage beyond the City of Melbourne's own network export
- Open-Meteo, for weather, UV index, and air quality
- City of Melbourne (n.d.-a). Pedestrian Counting System (counts per hour) [Data set]. City of Melbourne Open Data Portal. Available at: official dataset page (accessed 24 August 2026).
The portal describes hourly fixed-counter observations from 2009 onward. Our canonical dataset combines three snapshots:
- Historical attachment through 31 October 2022.
- Internet Archive snapshot captured 12 January 2025, using only 1 November 2022–20 August 2024.
- Current portal export from 21 August 2024.
City of Melbourne (n.d.-b). Pedestrian Counting System—Sensor Locations [Data set]. City of Melbourne Open Data Portal. Available at: official dataset page (accessed 24 August 2026).
The publisher warns that sensors may be relocated or removed, which matters when interpreting historical counts.NASA Langley Research Center POWER Project (2026). POWER Hourly API: Melbourne CBD point, −37.8136°, 144.9631°, 1 May 2009–20 August 2026 [Data set]. Available at: POWER Hourly API documentation (retrieved 21 August 2026).
Also follow NASA’s official referencing guide. NASA requests an acknowledgement such as: “Data were obtained from NASA Langley Research Center’s Prediction Of Worldwide Energy Resources project, funded through the NASA Earth Science Division.” The current endpoint reports API v2.9.9, although that exact version was not captured in our original provenance.City of Melbourne (n.d.-c). Microclimate Sensors Data [Data set]. City of Melbourne Open Data Portal. Available at: official dataset page (accessed 24 August 2026).
Contains approximately 15-minute temperature, humidity, pressure, wind, particulate and noise readings. We aggregated these citywide and lagged them one hour.City of Melbourne (n.d.-d). Transport Activity Counts [Data set]. City of Melbourne Open Data Portal. Available at: official dataset page (accessed 24 August 2026).
The source reports five-minute AIRS classifications for pedestrians, cyclists, e-scooters and motor vehicles, with annual archives from 2023. We used 2023–2026 in the crowd experiment; traffic training used only 2024–11 May 2026.Department of Transport and Planning Victoria (n.d.-a). Traffic Signal Volume Data [Data set]. Victorian Government Open Data Portal. Available at: official dataset page (accessed 24 August 2026).
The data contain 15-minute per-detector SCATS volumes. We aggregated these to hourly intersection totals and used 2024–31 July 2026.Department of Transport and Planning Victoria (n.d.-b). Victorian Traffic Signals [Data set]. Victorian Government Open Data Portal. Available at: official dataset page (accessed 24 August 2026).
Used to associate SCATS identifiers with signal-site coordinates.Vacanza (n.d.). holidays: country- and subdivision-specific public holiday generator [Python software]. Available at: documentation (accessed 24 August 2026).
LeafRoute usesholidays.Australia(subdiv="VIC"). The repository constrains the package to>=0.70,<1, but the exact installed version was not preserved.
Attribution and licences
Sensor locations, microclimate, Transport Activity, SCATS and Victorian Traffic Signals are recorded as CC BY 4.0. A suitable combined attribution is:
Contains data provided by the City of Melbourne and the Victorian Department of Transport and Planning, used and transformed under Creative Commons Attribution 4.0. Changes include filtering, temporal aggregation, harmonisation and feature engineering.
The hourly pedestrian-count dataset is the exception: its current publisher API metadata has a null licence field. Do not claim that it is CC BY or redistribute its raw/derived data until the City confirms the terms. Internal model use is currently documented as pending confirmation.
AI disclosure
Claude (Anthropic) was used as a development assistant throughout this project, including code implementation, debugging, and documentation.
Built With
- eslint
- maplibre
- next.js
- openstreetmap
- playwright
- postgresql
- python
- react
- resend
- supabase
- tailwind
- typescript
- vercel
- xgboost


Log in or sign up for Devpost to join the conversation.