What it does
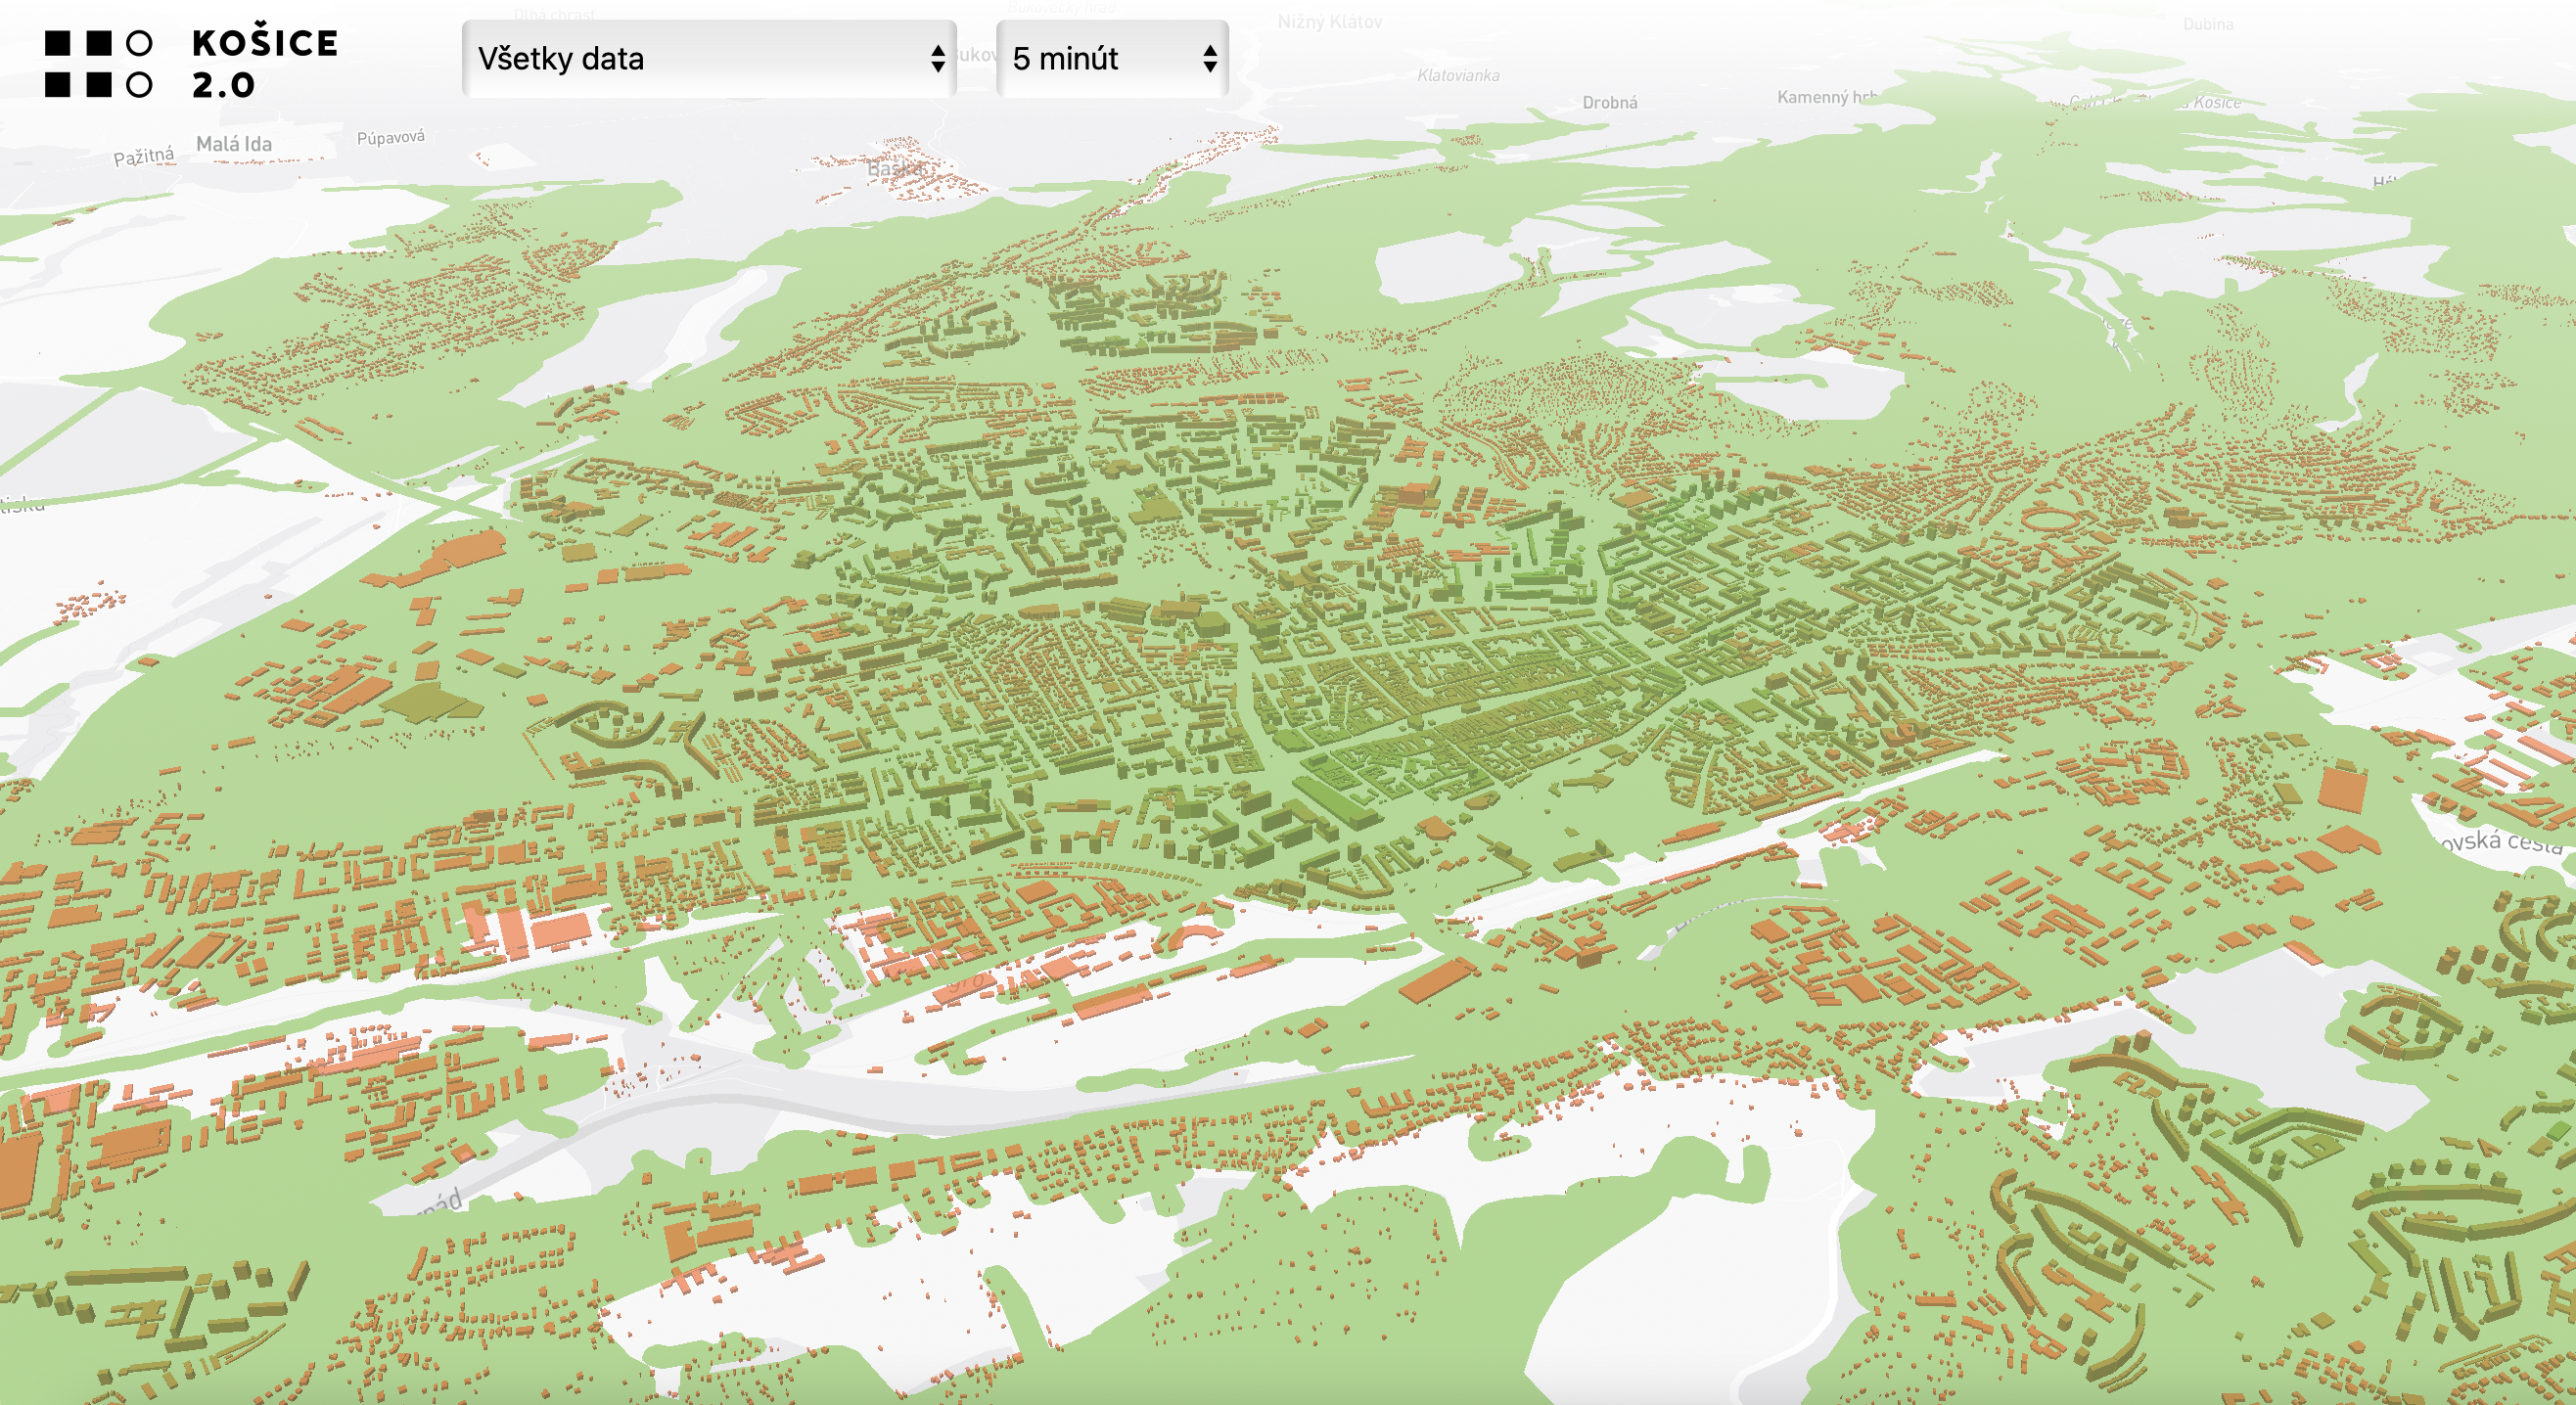
It's an interactive 3D map of buildings in the city of Kosice. It also displays the polygon areas of important buildings and the reachable area of the important buildings in polygon areas.
How we built it
We used Mapbox GL JS and React. We used Mapbox GL JS to display the map and React to display the data on the map.
Challenges we ran into
The biggest challenge was to process the 3D buildings data. We had to convert the data from the original format to the format that Mapbox GL JS can use. We also had to process the data to display the reachable area of the important buildings in polygon areas.
Accomplishments that we're proud of
The look of the map and the functionality of the map.
What we learned
About the 3D buildings data and how to process it.
What's next for Košice 2.0 - Noove
We want to add more data to the map and make it more interactive.

Log in or sign up for Devpost to join the conversation.