-
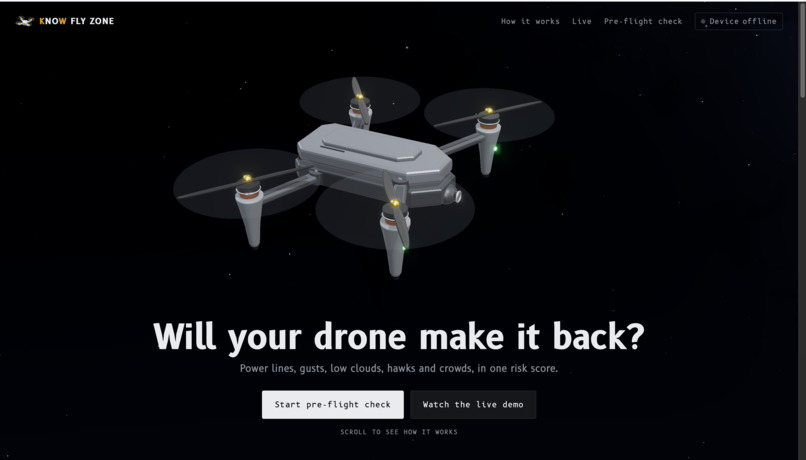
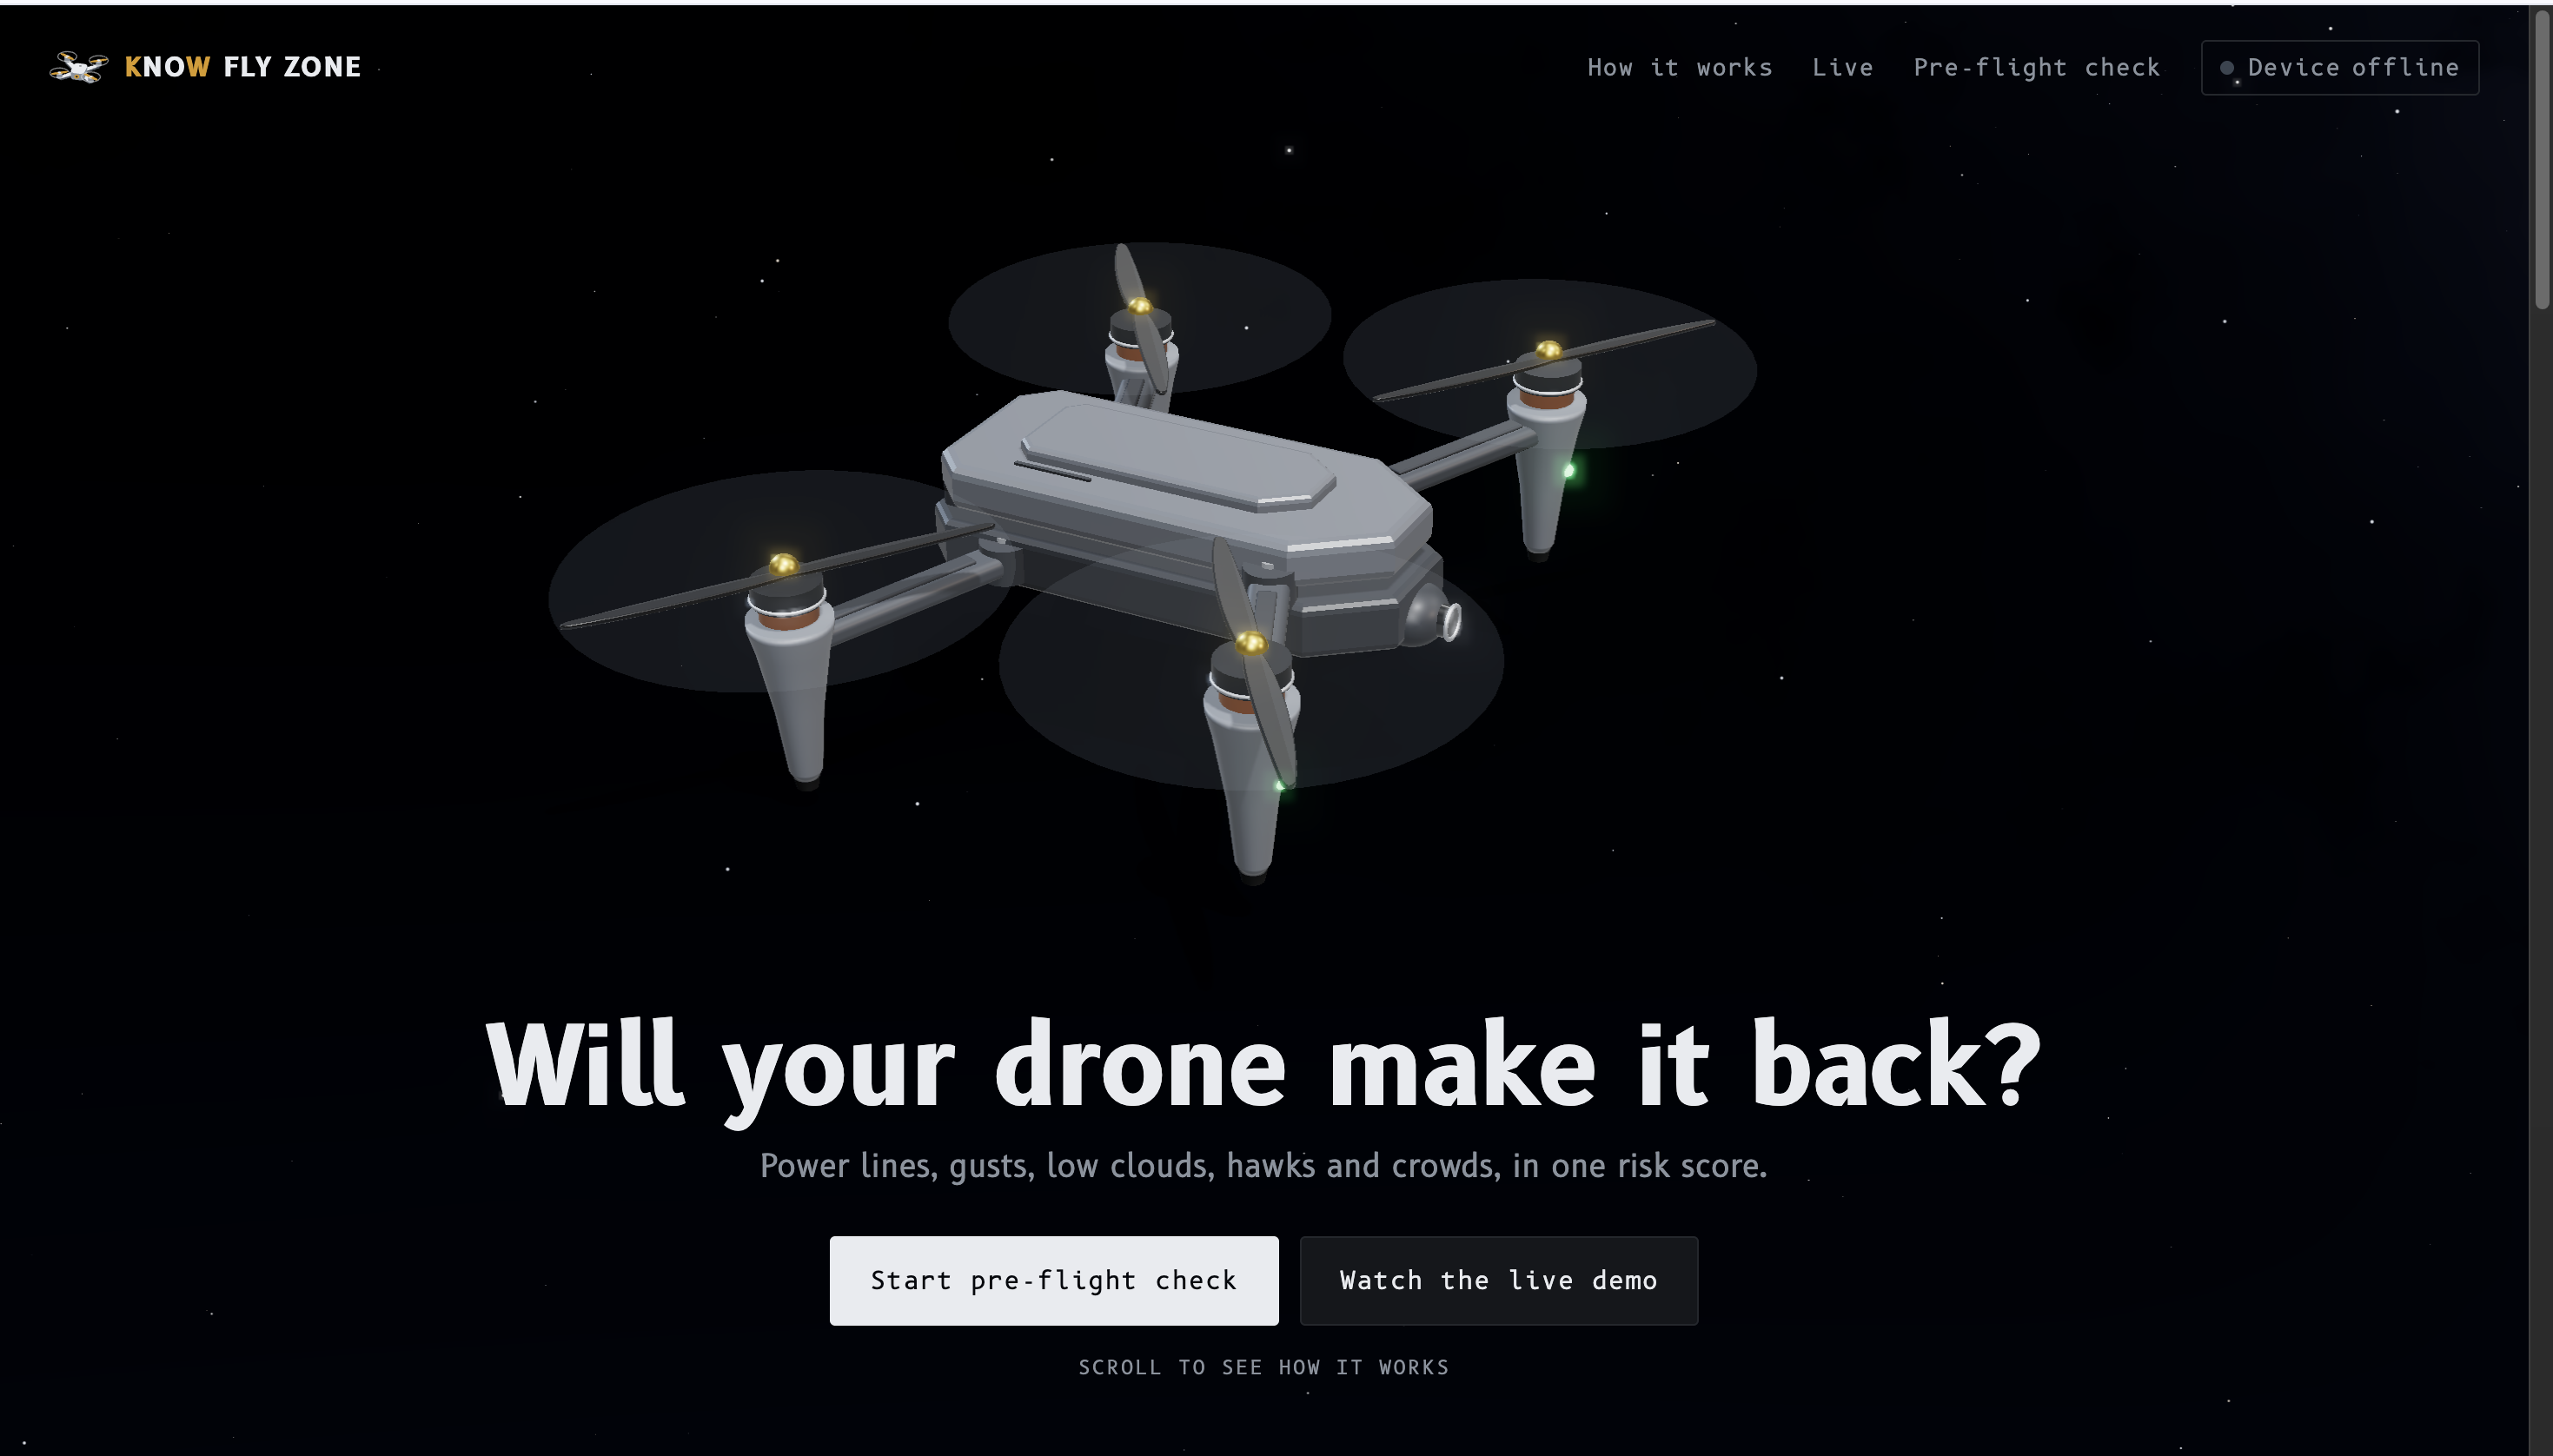
Home: will your drone make it back?
-
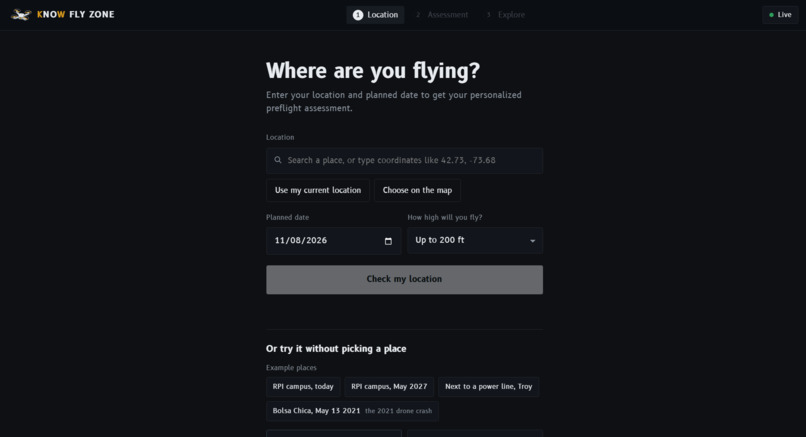
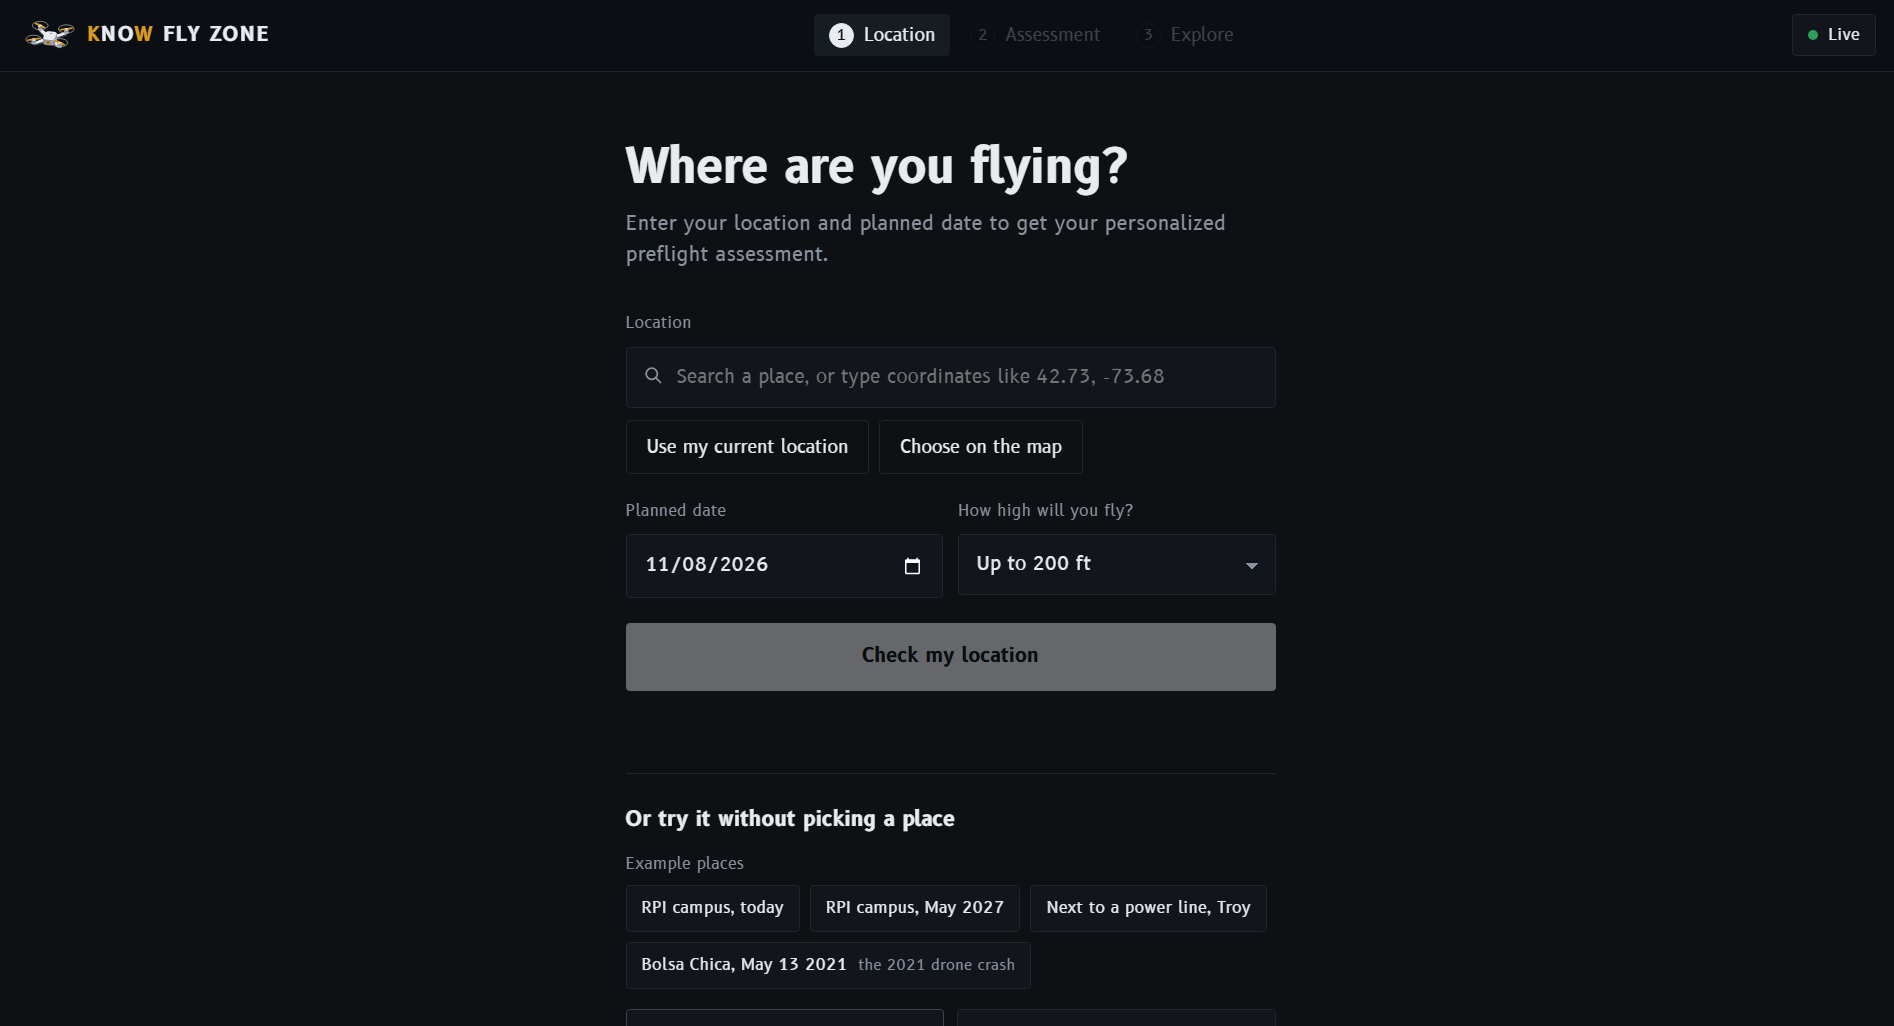
Location Settings
-
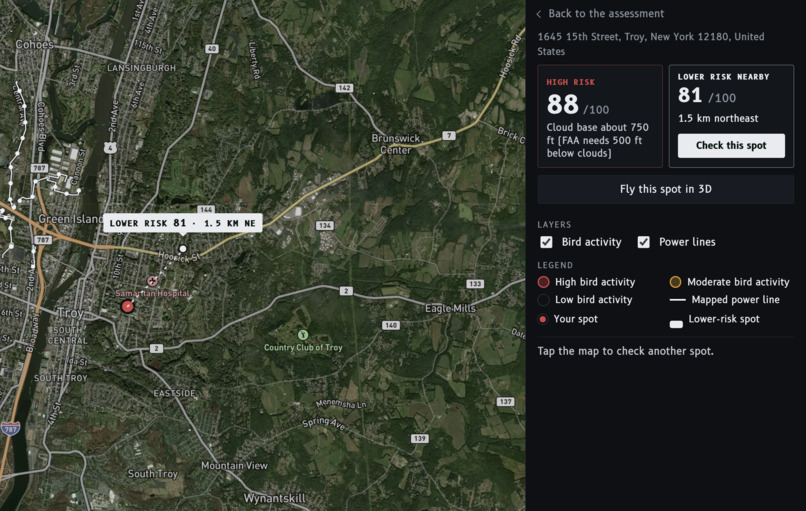
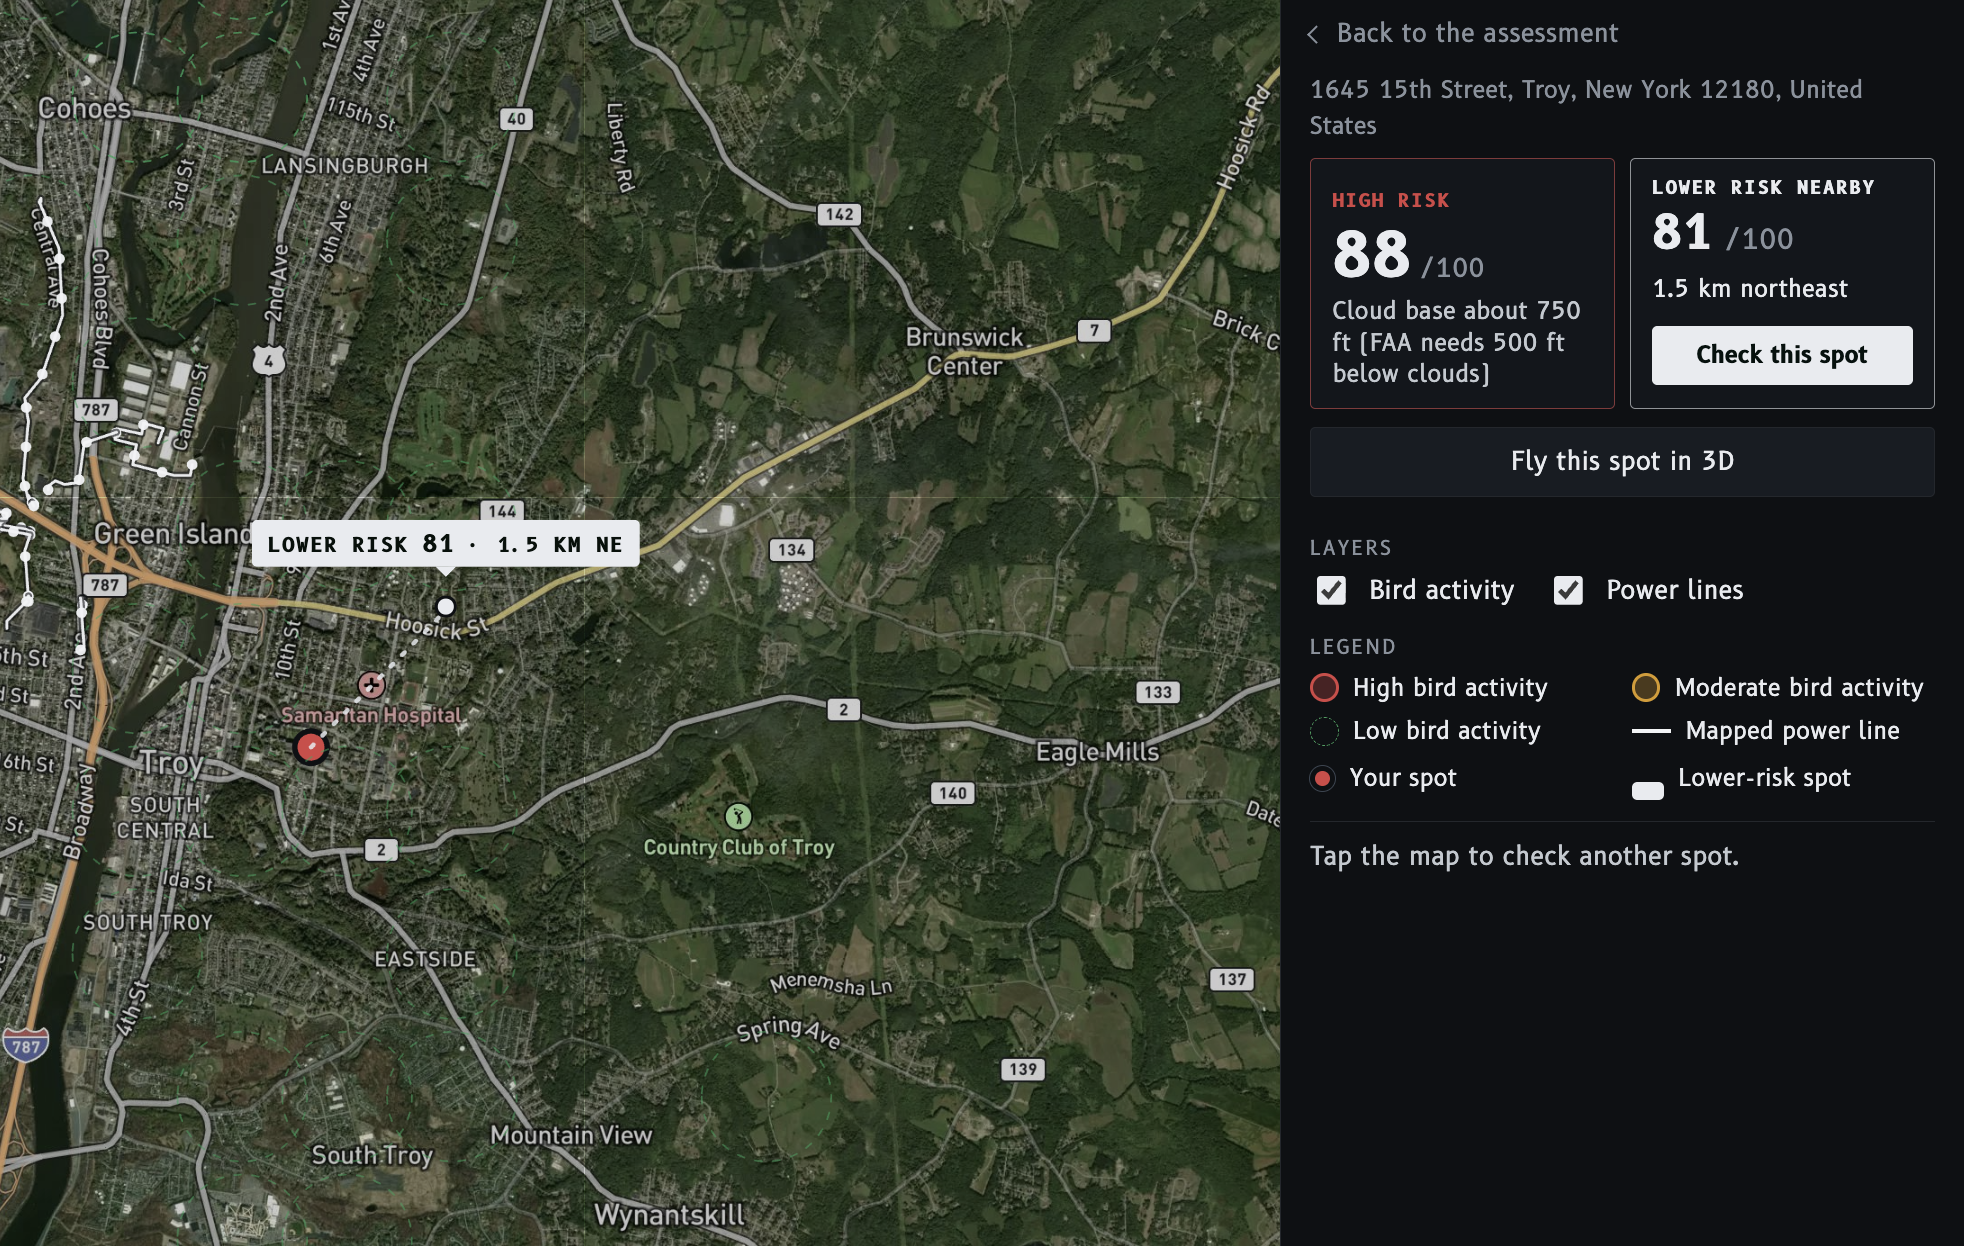
Map of nearby hazards and risk scores
-
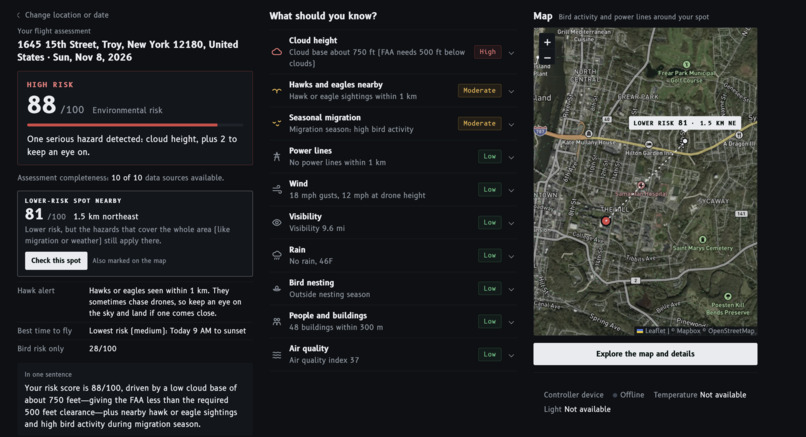
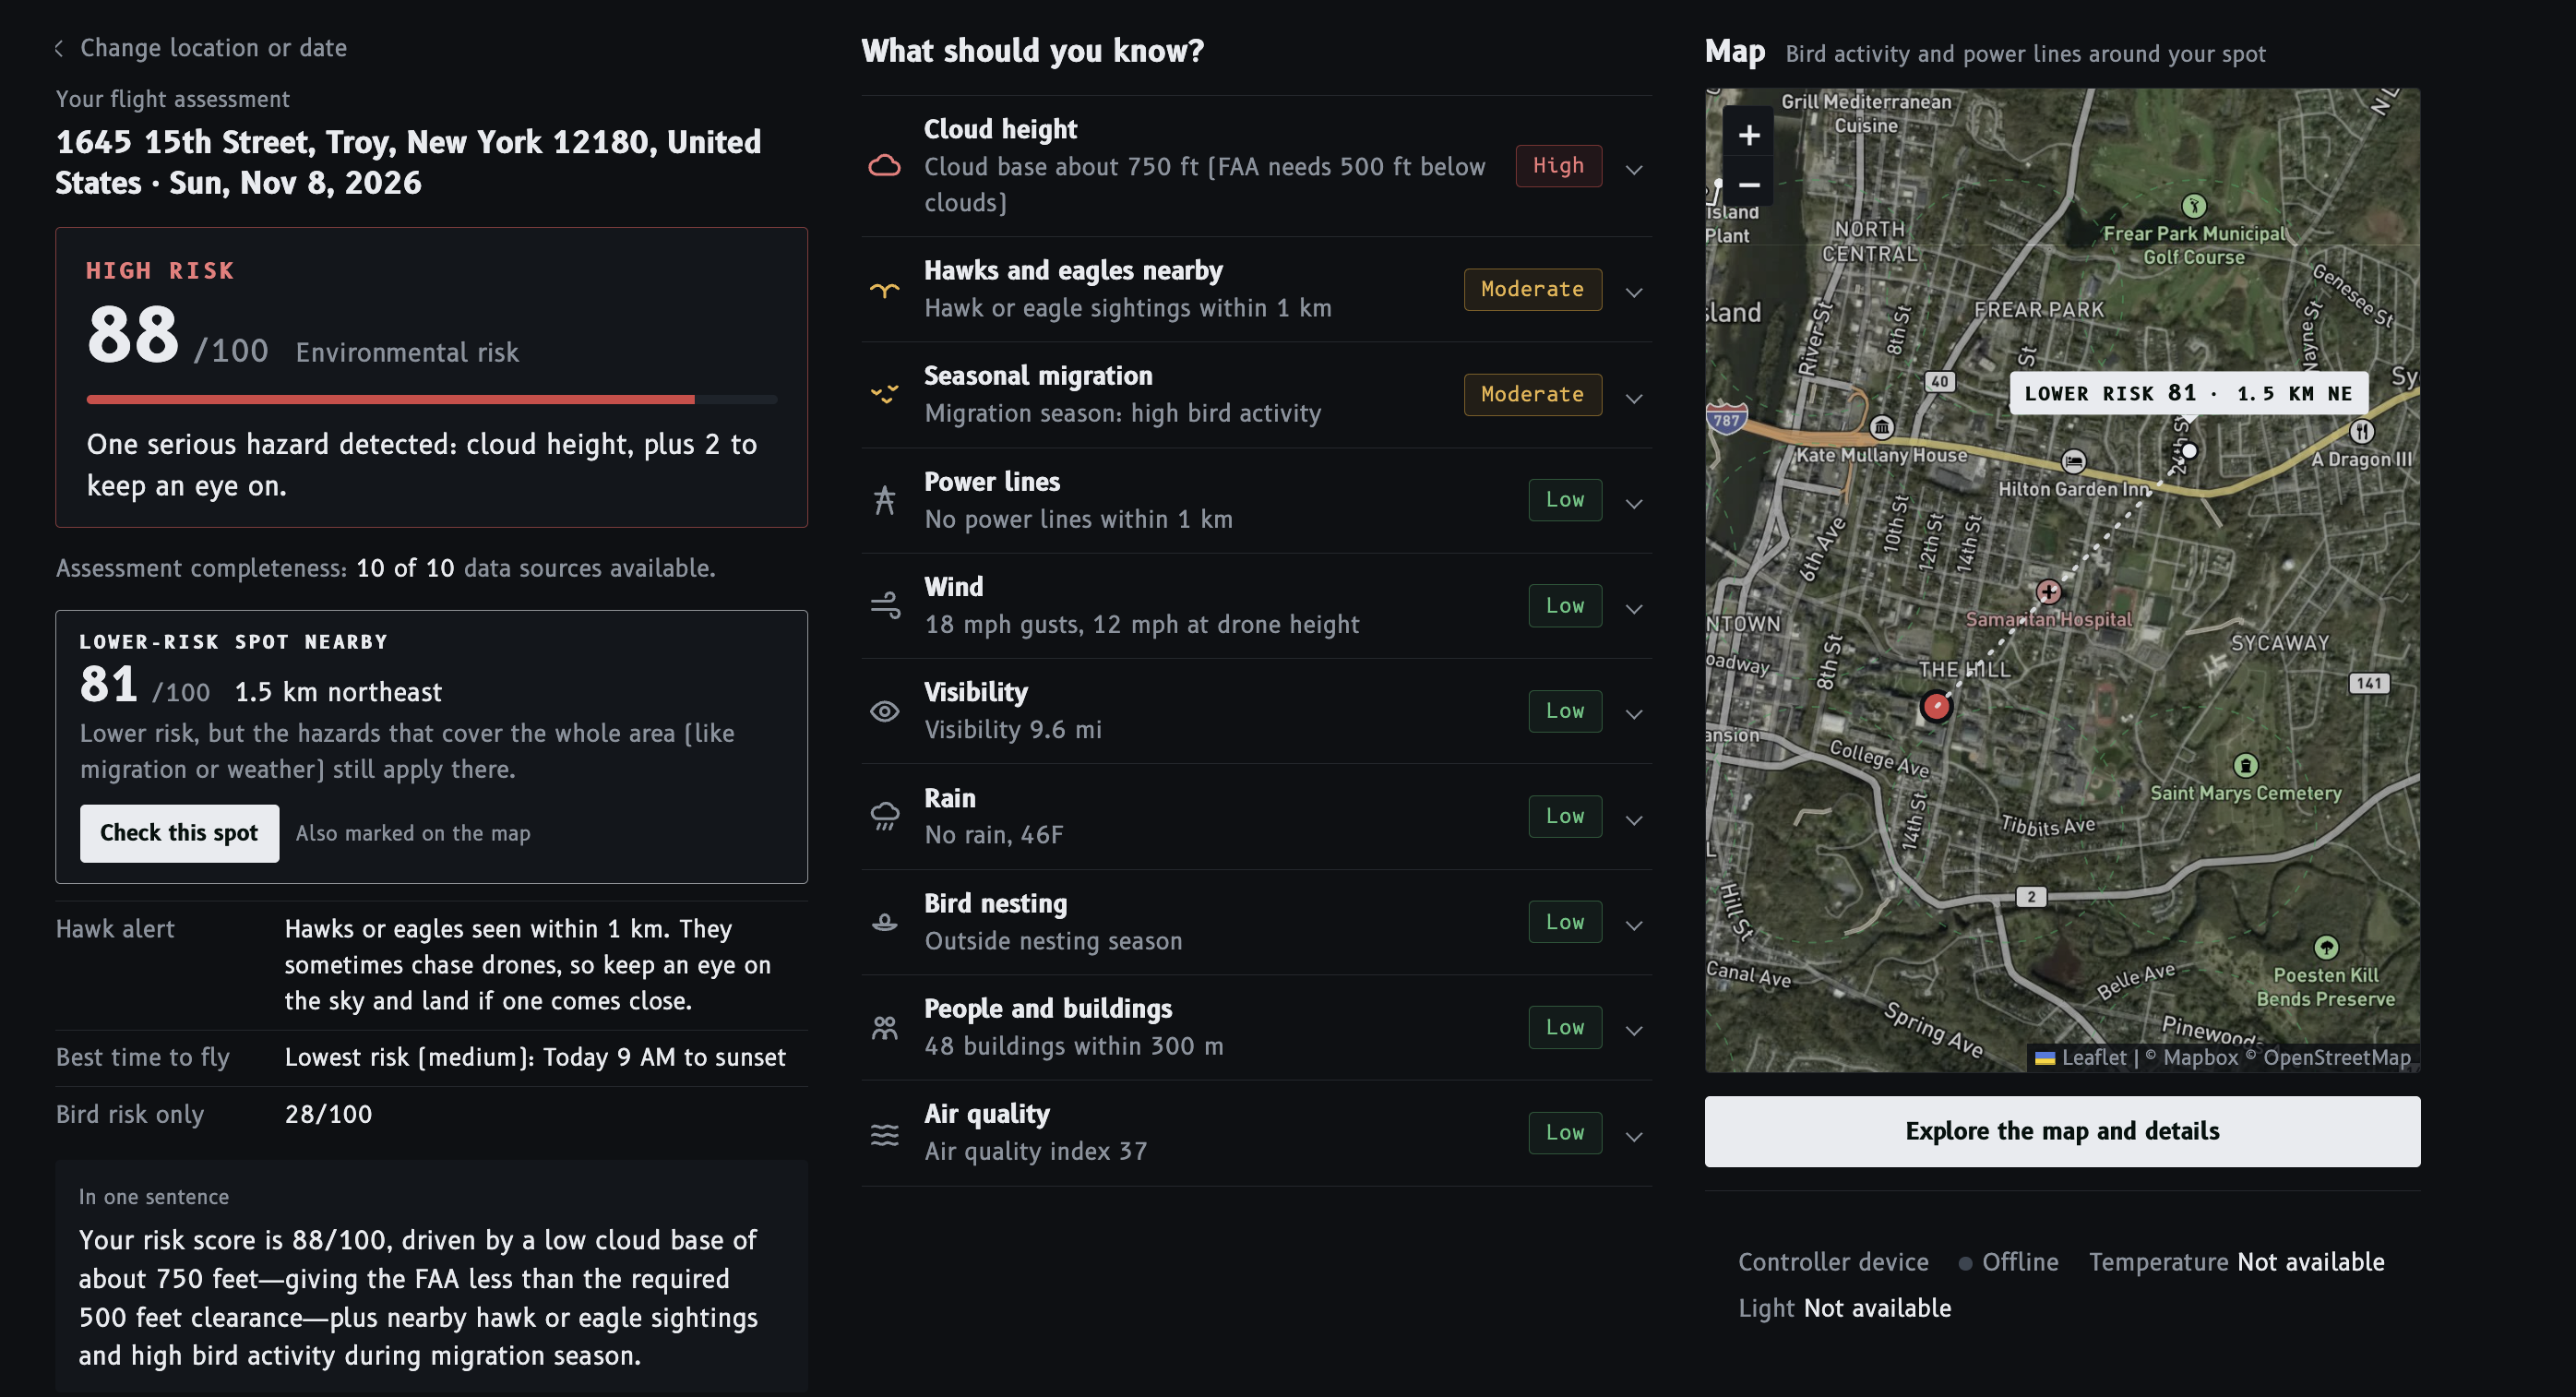
Full 10-hazard pre-flight report
-
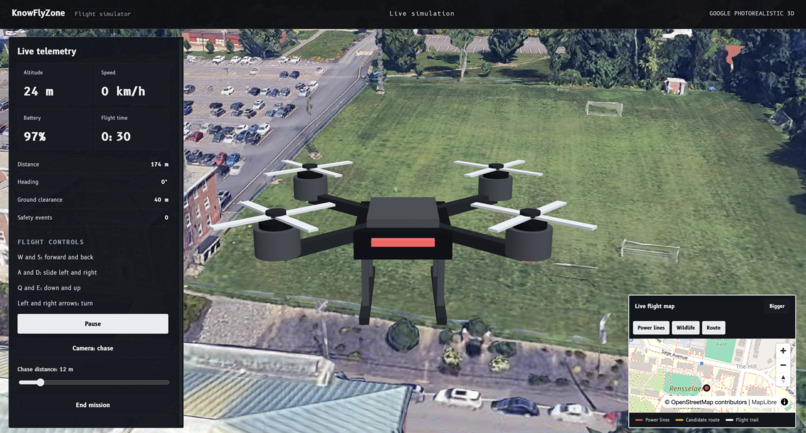
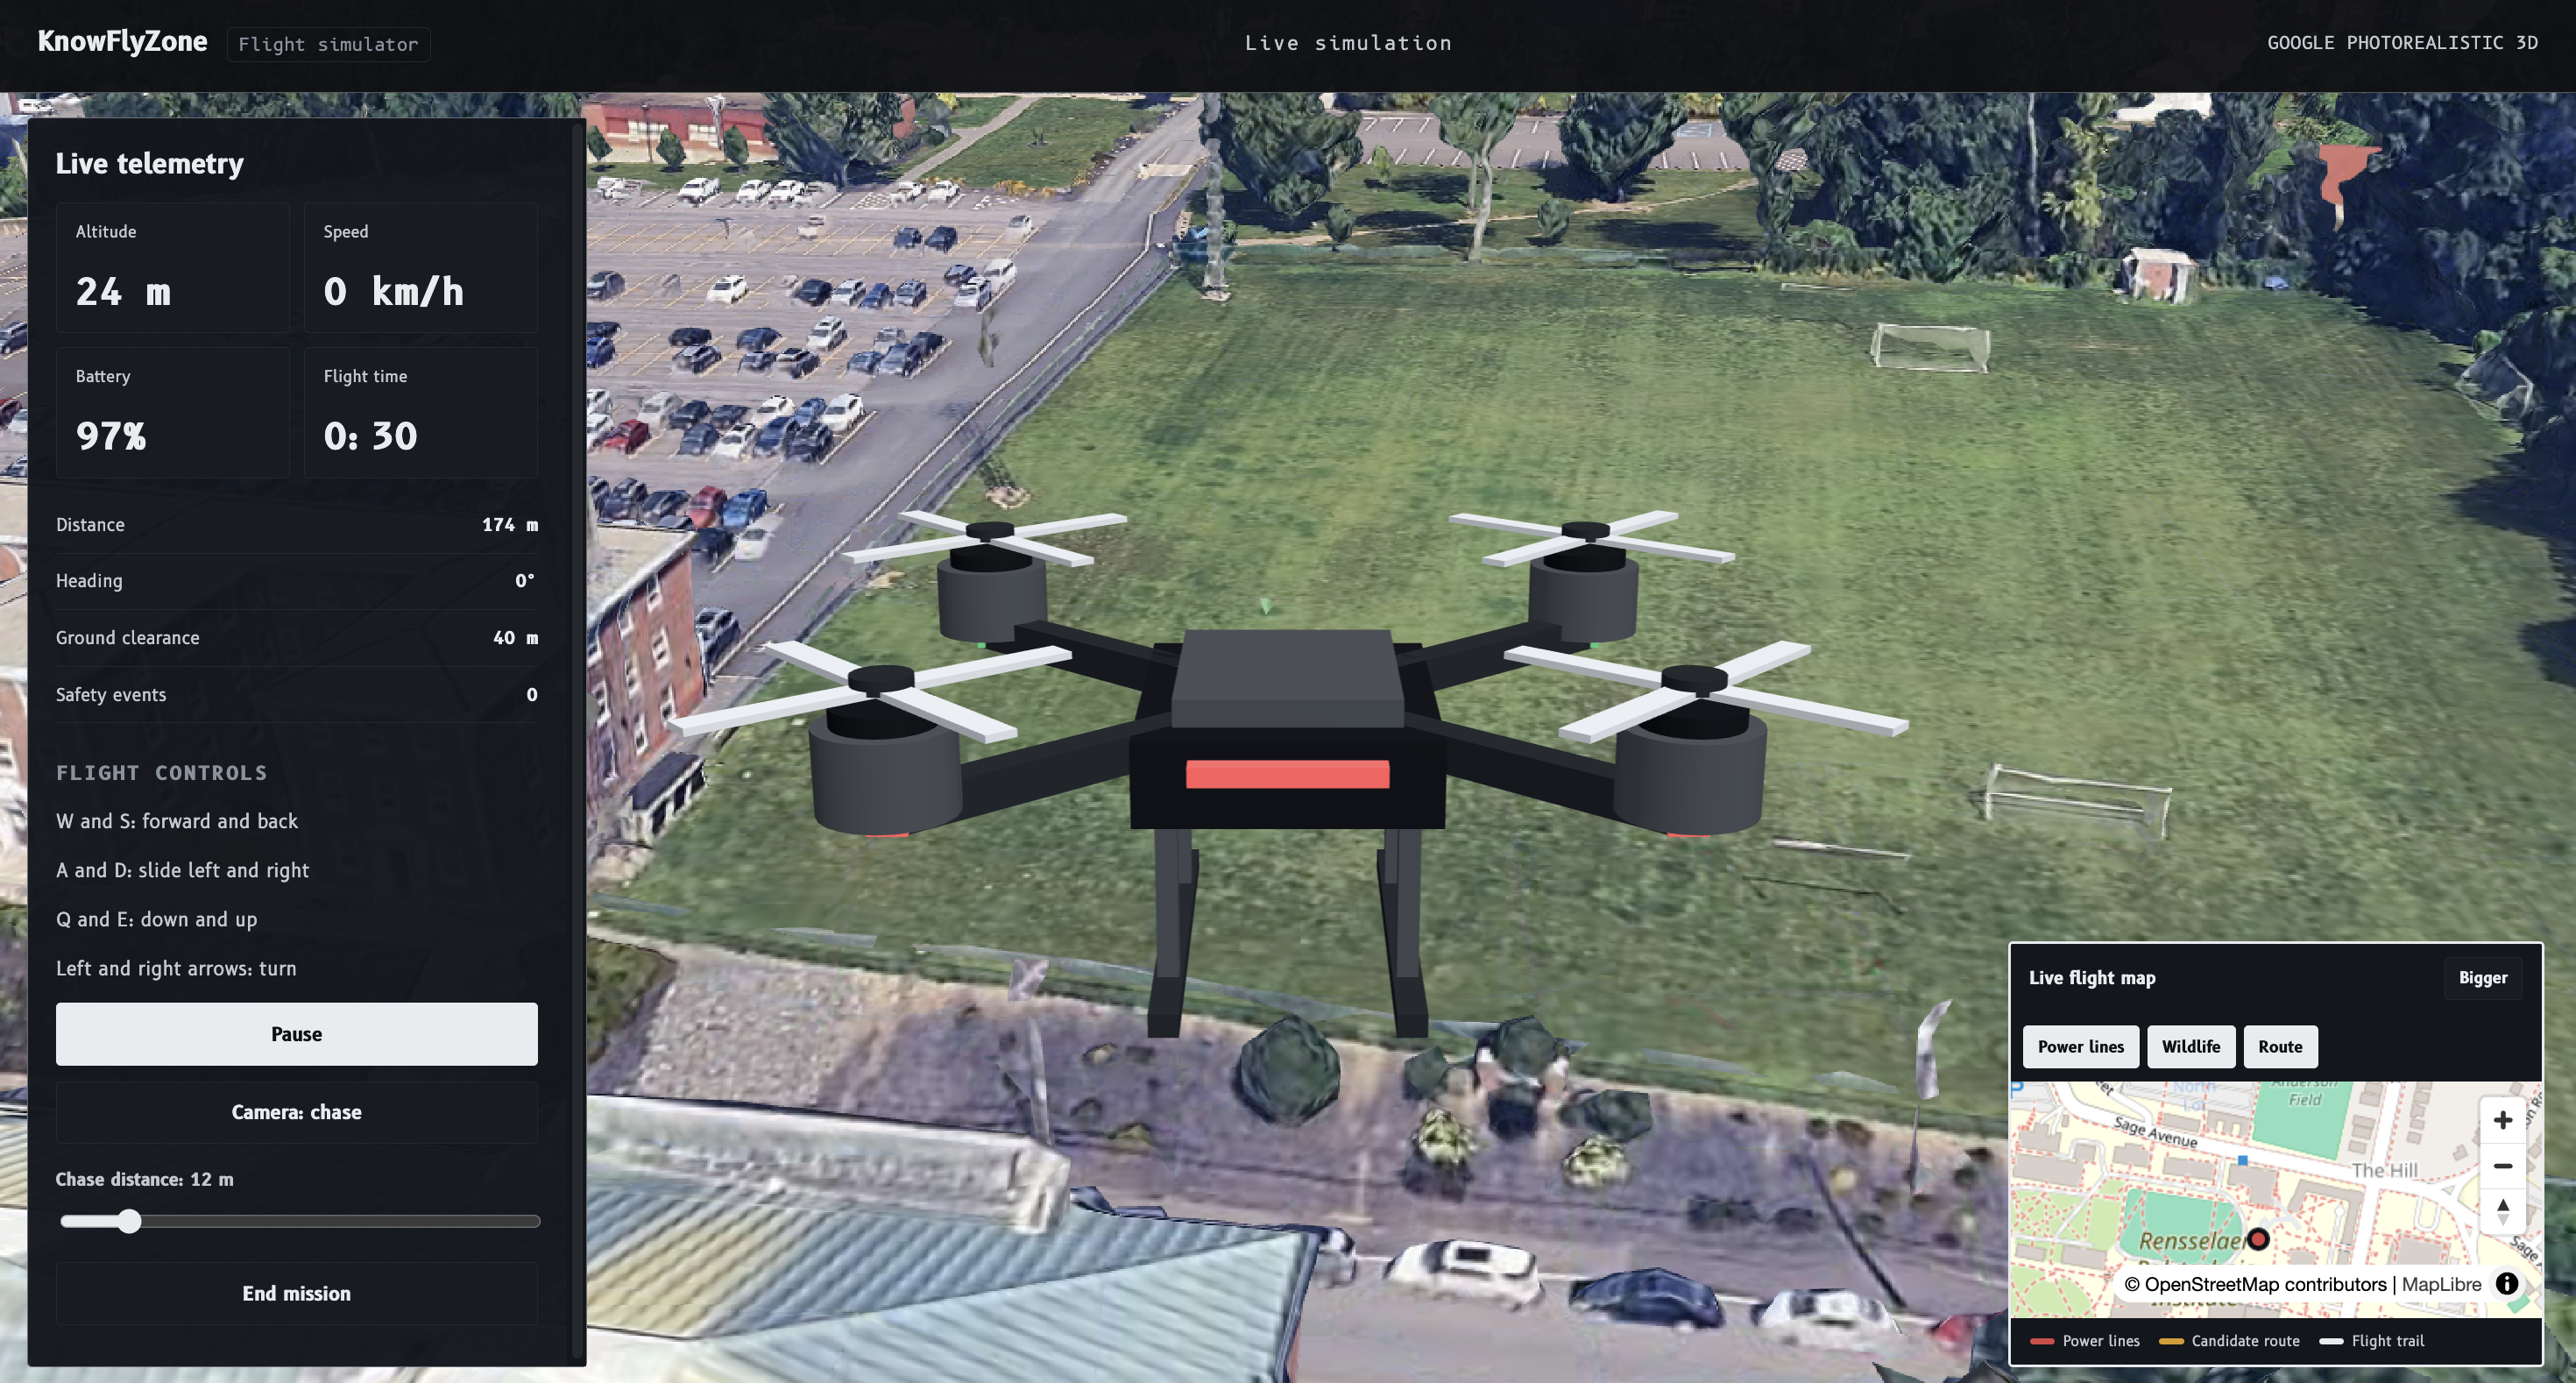
3D Drone Simulation
-
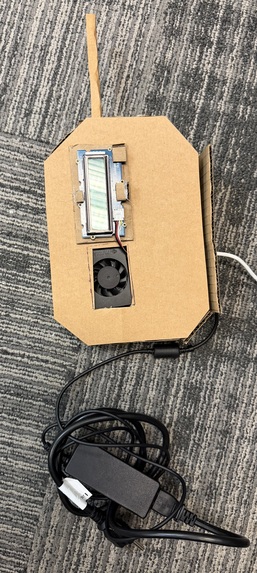
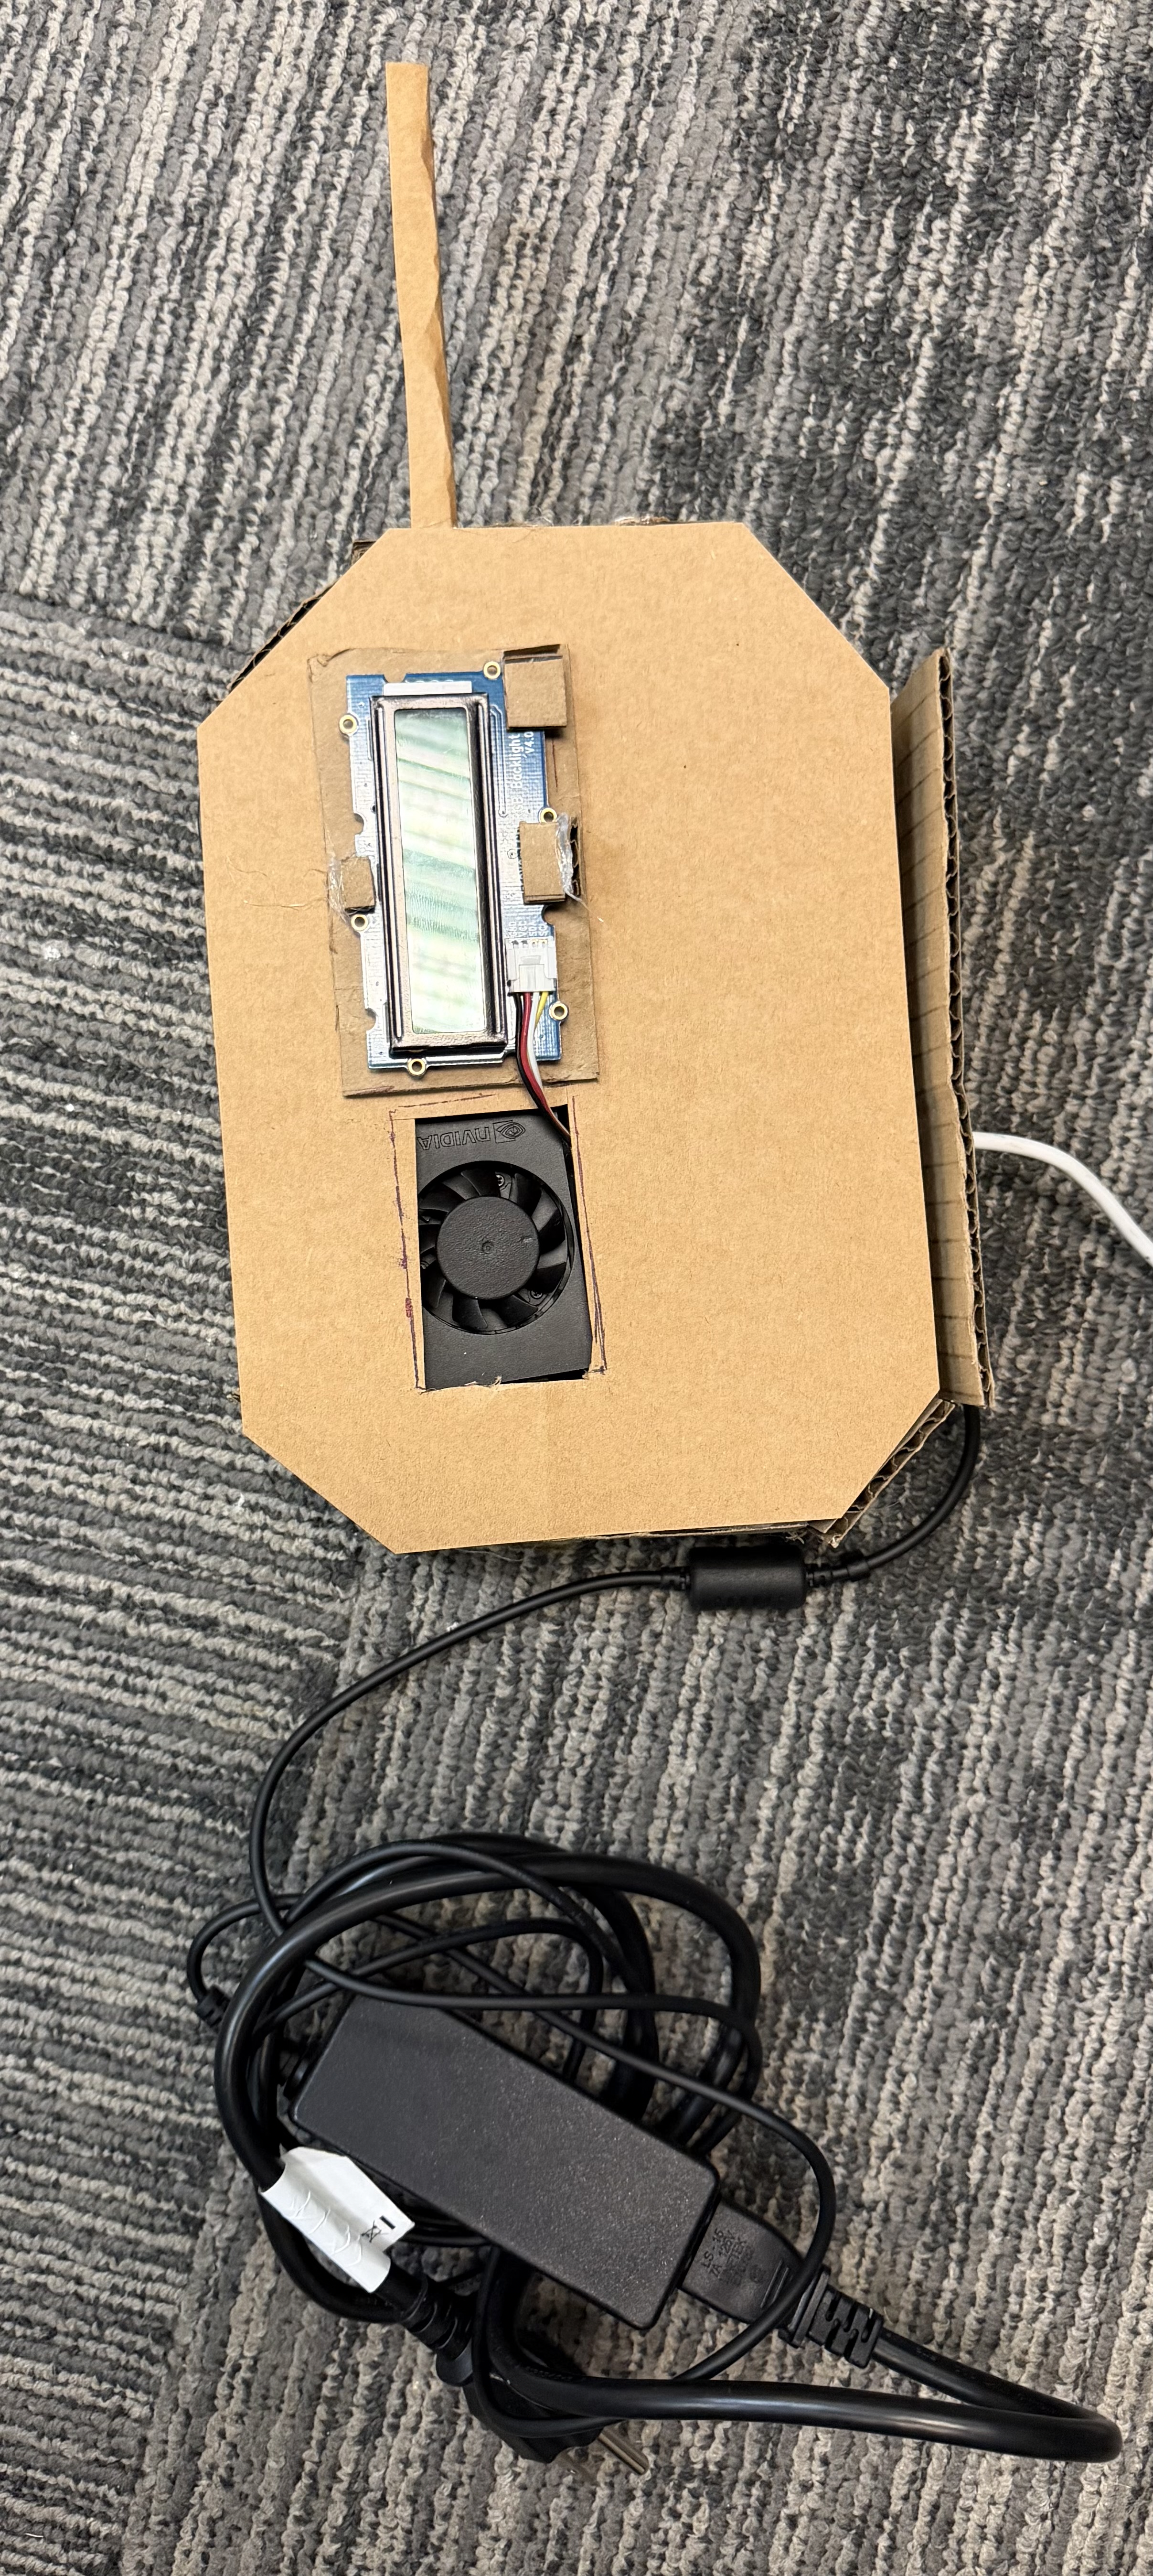
The remote display of the drone
Inspiration
Most drone crashes come from things you can't see from the ground: a gust at 200 feet, clouds lower than you thought, a hawk that treats your drone like a rival, or a power line that's invisible on a phone screen. Apps like B4UFLY tell you where you're allowed to fly. None of them tell you if it's actually safe right now.
So we built KnowFlyZone around one question you should ask before every takeoff: "Will my drone make it back?"
It also fits this year's theme, In the Clouds, pretty literally. Low clouds are one of our ten hazards. We estimate the cloud base and flag it when it's too low for the height you plan to fly.
What it does
You pick a spot, a date and how high you'll fly. KnowFlyZone checks ten hazards (power lines, wind, low clouds, visibility, rain, people below, air quality, hawks and eagles, bird migration and nesting season) and turns them into one risk score from 0 to 100.
The web app
- Pick any spot. Search for a place, even a specific building like a dining hall. Or use your location, or tap the map.
- One screen, one score. You get the score, a plain label (low, medium or high), and every hazard explained in plain English. If a data source is down, the app tells you which one. Missing data never counts as safe.
- Your flight, not the worst case. Clouds are checked against the height you plan to fly, plus the 500 feet below the clouds that licensed pilots must keep. Flying at 100 feet under a 614 foot cloud base scores medium. Flying at 400 feet scores high.
- A lower-risk spot nearby. If a spot within 3 km scores lower, it shows up on the map with its score, and one tap checks it. If nothing nearby is better (say, low clouds cover the whole area), the app says so and suggests a better time to fly.
- Explore map. A satellite map with recent bird activity and mapped power lines. Tap anything to see what it means and how far it is from you.
- Spoken results. The app reads the risk out loud, so you can keep your eyes on the drone.
- 3D flight simulator. Fly the spot you just checked over photo-real 3D buildings, with the same risk score, live telemetry and a PDF flight report at the end.
- Guided tour. A 30-second tour of 5 real places in Troy (campus, downtown, the riverfront, right next to a power line, and an open park), each checked live, with our device following along.
- Works offline. Recent results are saved in your browser, and sample scenarios work with no connection at all.
The device
A small module built on an NVIDIA Jetson Orin Nano with a 16x2 character screen. When you check a spot in the app, the screen shows the same score and the main reason ("RISK 91, power line 40 m away") within seconds, so you don't have to keep looking down at your phone. If it can't reach our server, it says so instead of showing an old result.
How we built it
Data
- Open-Meteo: live forecasts for wind, gusts, low clouds, visibility and rain, refreshed every 30 minutes.
- OpenStreetMap: power lines and nearby buildings.
- eBird and iNaturalist: recent hawk, raptor and other bird sightings.
Backend and services
- MongoDB Atlas: stores bird activity areas and caches checks so repeat lookups are instant.
- Tiger Data: tracks bird sightings, pre-flight checks and device readings over time.
- Google Gemini: writes a one-sentence, plain-English explanation of each result.
- Fish Audio: the voice that reads results out loud.
- Vultr and Caddy: one server running everything, with automatic HTTPS, live at knowflyzone.vip (a GoDaddy Registry .vip domain).
The web app
- Vite and JavaScript for the landing page and pre-flight tool.
- Leaflet and Mapbox for the satellite map and everything drawn on it.
- Three.js for the 3D drone on the landing page, which assembles itself as you scroll.
- Photon and Mapbox search combined, so named buildings show up, not just towns.
- React, Cesium and a small Node server for the 3D flight simulator.
- B612, the typeface Airbus designed for cockpit displays, for the whole design.
The risk score
Each hazard adds points based on its level and on how bad the actual measurement is (how close the power line is, how strong the gusts are, how many sightings are nearby), with a severity \( \sigma_h \in [0, 1] \):
$$ \text{raw} = B + \sum_h \left( P_{\text{level}(h)} + G_{\text{level}(h)} \, \sigma_h \right) $$
Here \( B \) is the bird activity score. The worst hazard decides the band (low 0 to 29, medium 30 to 59, high 60 to 100), and the raw points are eased into that band, so the number always agrees with the worst hazard:
$$ \text{score} = \text{lo} + (\text{hi} - \text{lo}) \, \frac{x}{x + k}, \qquad x = \text{raw} - \text{base} $$
The device
- NVIDIA Jetson Orin Nano runs it. Every 5 seconds it asks our server for the latest score for the spot you checked.
- A 16x2 character screen shows the score and the main reason.
- All the risk logic stays on the server, so the device only displays results. That's what let us swap boards so many times.
Challenges we ran into
Software
- Every spot scored 30. Our first formula pinned scores to the bottom of their band, and migration season made almost everywhere medium. Half our checks said exactly 30. We rebuilt the score so the number follows the real measurements.
- The lower-risk spot almost never showed up. It only compared birds, and gave up whenever a power line was the problem. Now it compares everything and never suggests a spot next to a power line.
- Search couldn't find buildings. "Busch Dining Hall" returned nothing. Combining two search sources fixed it.
- Nobody understood our first demo. It walked 10 unnamed points along a straight line. We replaced it with a tour of 5 named places, each showing one hazard.
- Too strict for hobby flyers. We first assumed everyone flies at the 400 foot limit, so low clouds made almost everything high risk. Now you tell us how high you'll fly.
- Venue Wi-Fi and secrets. Certificate errors blocked installs, and GitHub blocked a push because an API key slipped into the code. We moved every key into files that never get committed.
Hardware
We went through four boards in one weekend: ESP32-C3, then Raspberry Pi 4, then Arduino UNO Q, then NVIDIA Jetson Orin Nano.
- Not enough memory. The ESP32-C3 has 400 KB of RAM. Vision models need hundreds of MB, so we moved up to the Jetson.
- No analog inputs. The Raspberry Pi and Jetson can't read analog signals, so we added analog-to-digital converters.
- Getting it online at a hackathon. The Jetson had to reach our server over a phone hotspot, and the device only checked in when it had sensor readings, so the app kept saying "offline." We changed it to check in every time.
Accomplishments that we're proud of
- It works end to end. Live data goes in, a score comes out, and it shows up on the web app, the simulator and the device at the same time.
- It's live and works anywhere. Any location, real data, at knowflyzone.vip.
- It's honest. The app never says "safe" when it just doesn't know, and the device never shows an old result.
- It tells you where to go. Not just what's wrong, but the nearest lower-risk place and a better time to fly.
- We didn't give up on the hardware. Four boards later, we still have a working device.
What we learned
- Maps are harder than they look. Search, map tiles and live layers, and why one search source is never enough.
- One number can hide a lot. Making a score honest took more work than making it.
- Deploying for real. DNS, HTTPS certificates, reverse proxies, and running the whole thing on one server.
- Design for a first-time viewer. If a judge needs us to explain a screen, the screen is wrong.
- Hardware basics. Reading pinouts and datasheets, why I2C needs pull-up resistors, and using a multimeter to track down faults.
- Keep the device simple. It only displays results. All the risk logic stays on the server, which is what let us swap boards so many times.
What's next for KnowFlyZone
- A real enclosure: a custom circuit board and a 3D-printed case with its own battery, so it clips onto a controller.
- Scoring during the flight: updates in real time as the drone moves.
- Airspace rules: add FAA airspace data and temporary flight restrictions, so one check covers what's legal and what's safe.
- Better bird data: partner with local Audubon chapters for raptor and nesting information.
Built With
- anthropic
- claude
- ebird
- fish-audio
- gemini
- inaturalist
- jetson-nano
- mongodb
- openstreetmap
- python
- tiger-data
