Inspiration
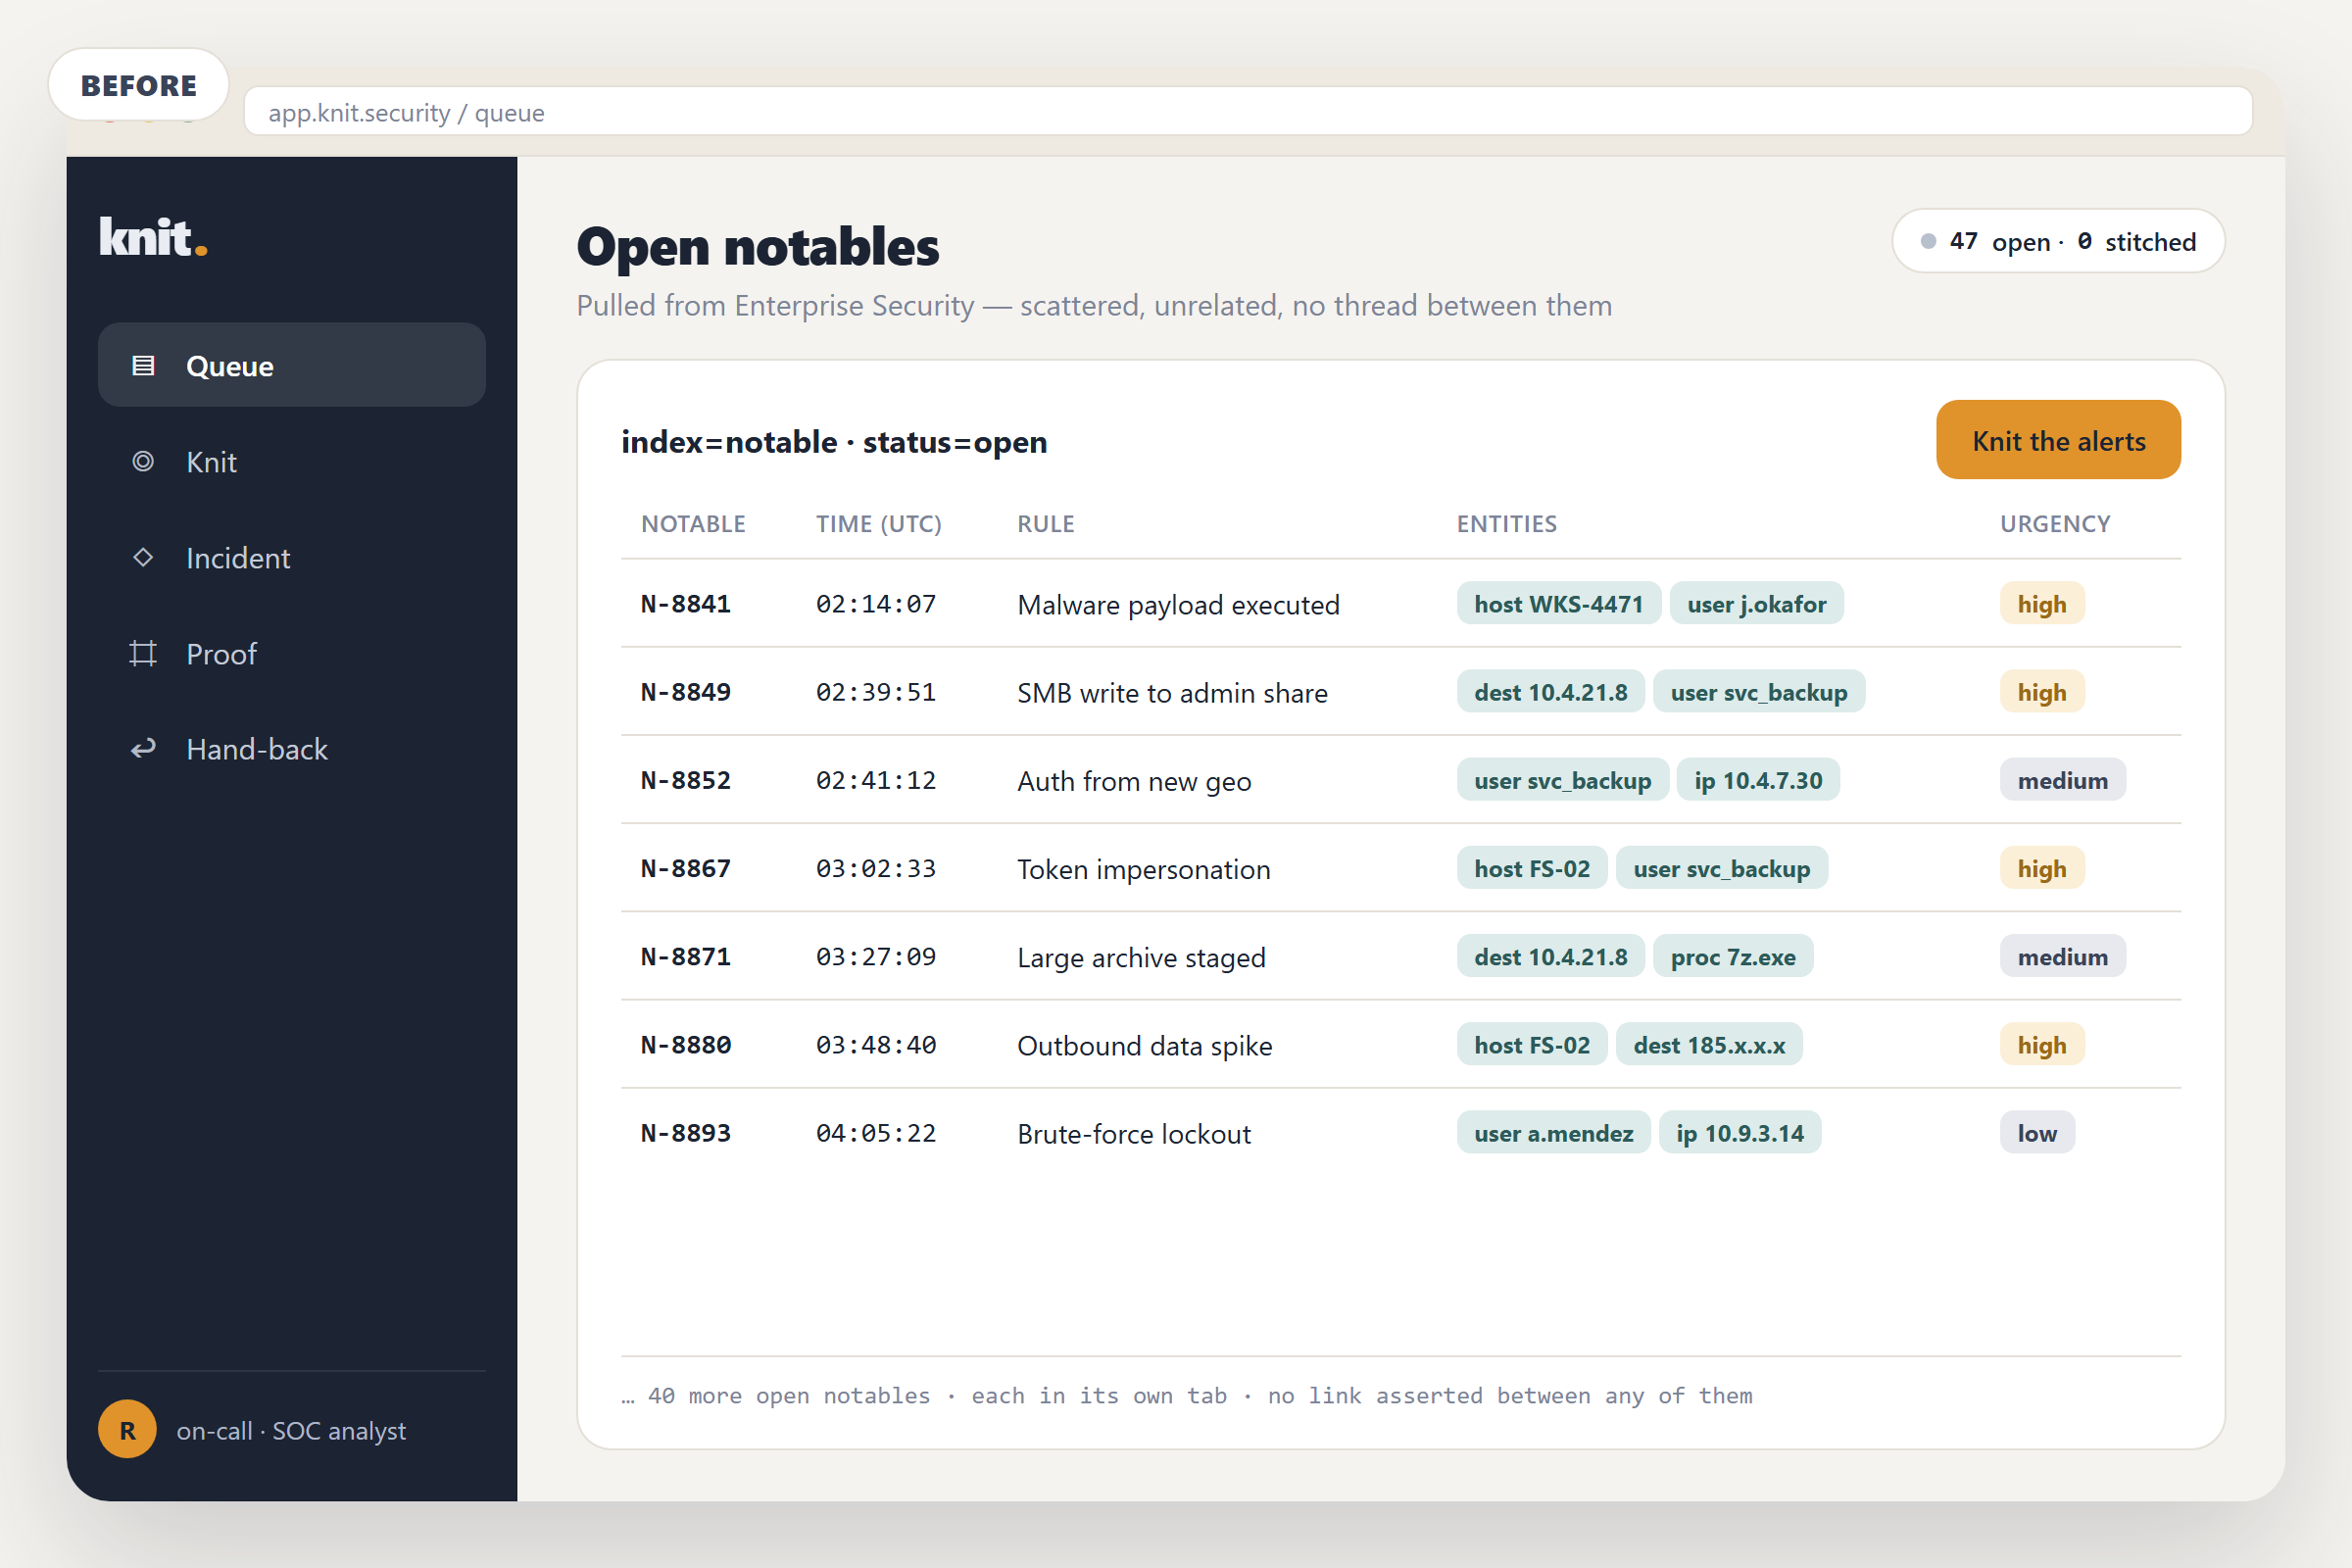
I sat with a detection engineer the morning after a forwarder quietly died. Her Splunk was calm: no alerts, no errors, a wall of green saved searches. She read it as a good night. One of her sourcetypes had stopped arriving at 3am, and every detection that depended on it had spent the whole night unable to fire. It produced no error and no alert. It stayed silent, and on a SOC dashboard silence reads as safe.
Nobody instruments that failure. A detection that can't fire still looks like protection. Every detection you ever wrote assumes the data still flows, and the day it stops, the detection stays quiet; it goes blind while you keep trusting it.
So the easy fix worried me. The easy fix asks a model "is this detection healthy?" and lets it sound confident. In a SOC, a confident wrong answer restates the whole problem. If an AI is going to tell you a detection is fine, you should be able to make it prove that, on your own data, on your own clock, right now.
What it does
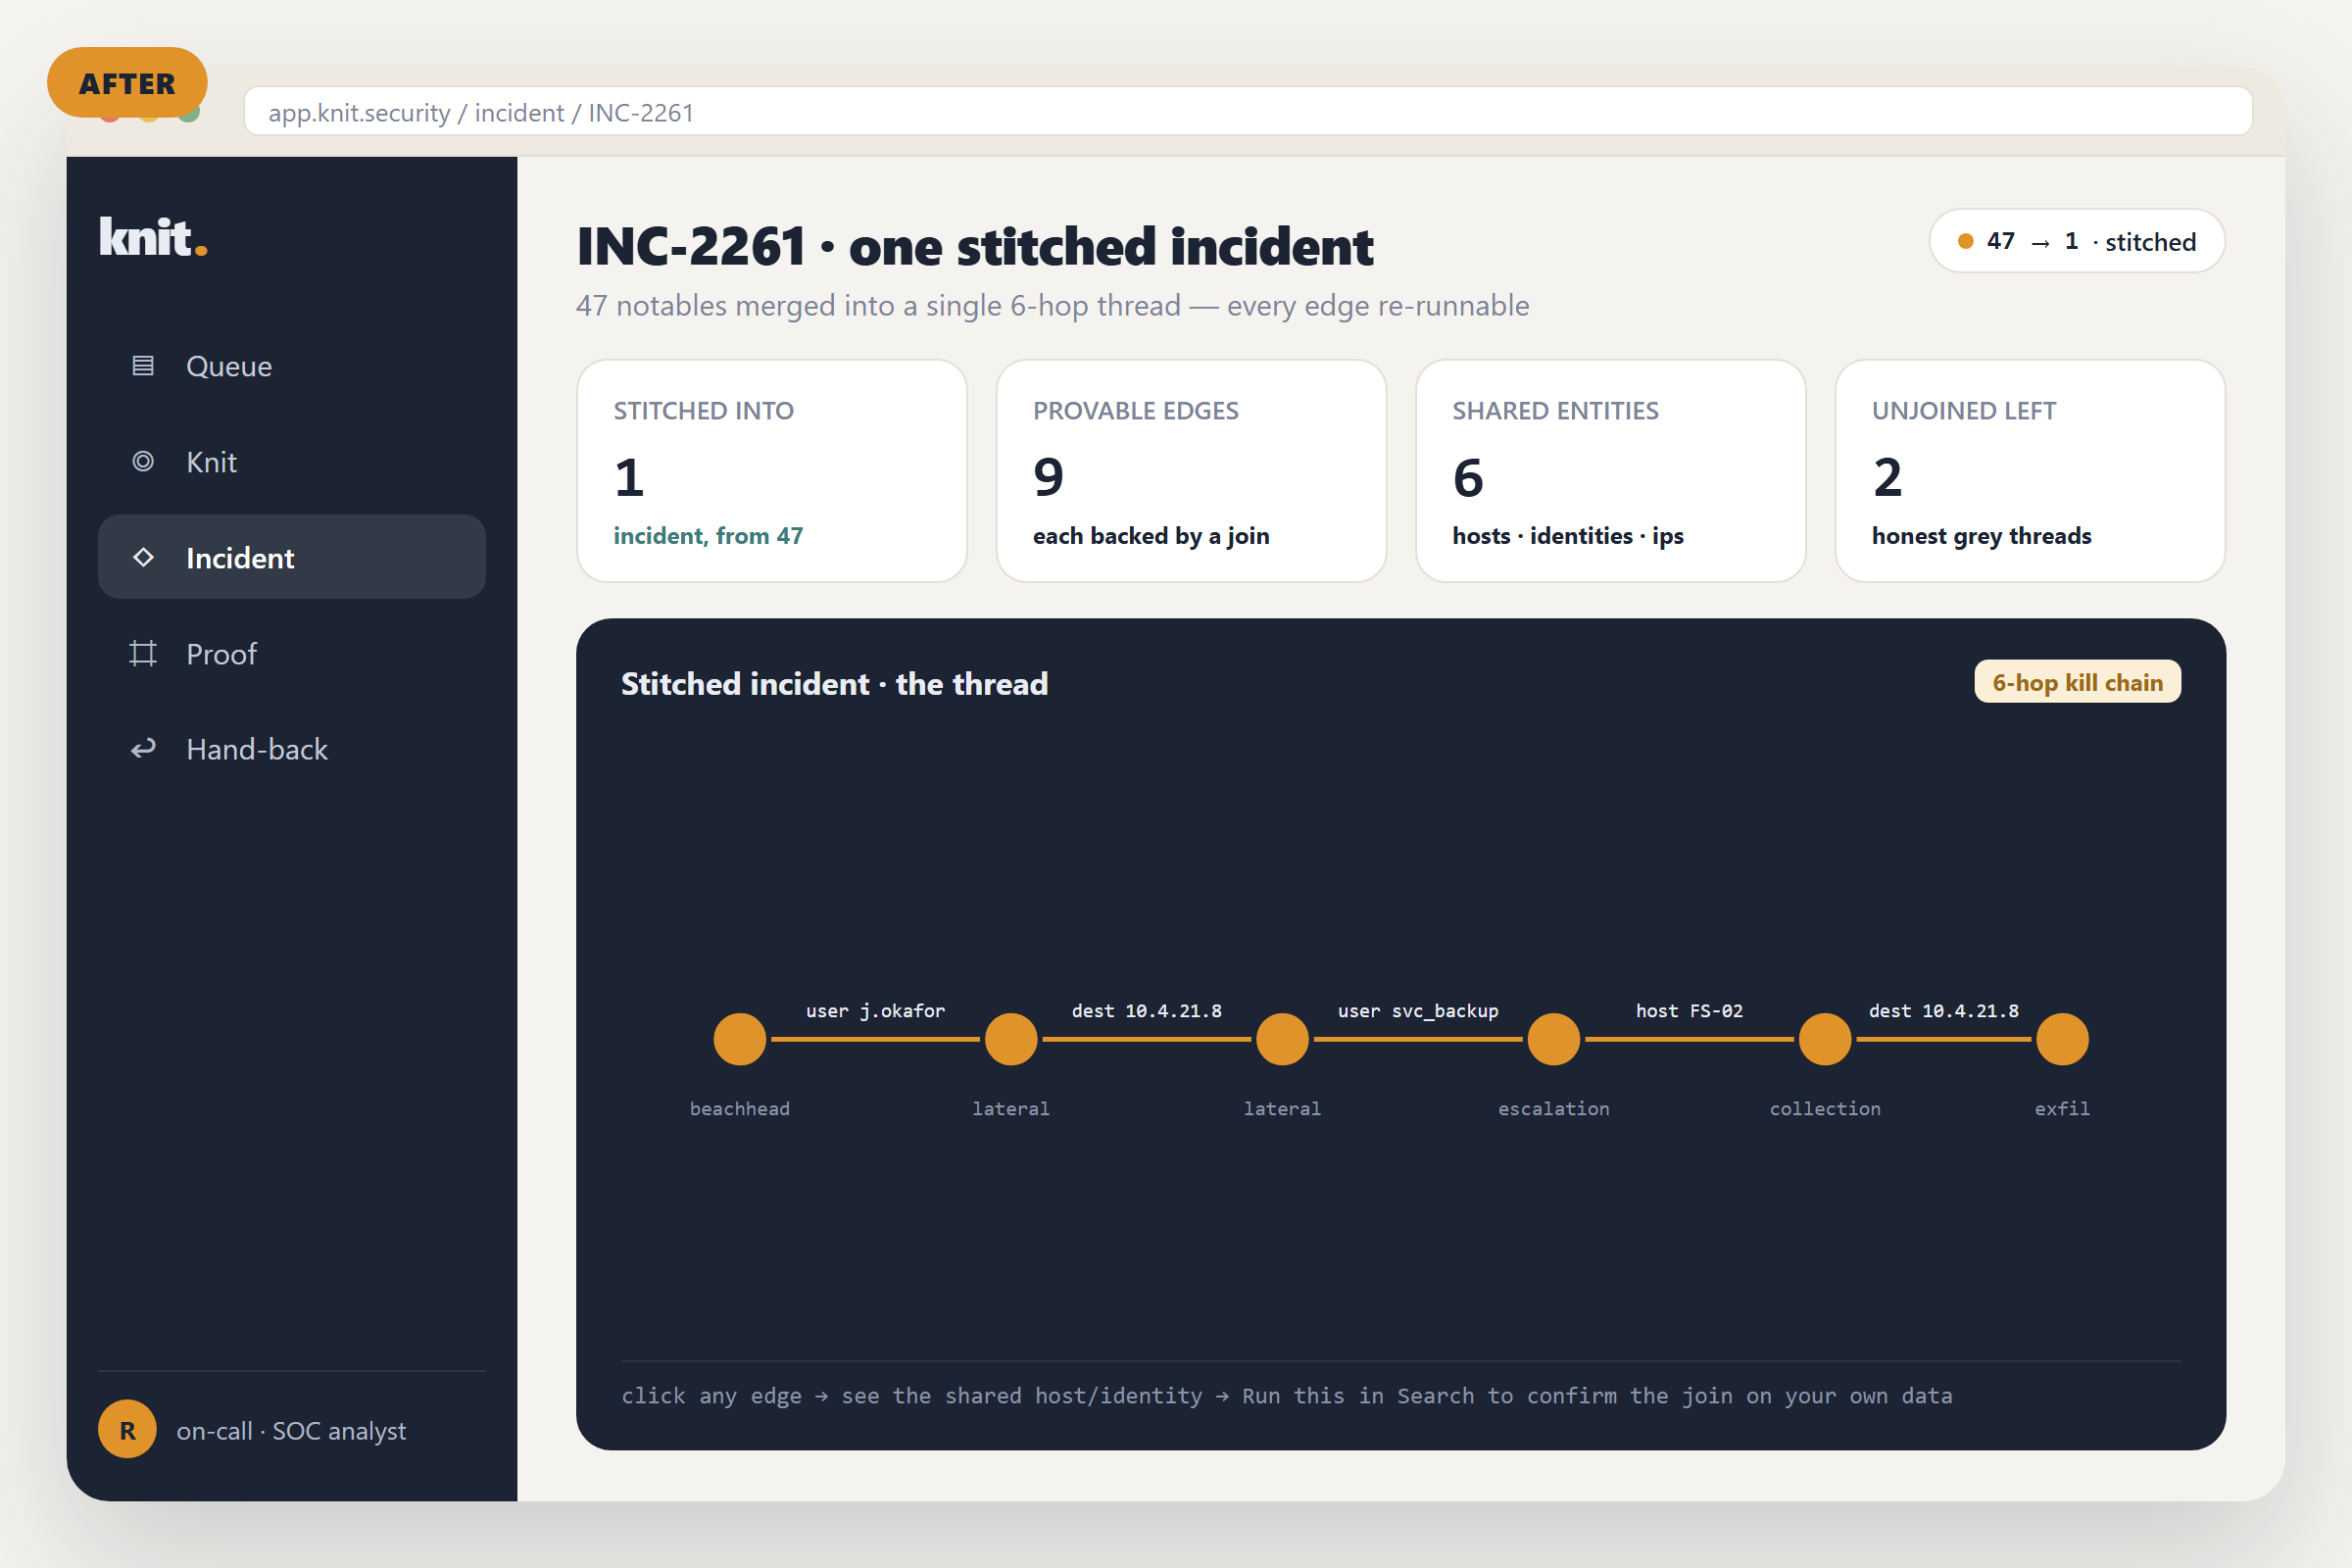
Backstop watches the watchers. It reads your real detections, works out what data each one needs to fire, and proves which ones have gone silently blind, computed from real timestamps and never asserted.
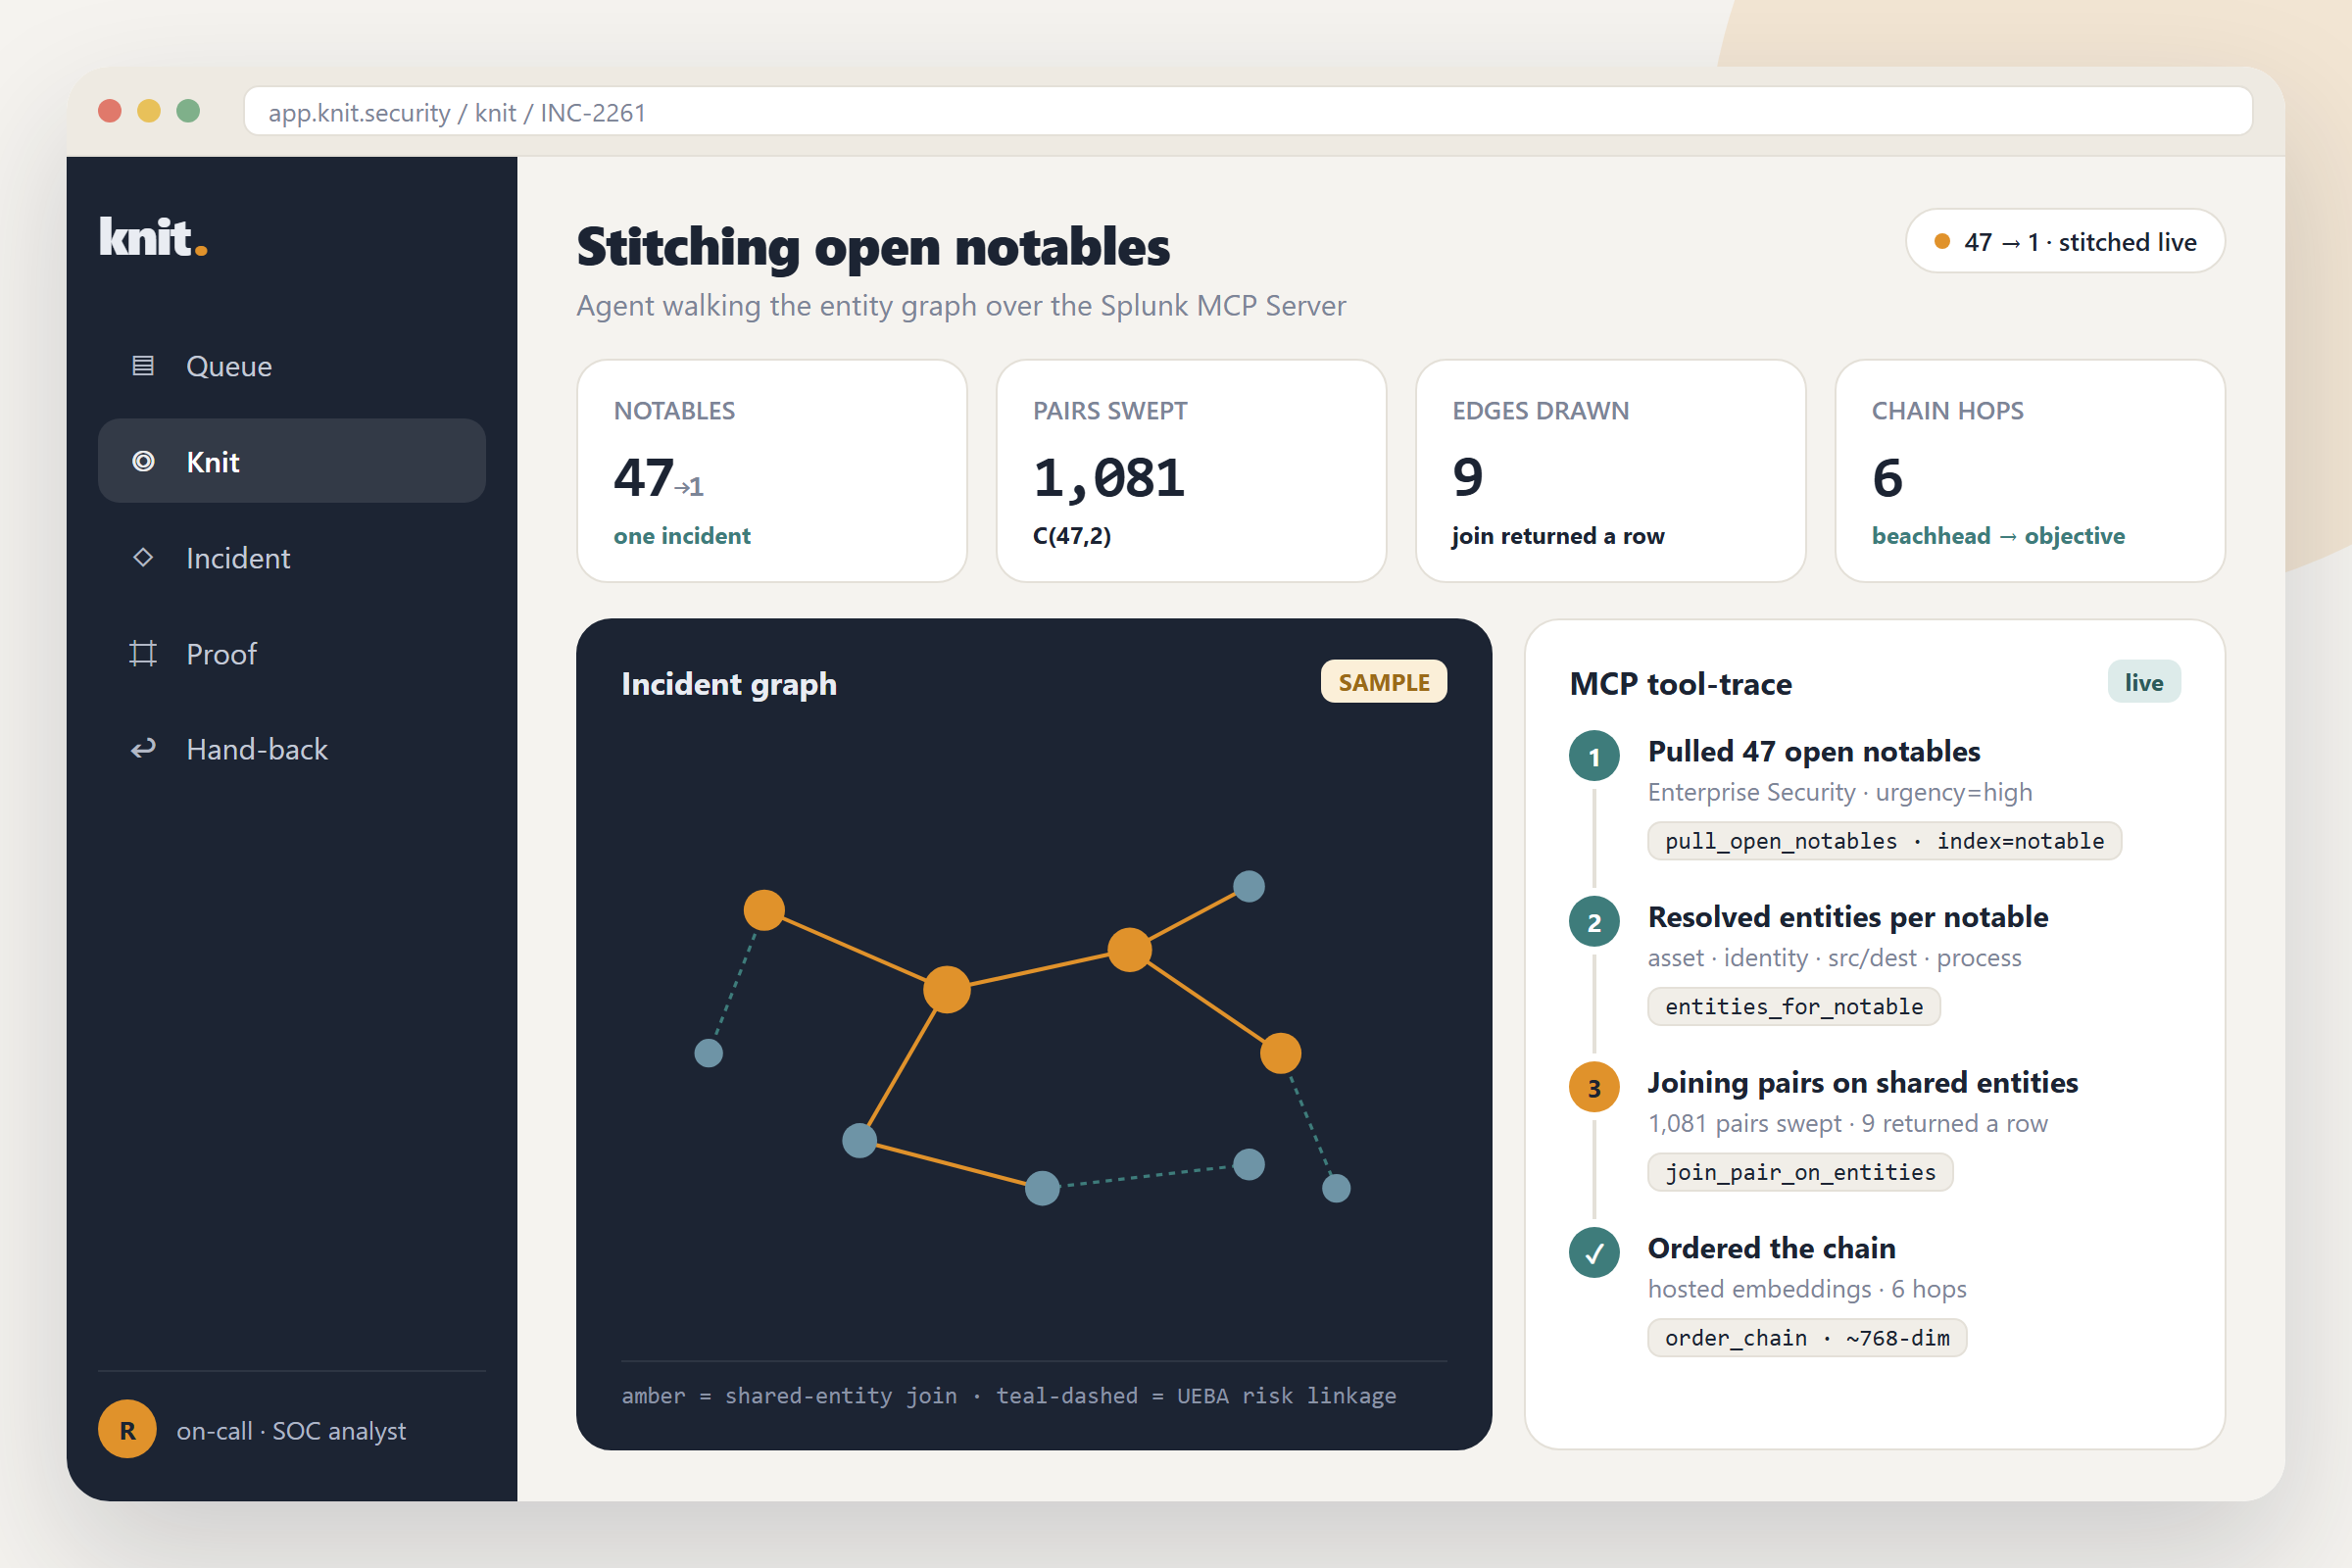
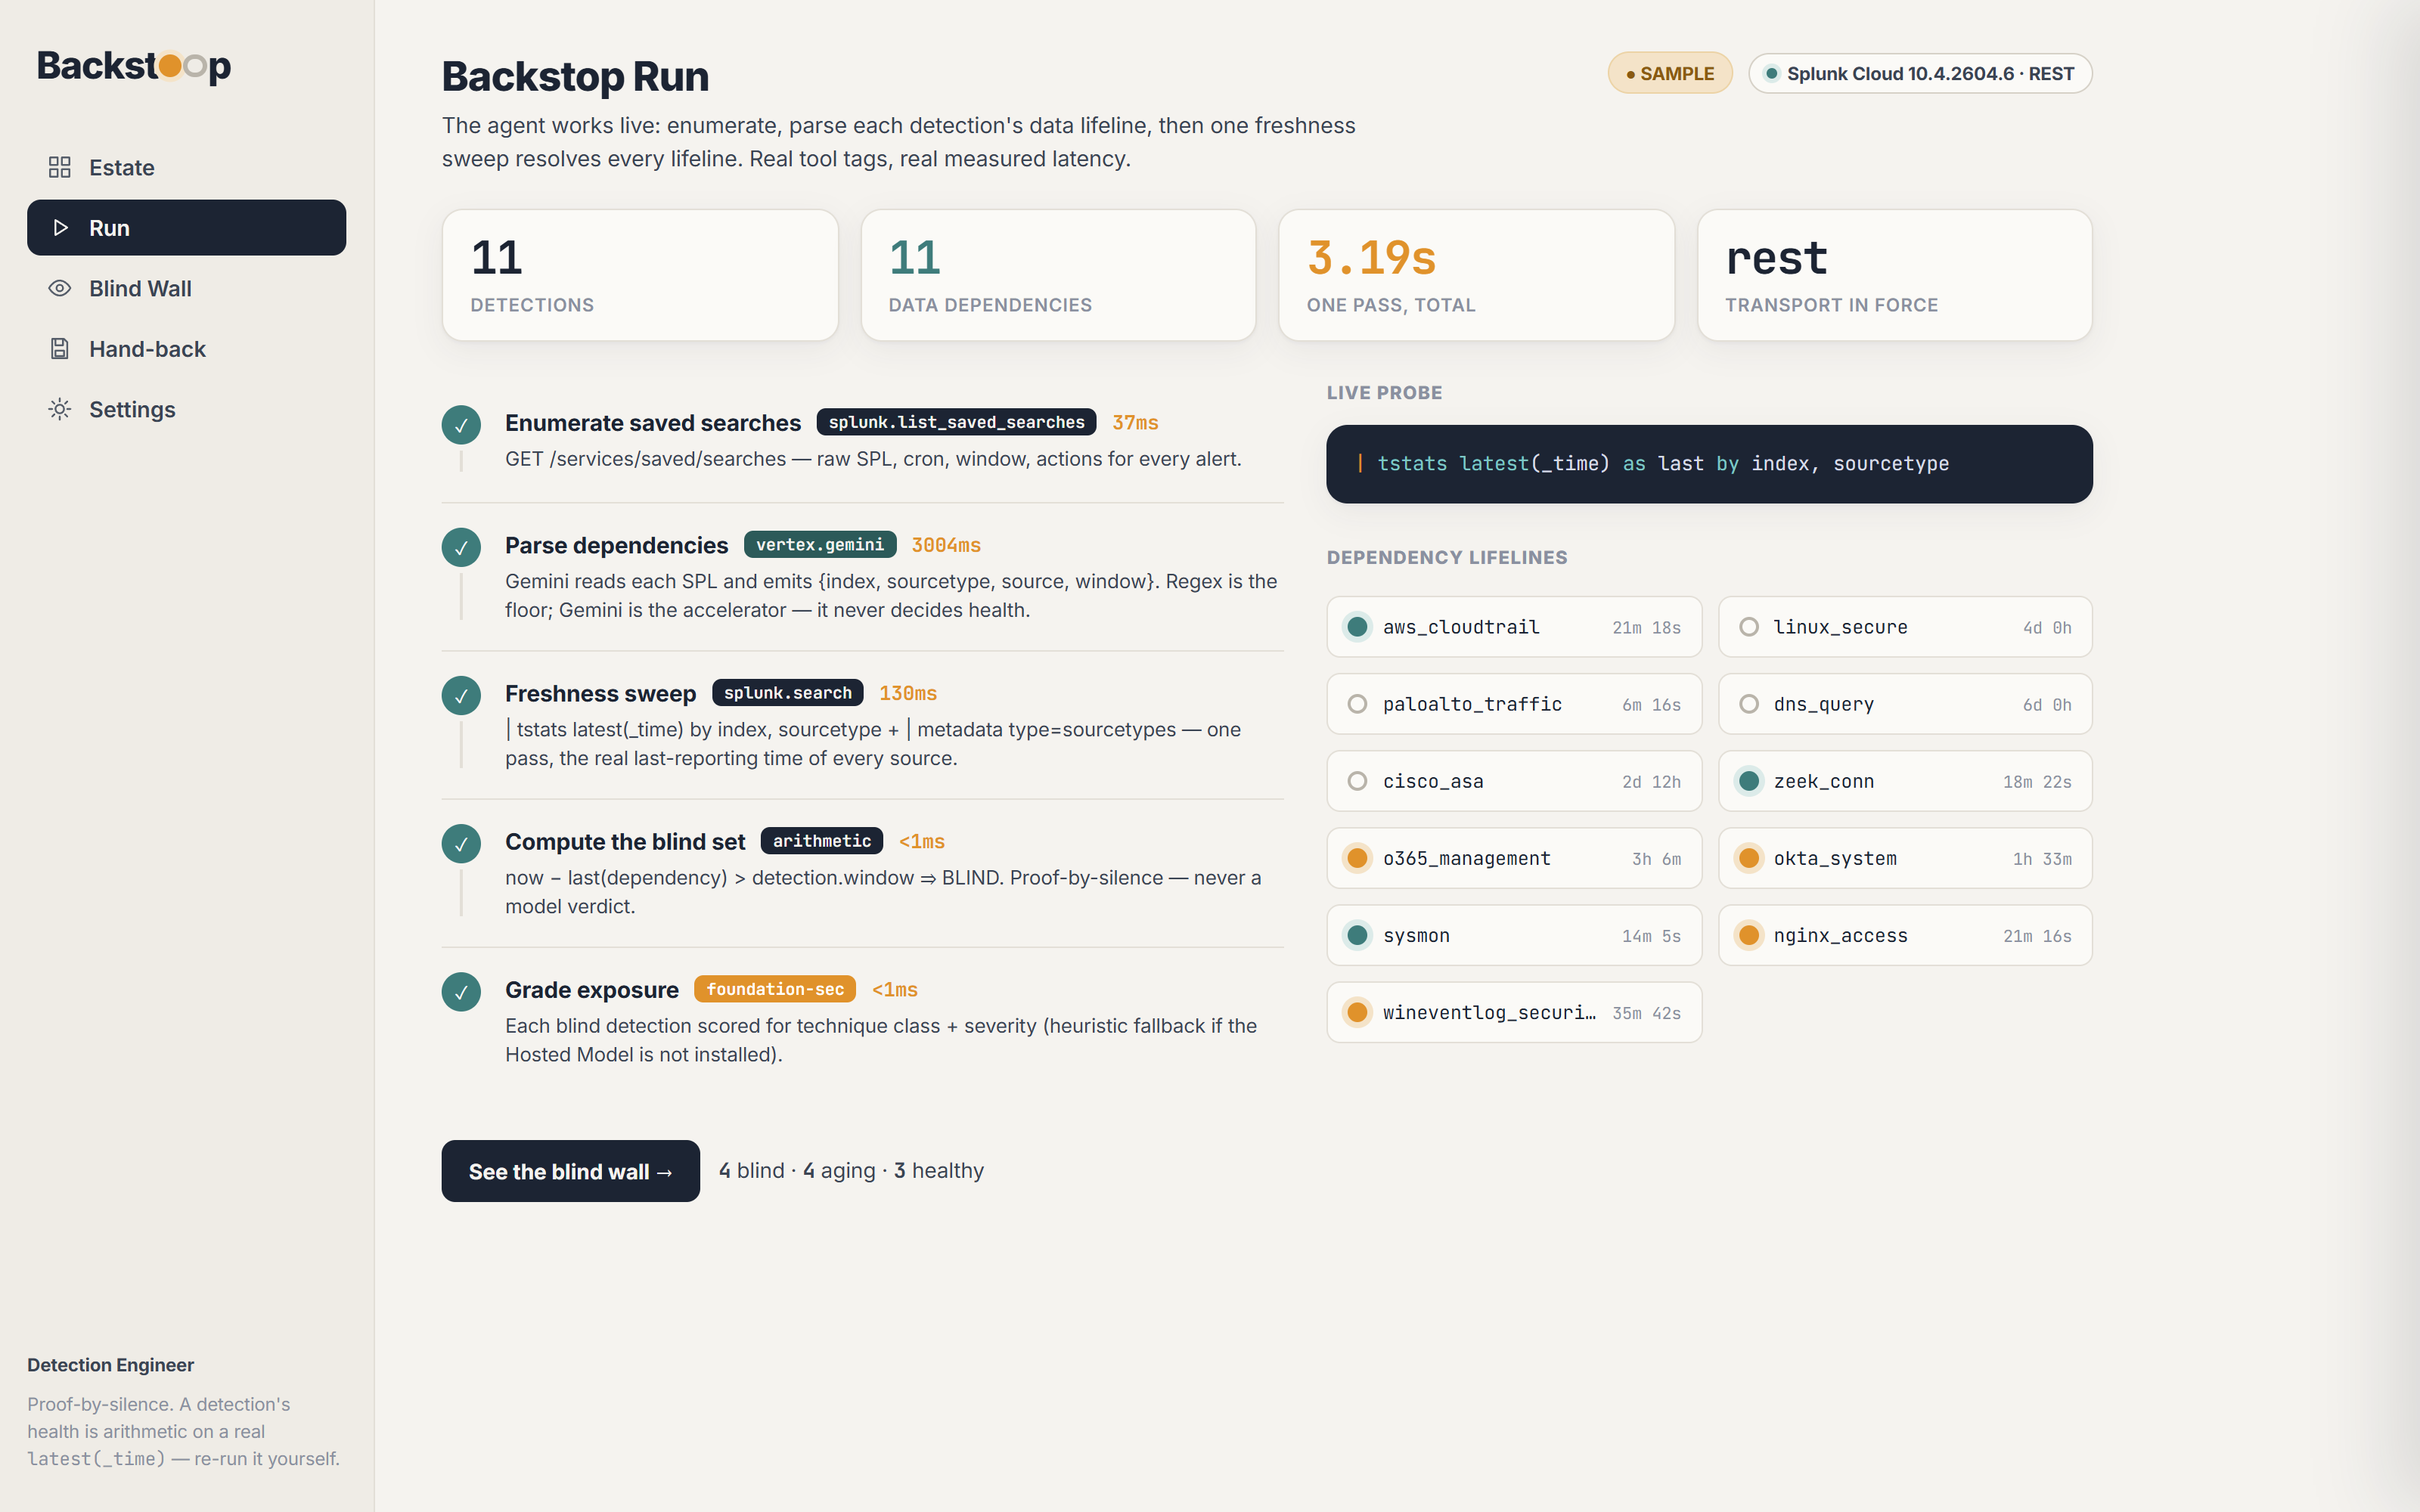
- Read the detection estate : point Backstop at your Splunk; over the 443 web-REST proxy the
agent lists every saved search via
GET /services/saved/searchesand pulls the raw SPL of each. It needs no Enterprise Security and no premium app, since these are core objects every Splunk already has. - Parse what each detection needs to fire : Gemini reads each detection's SPL and extracts its
data dependencies:
index,sourcetype,source, and the window it searches. That dependency set is the detection's lifeline. (A deterministic regex extractor is the floor and Gemini is the accelerator; Gemini never decides health.) - Probe which lifelines are alive : one pass of
| tstats latest(_time) as last by index, sourcetypeplus| metadata type=sourcetypesgets the real last-reporting timestamp of every data source across the whole estate. - Compute the blind set, proof-by-silence : pure arithmetic.
now − last(dependency) >
detection.window ⇒ BLIND
. A 4-hour detection whose sourcetype last reported 4 days ago can never have fired in-window. Healthy, aging (about to go blind), and blind are computed states, each derived from arithmetic. 0 health states exist without a reallatest(_time)behind them. - Rank the blind by exposure : each blind detection is graded for technique class + severity, so the output reads "your only credential-access detection has been blind 4 days" rather than "4 detections down."
- Hand it back : the coverage-gap map is written back into your own Splunk as a lookup
(
| outputlookup backstop_coverage.csv) and a scheduled Backstop — Coverage Gap Monitor saved search, so the meta-monitoring survives outside the app.
How I built it
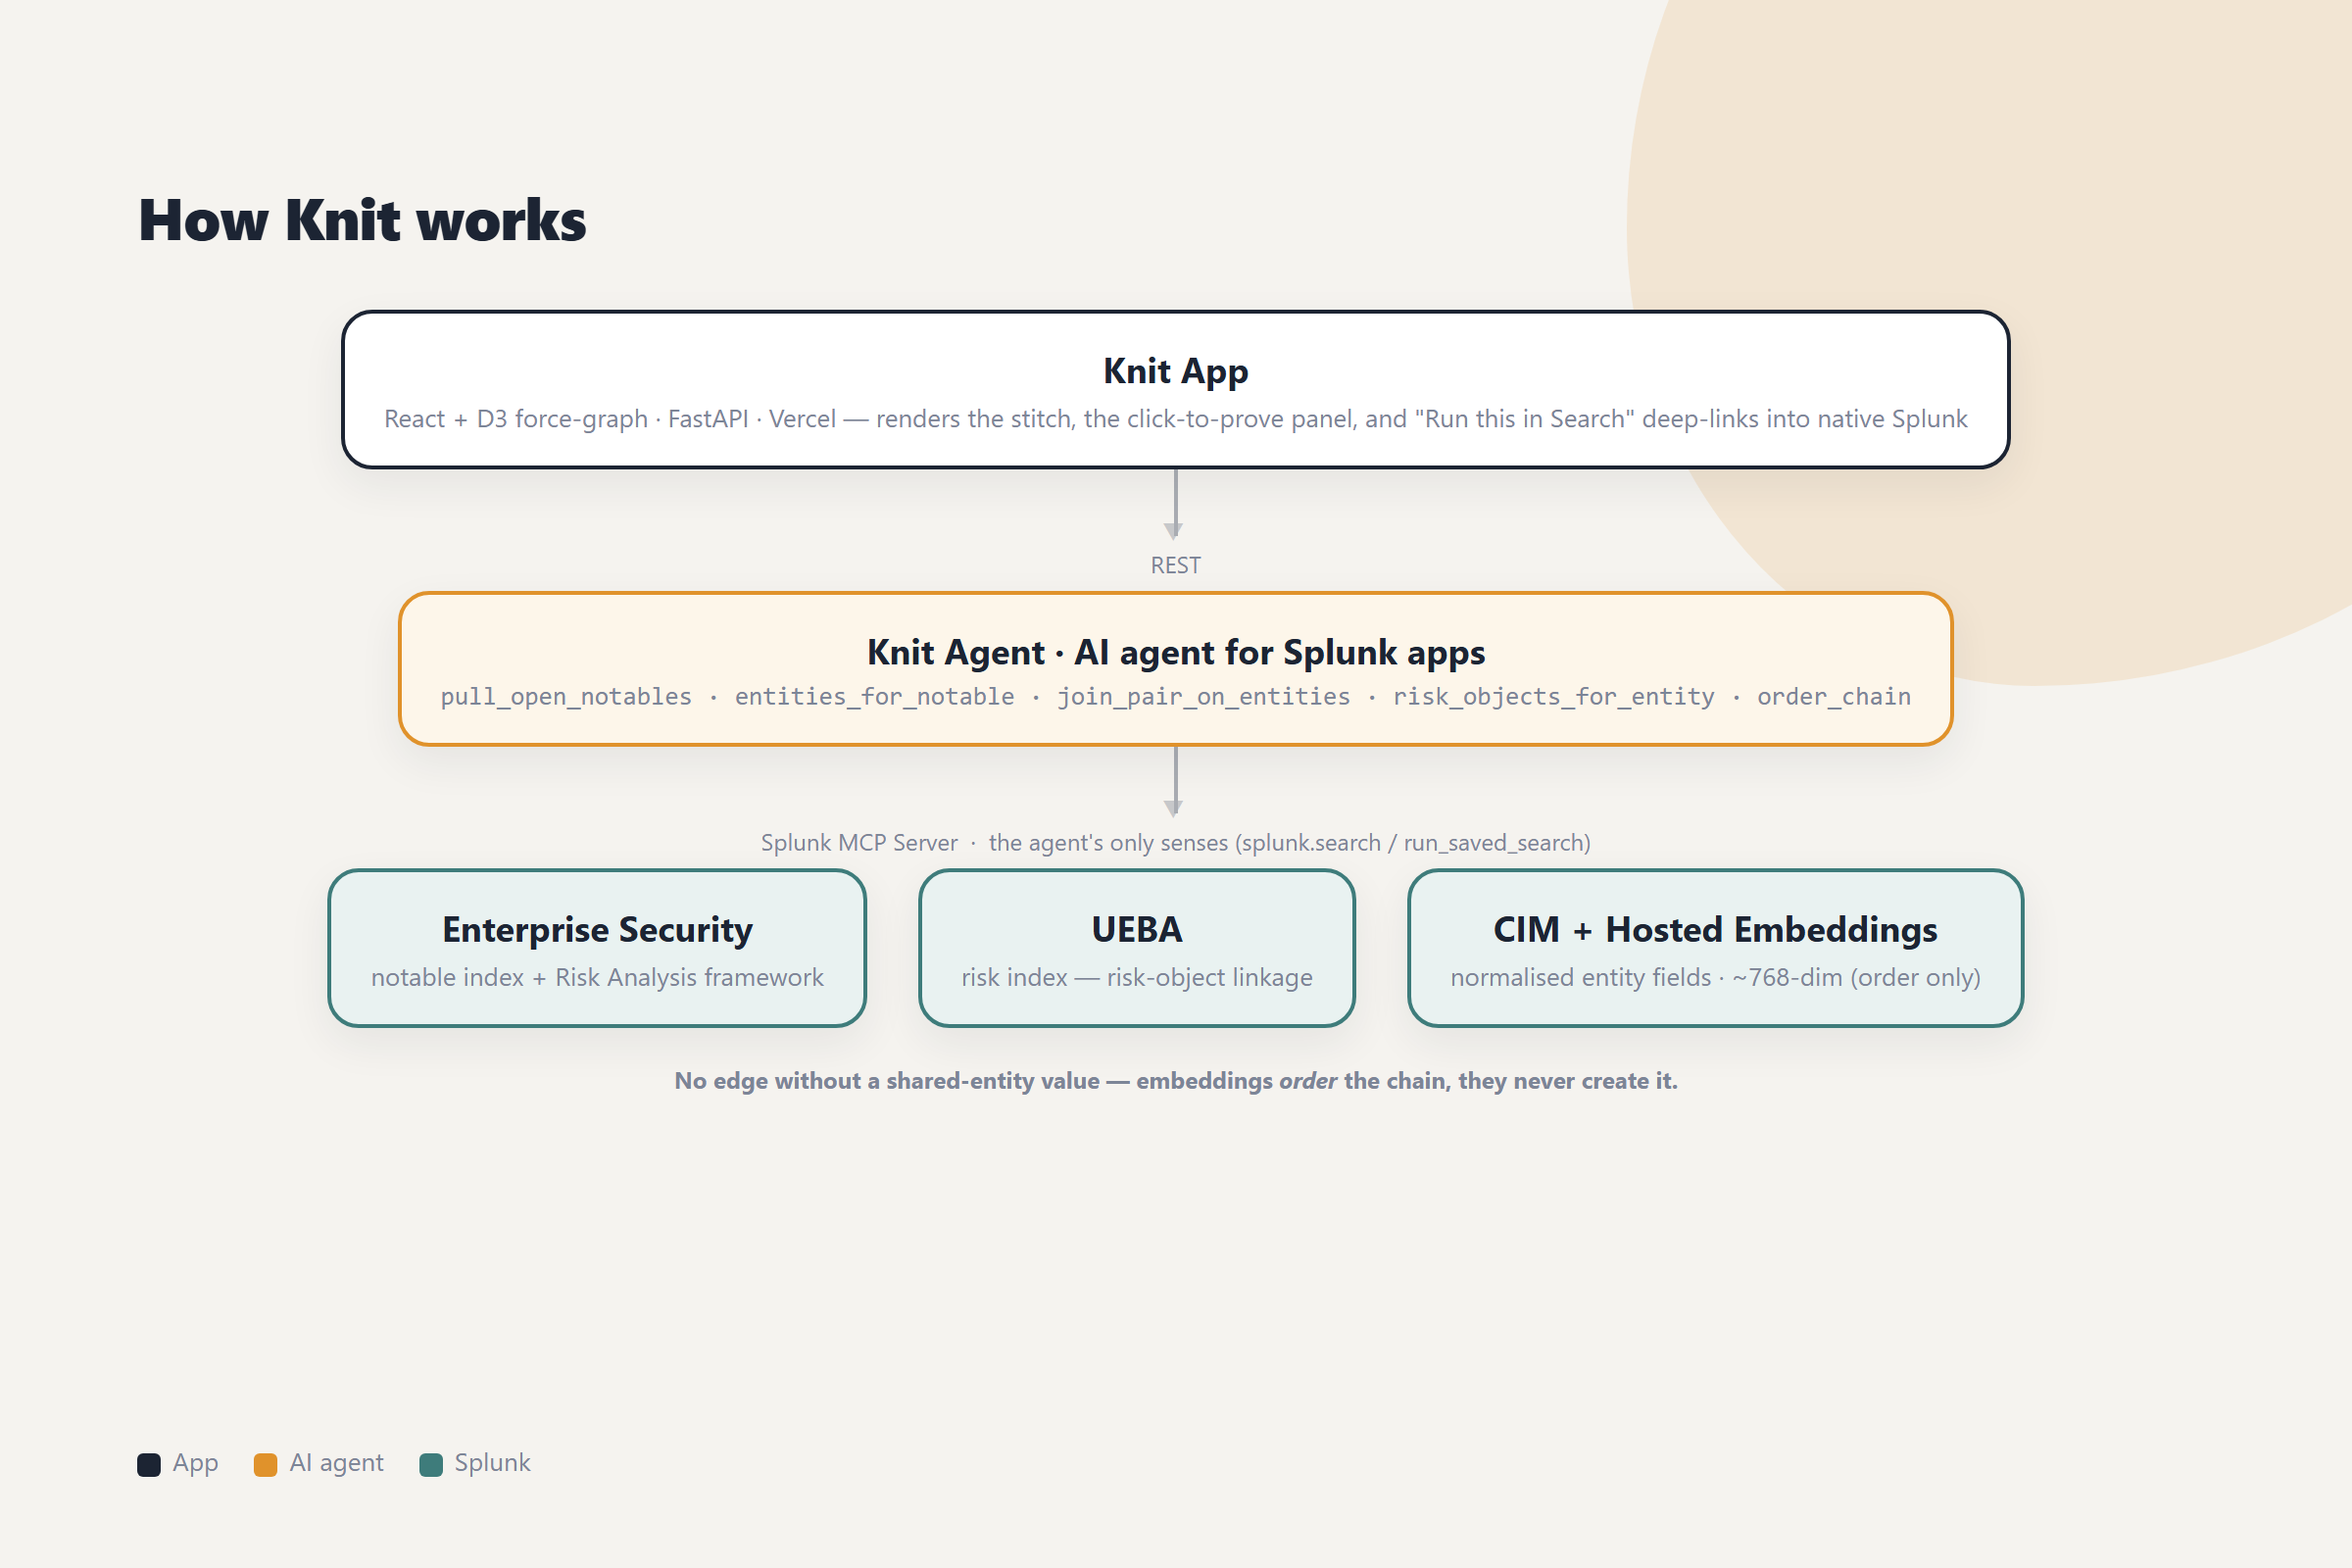
The architecture (full diagram: architecture.png in the repo root). A single Next.js (App
Router) app on Vercel. Every Splunk and Gemini call happens in server-side API routes, so no
secret ever reaches the browser and the client only ever talks to its own relative /api/* routes.
The senses are core Splunk REST + SPL. A from-scratch Splunk client authenticates with a web
session login over the 443 proxy (/splunkd/__raw/services/...); it never touches the 8089 mgmt
port or ACS, which is why it works against a locked-down Cloud trial and from a deployed backend
(443 is public). On top sit the agent's named tools: splunk.list_saved_searches, splunk.search,
splunk.freshness_sweep. When the official Splunk MCP Server (app 7931, /services/mcp) is
installed, splunk.search routes through MCP tools/call; when it isn't, the identical searches run
over the REST proxy. The senses stay the same and only the transport changes, and the UI always shows
which mode is in force.
Gemini is the reasoning brain, and it's bounded. The agent reasons with Gemini
(gemini-flash-latest) on Vertex AI, authenticated with a self-signed service-account JWT (zero
npm deps) against the :generateContent endpoint, and it reads the SA either from a key file
(local / Cloud Run) or inline from an env var so it runs on Vercel with no filesystem key. Gemini's
only job is SPL → dependency set. It never decides health; strip it out (regex-only mode) and the
map still computes.
Health is arithmetic; exposure is advisory, and they're kept apart. The blind/aging/healthy
fact is now − last(dependency) > window. The Foundation-sec security Hosted Model grades the
severity when present, and a transparent cron-tightness + alert-action + auth/privilege-category
heuristic grades it when the model is absent, with every badge stamped heuristic so the mode stays
visible.
Measured, off the live deployed run (real REST + SPL, never estimated):
- enumerate + pull SPL: ~0.06 s · Gemini dependency parse: ~3.2 s · freshness sweep
(
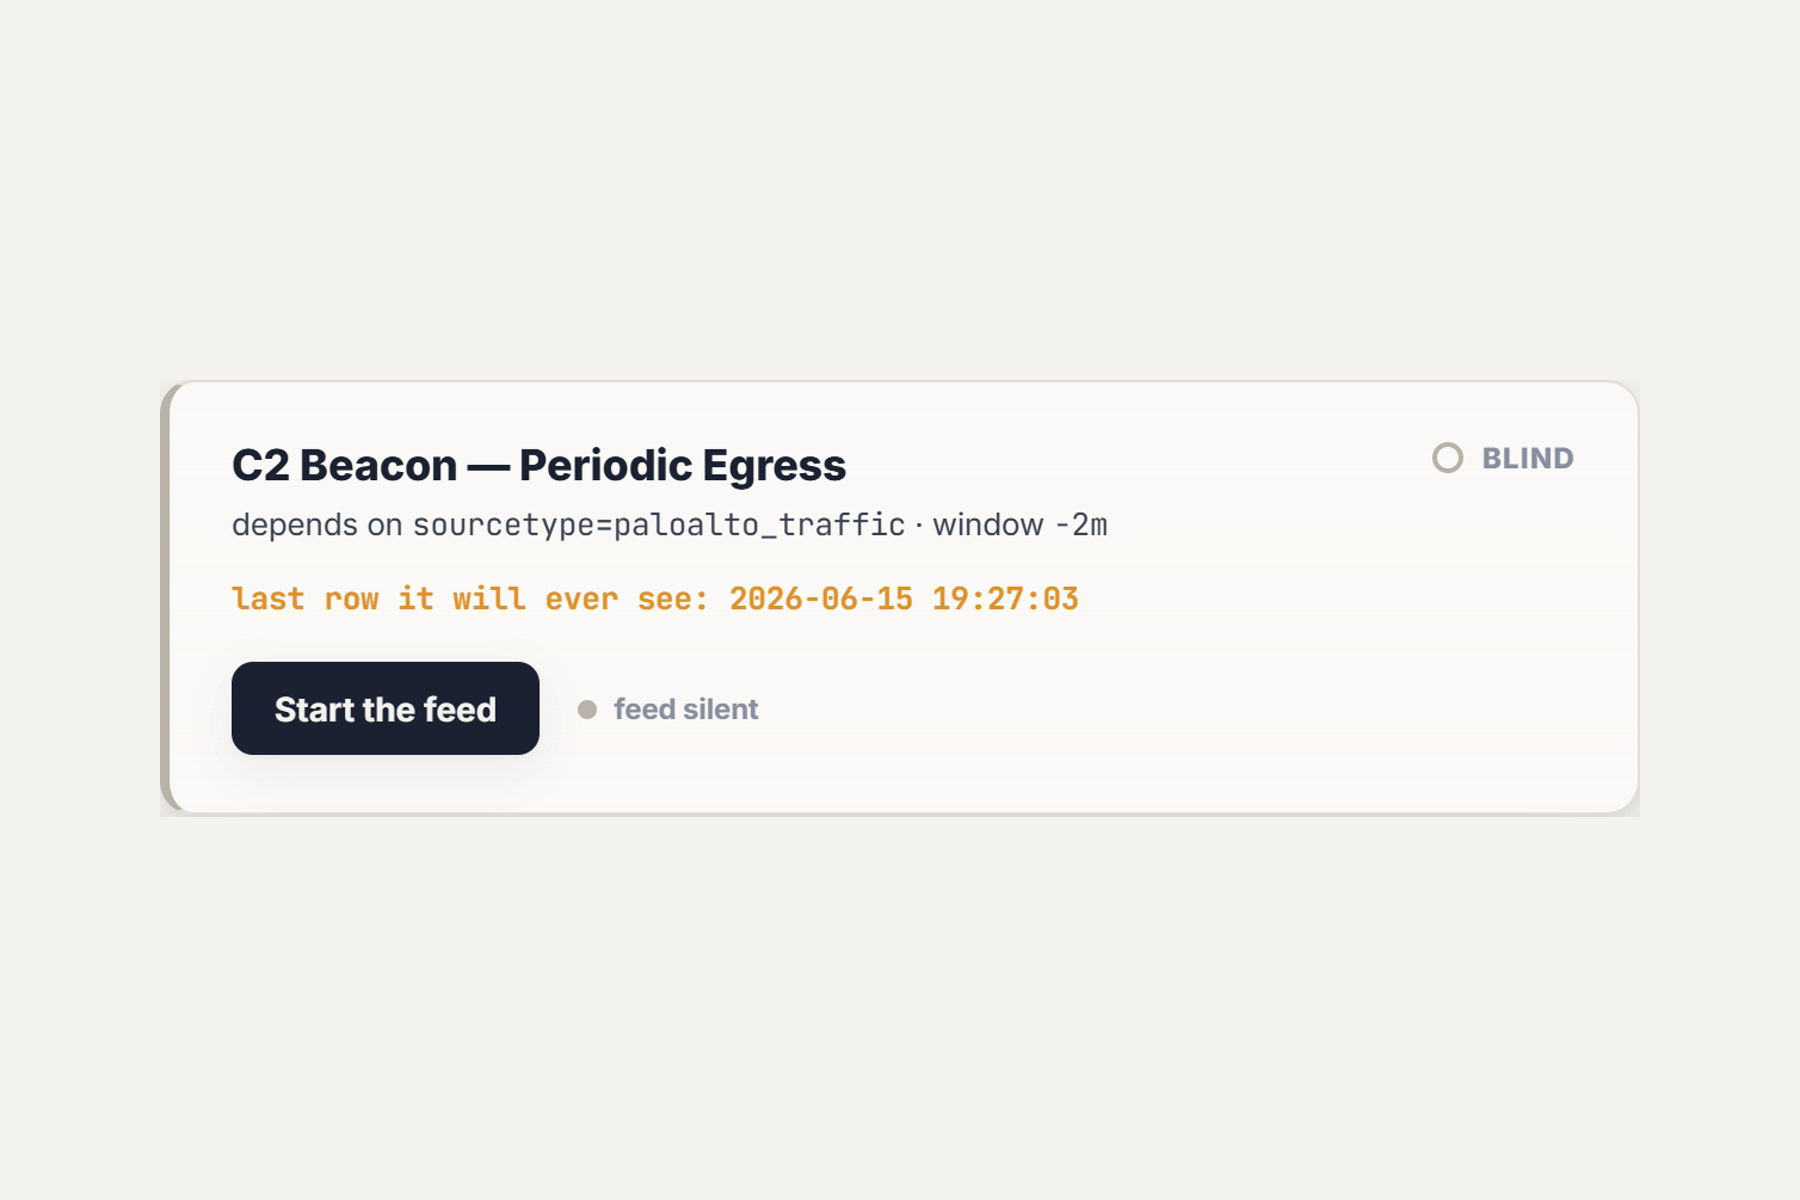
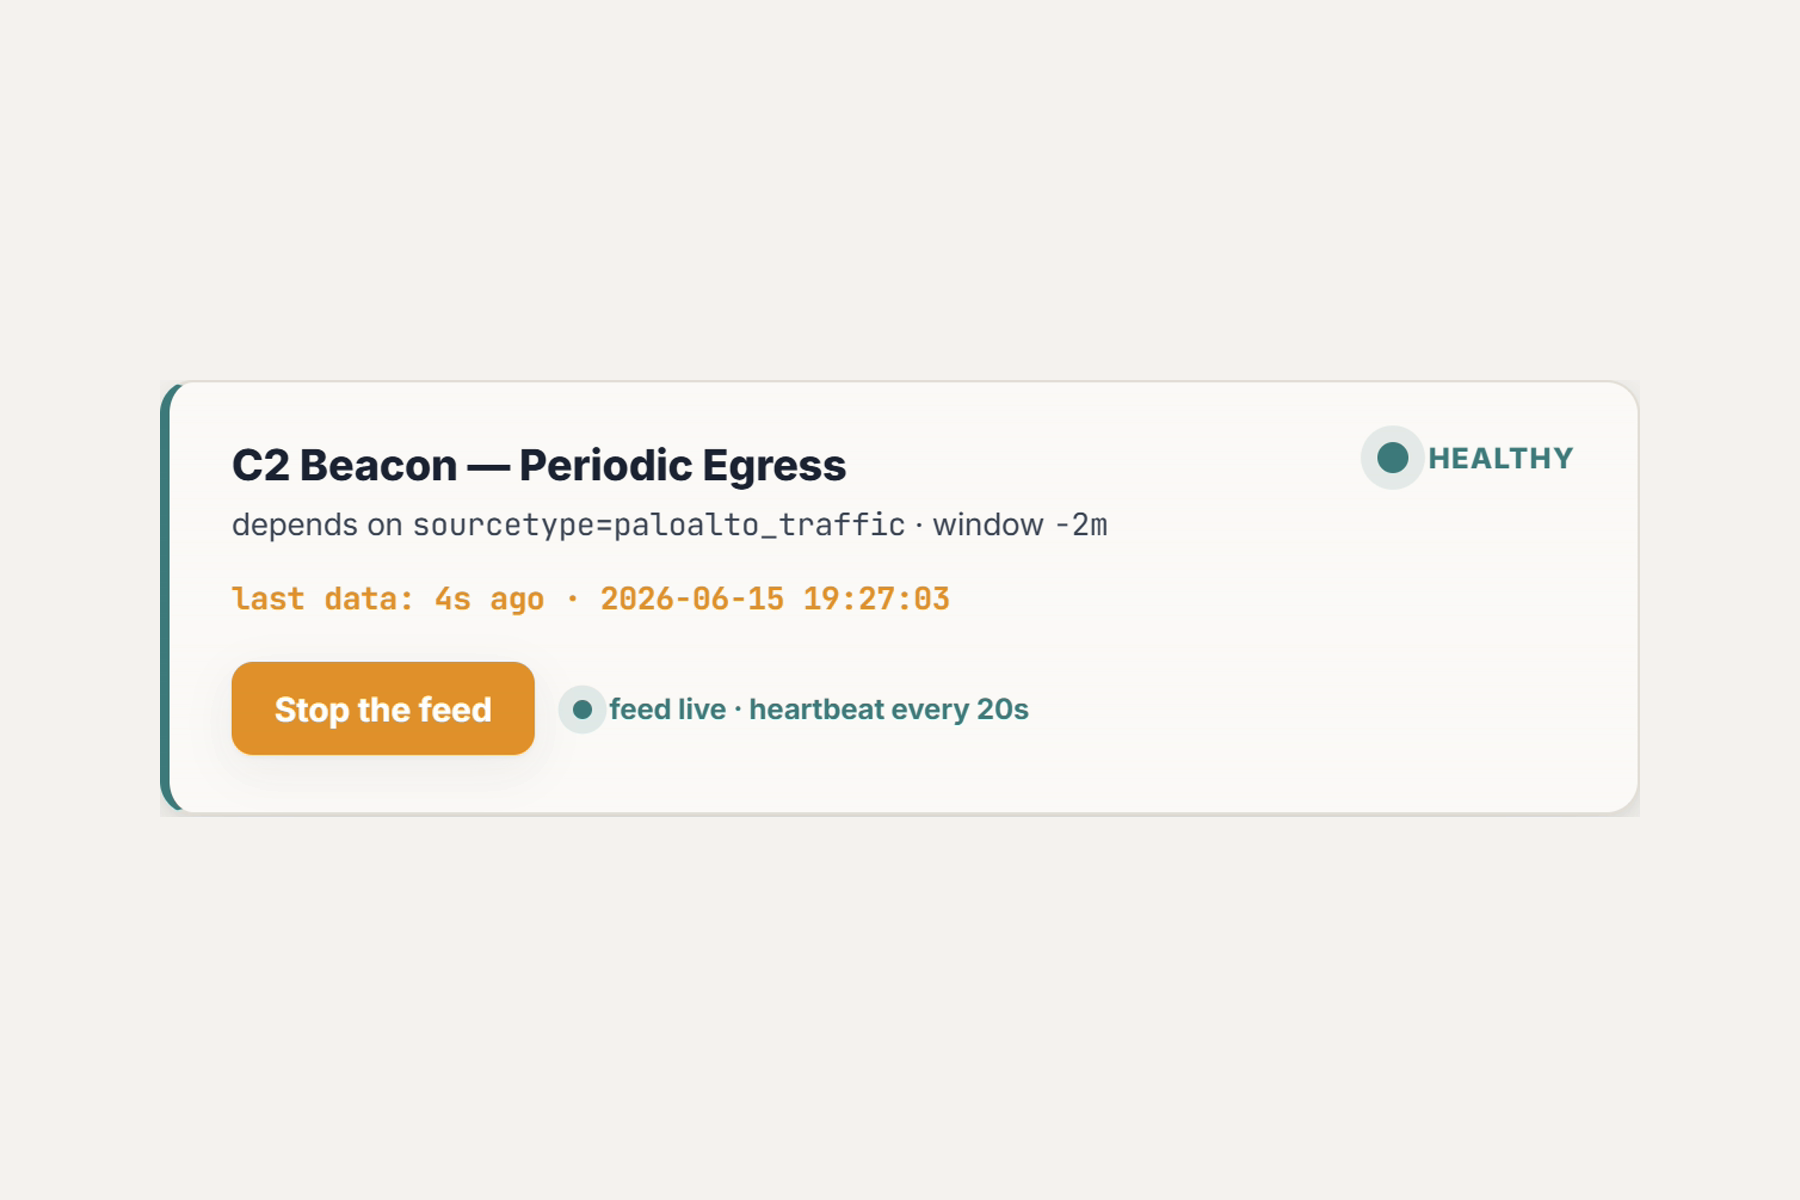
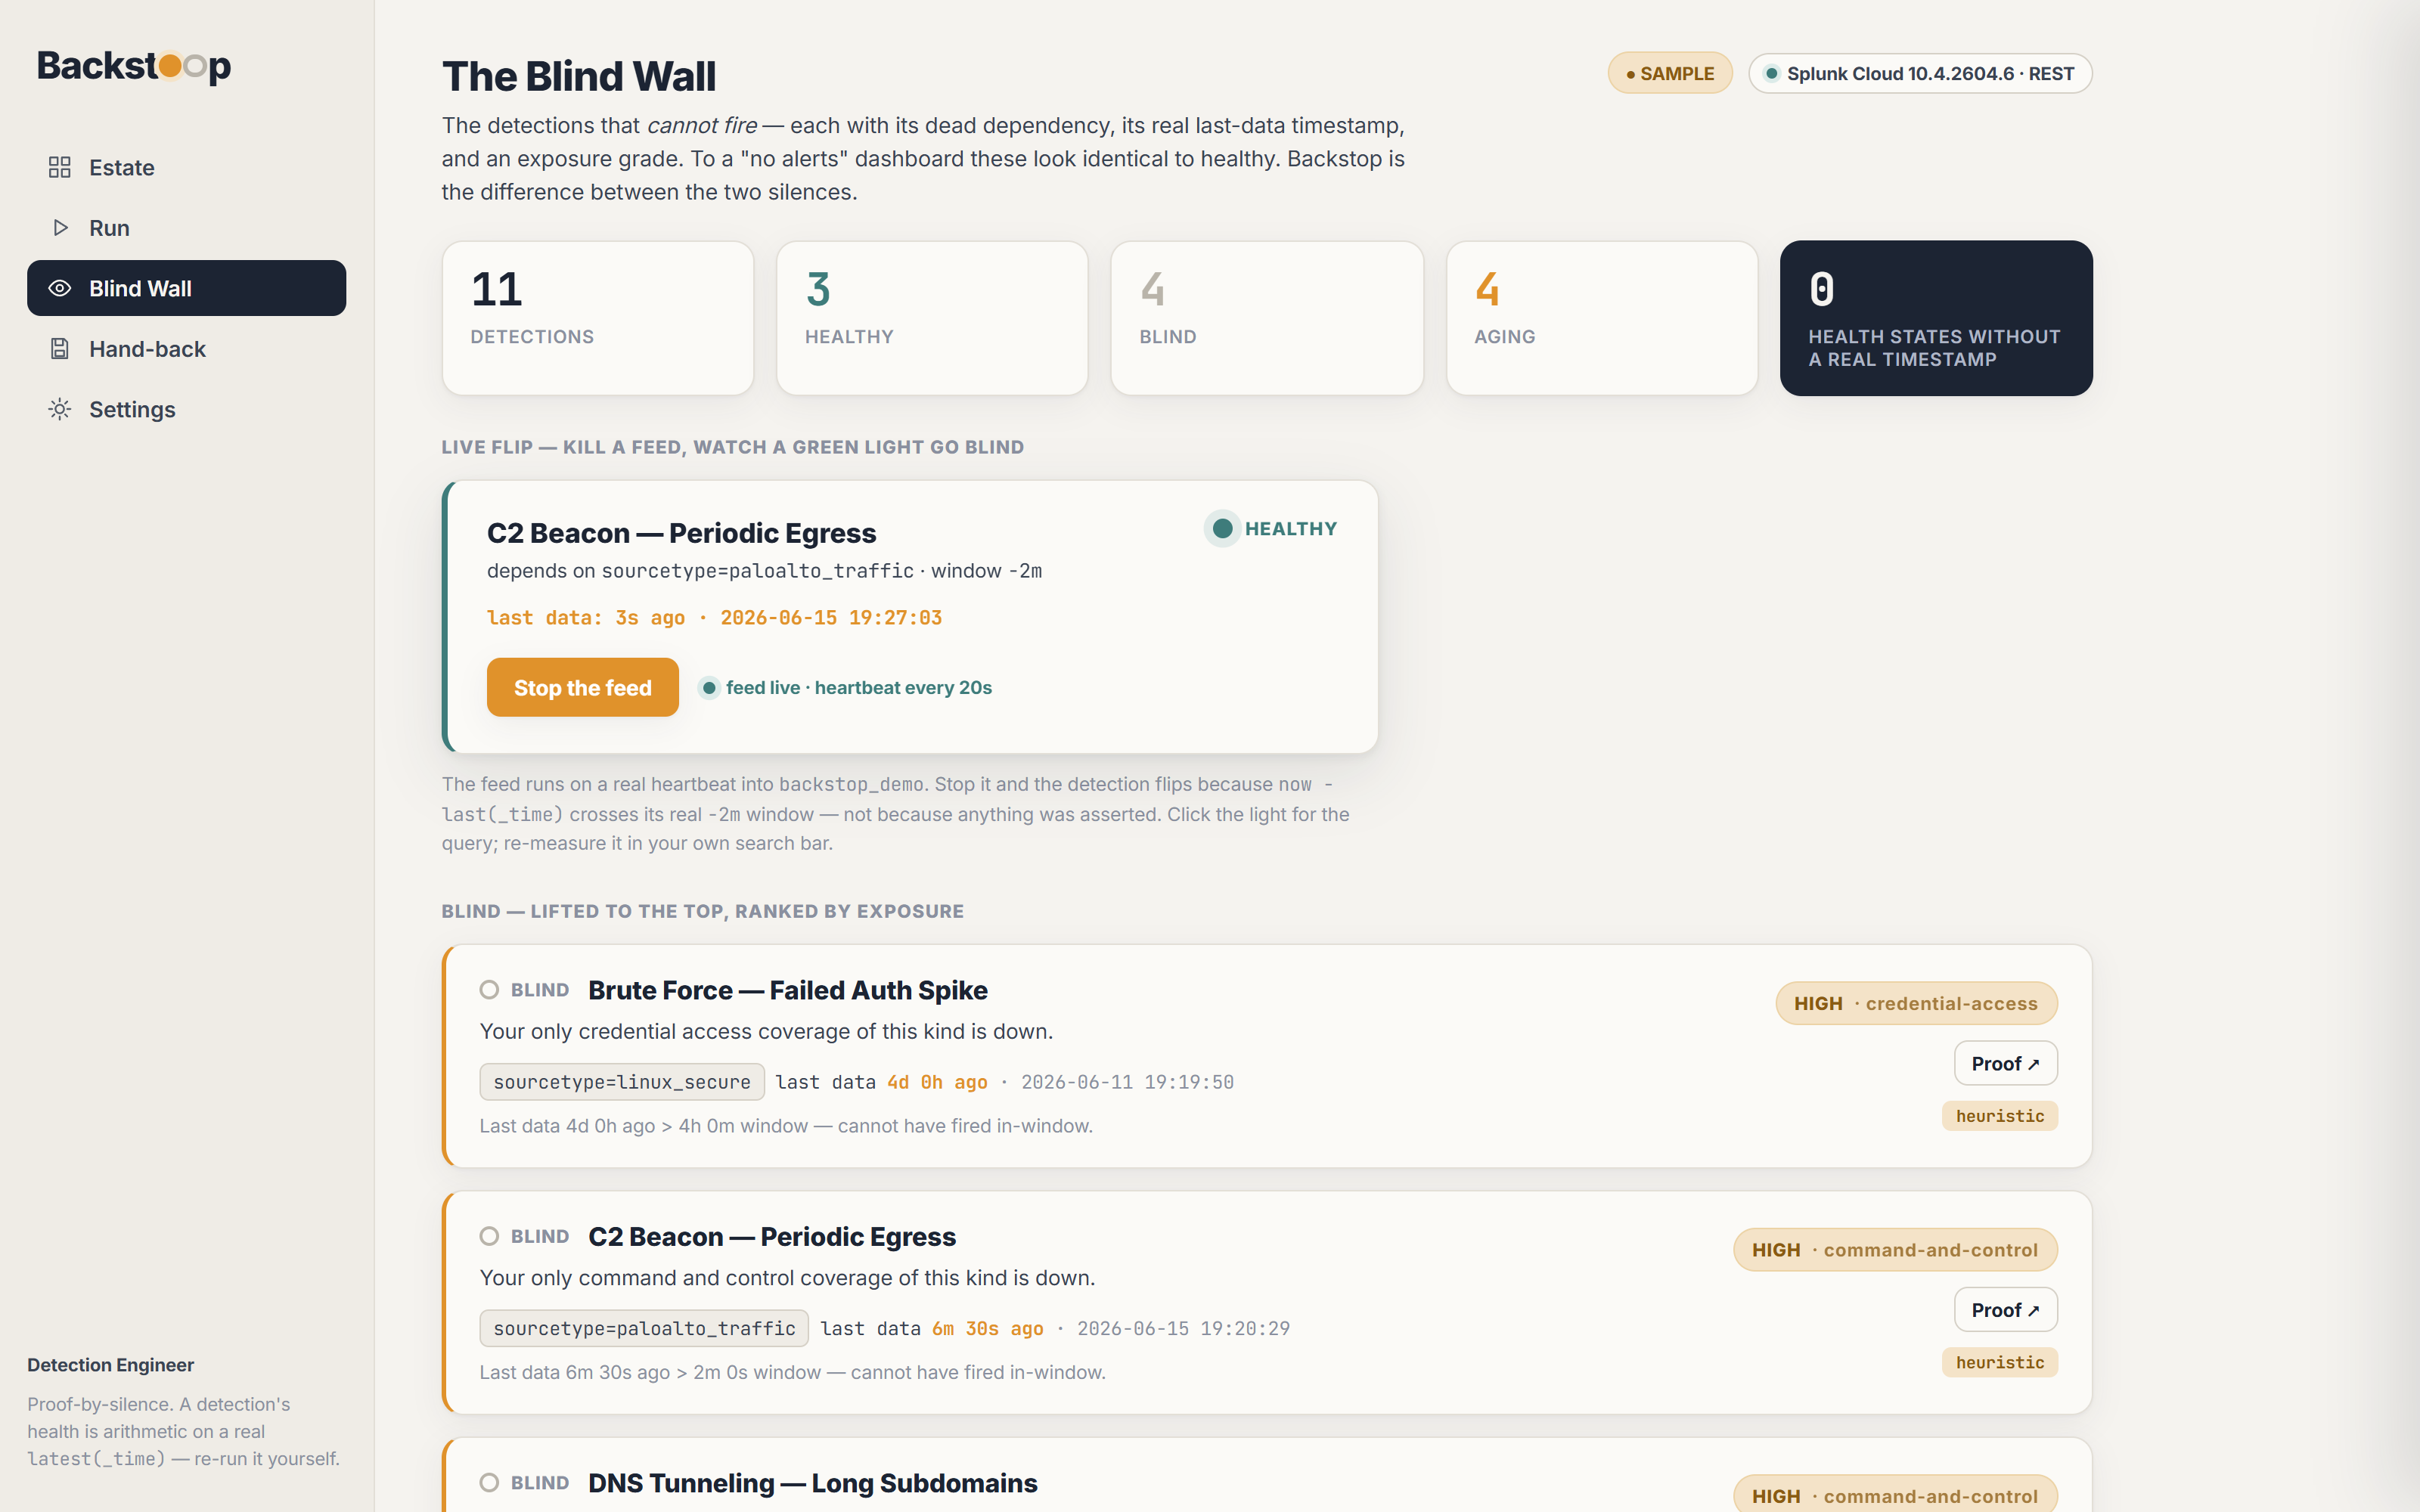
tstats+metadata, one pass): ~0.12 s · exposure grade: <5 ms. - a clean run: 6 healthy · 2 aging · 3 blind · 0 health states without a real timestamp; that zero is the flex.
- live feed-stop flips the C2-beacon detection from green to BLIND as
now − lastcrosses its real-2mwindow, in ~2 minutes of wall clock, stamped with the exact last_time.
Challenges I ran into
- Problem: a model will happily call a dead detection "healthy." → Solution: I forbade the
model from ever deciding health. Health is arithmetic on a
tstatsrow; Gemini only parses SPL, Foundation-sec only grades severity. That single constraint makes "proof-by-silence" structurally true. - Problem: "is it down?" and "how bad is it?" are different kinds of claim. → Solution: I split them on screen. The blind/healthy fact (a real timestamp) sits visually separate from the exposure opinion (a grade) so a model's advisory grade can never masquerade as the verdict.
- Problem: a 443-only Cloud trial with 8089 firewalled, ACS dead, and no key file on Vercel. → Solution: a web-session REST client over 443 for Splunk, and a service-account JWT that reads its credentials inline from an env var, so the exact same code path runs genuinely live both locally and on the deployed URL.
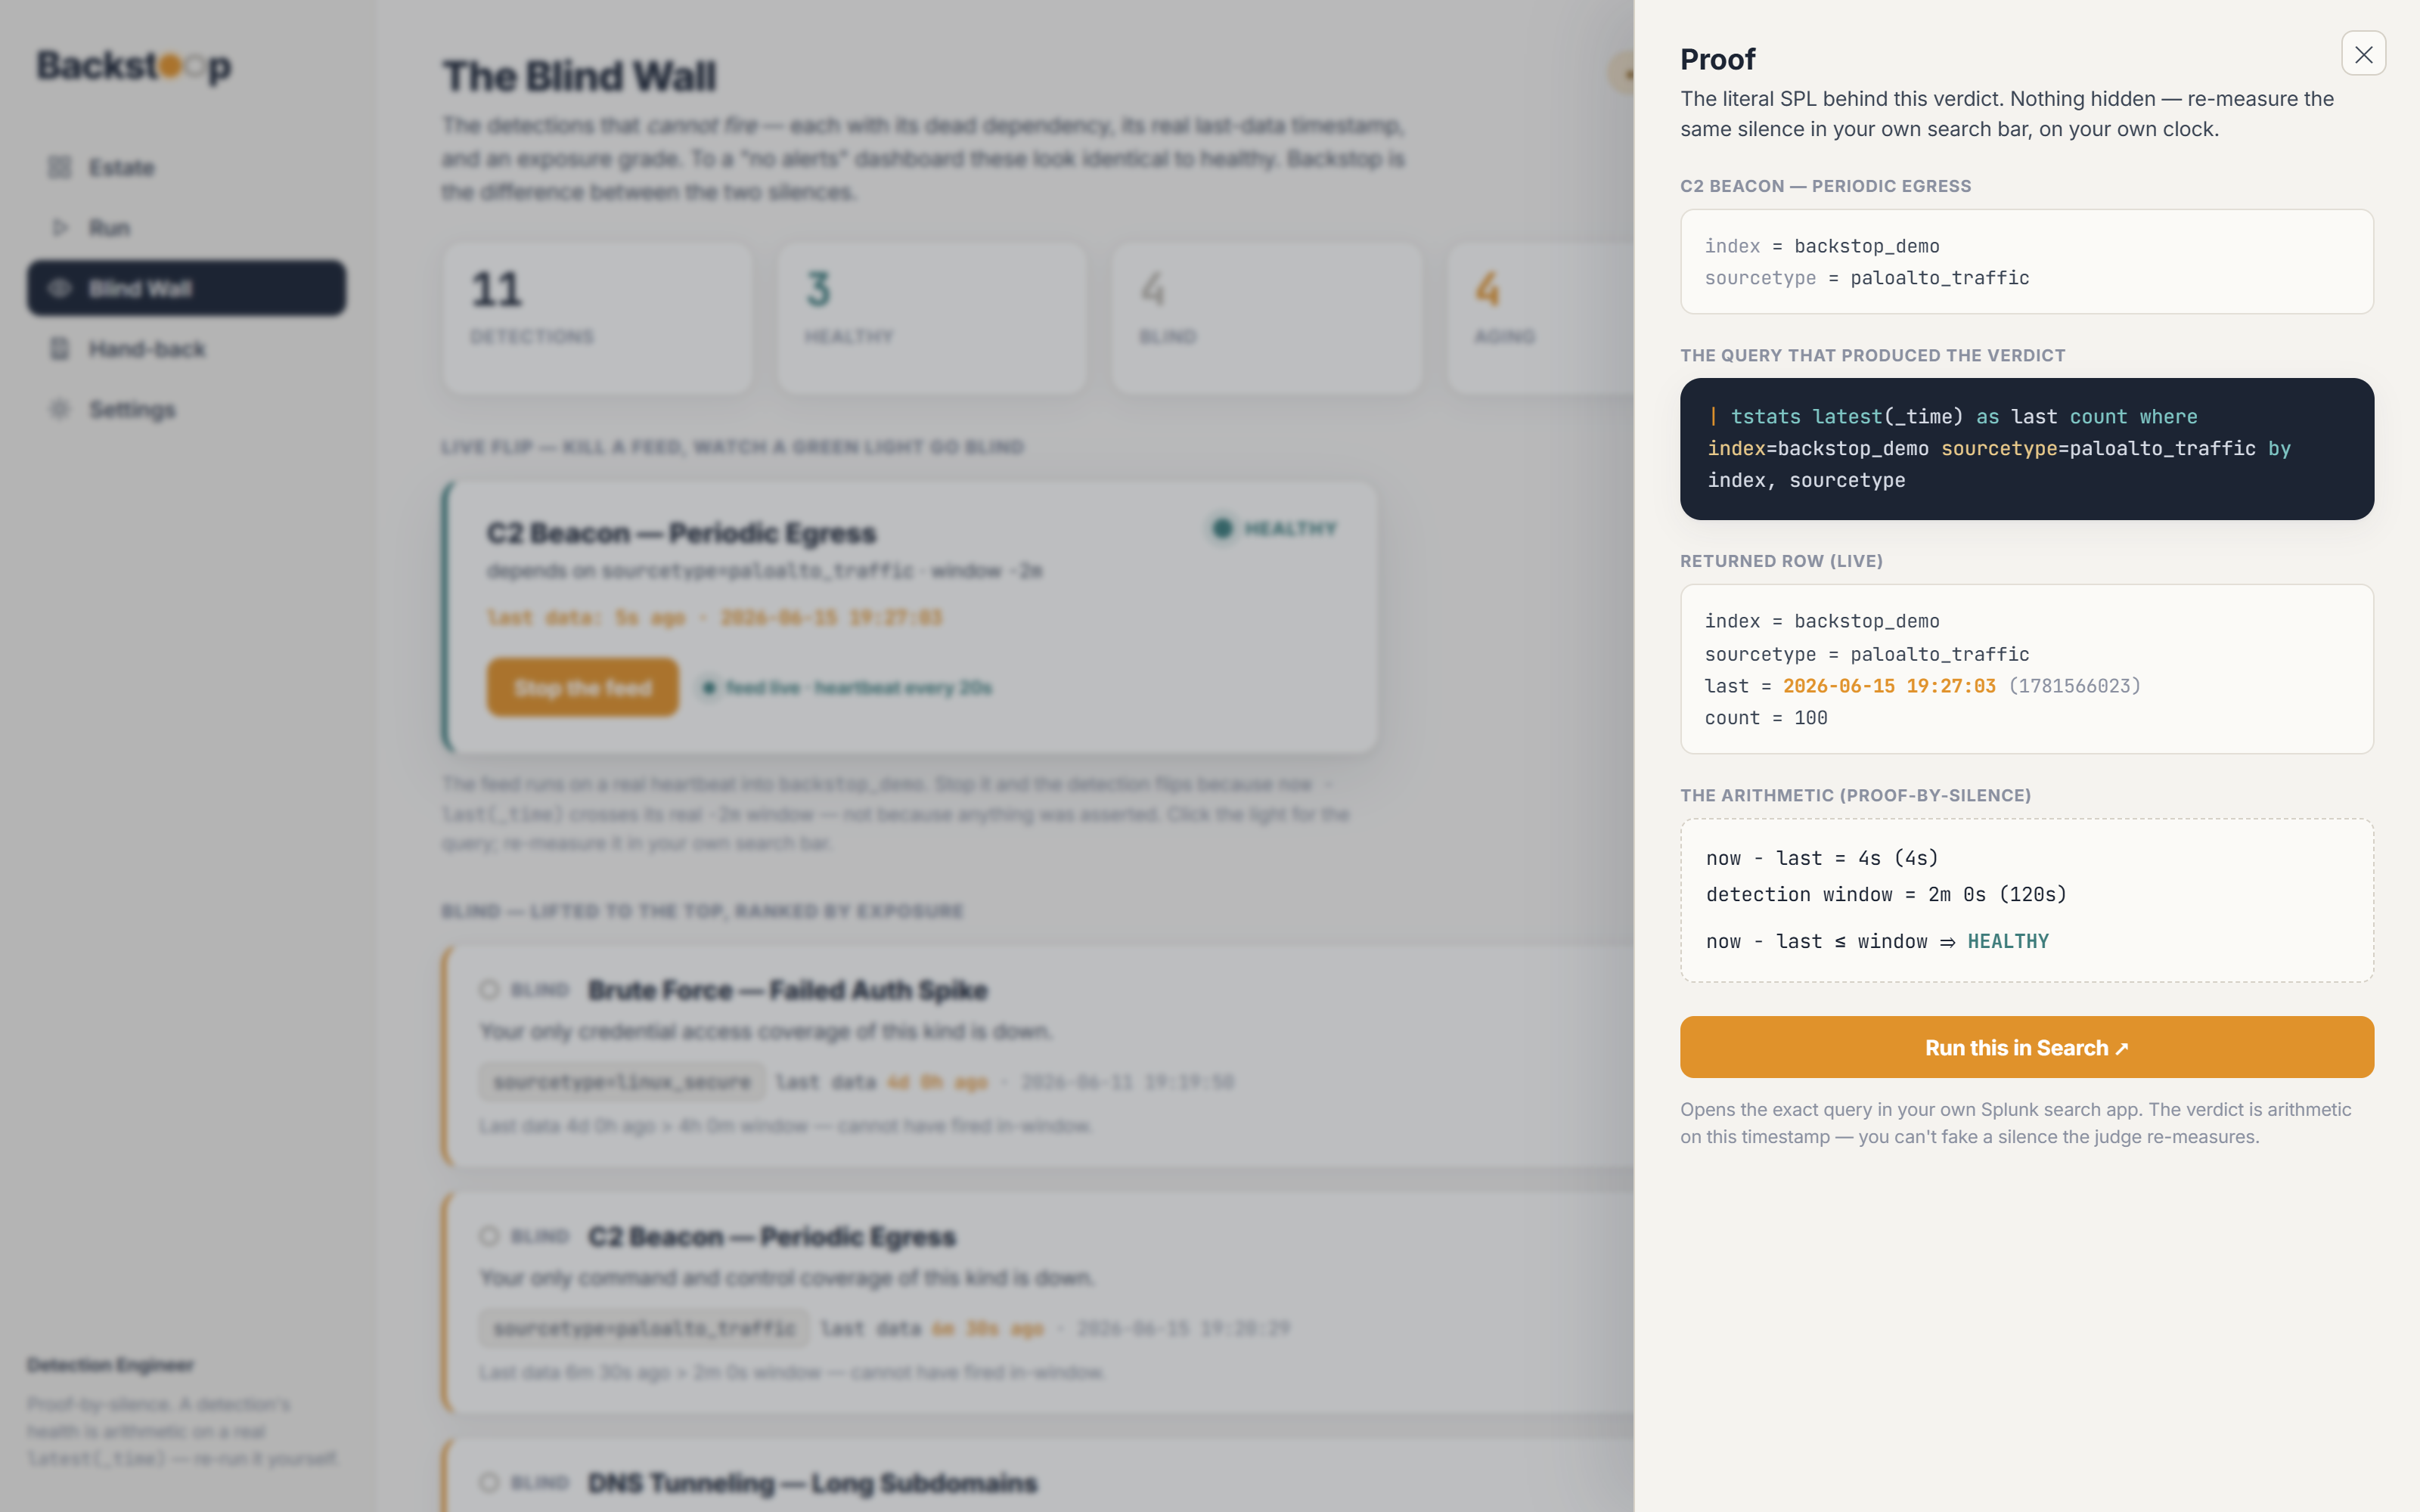
- Problem: "Run this in Search" has to execute live on the judge's own instance. →
Solution: every verdict deep-links the literal
| tstats latest(_time) …into the user's native Splunk search app. The query Backstop ran is the query you re-run, and you read the same timestamp on your own clock.
Accomplishments that I'm proud of
- 0 health states without a real timestamp. A health verdict literally cannot be constructed
without a
tstatsrow behind it. That zero is the whole brand. - The verdict is a query you re-run. Click a light, hit Run this in Search, watch the same silence come back on your own data. The proof is an action you take.
- A live green→BLIND flip you can't fake. Stop a real feed and watch a detection go blind on its
real
-2mwindow, stamped with the last row it will ever see. To a "no alerts" dashboard, blind and quiet-healthy look identical, so it can never show you that moment. - Calm in a domain that screams. No red and no sirens; a blind detection shows a quiet hollow light, because the failure mode here is a silence, and a reader spots silence when nothing else is flashing.
What I learned
- In a SOC, confidence is a liability. The valuable AI hands you a query you can run, and leaves the verdict to the data. I learned to make the model say less and the arithmetic say more.
- The hard part was making blindness re-derivable. Computing
now − last > windowtakes one line. Making every verdict re-executable on a stranger's instance is the engineering, and it's where the trust lives. - Coverage decay is the SOC's silent tax. Building the meta-monitoring blind-spot map requires reasoning about detection plumbing, a layer below the attacks themselves, which is why few people build it and why the gap is worth building.
What's next for Backstop
Predict the blind, don't just catch it:
- Feed each dependency's ingest cadence to SPL-native
predict/anomalydetectionto warn before a feed goes silent.
Deeper Splunk:
- Map every healthy detection to MITRE ATT&CK technique coverage and show the live holes in the matrix as feeds come and go.
- Promote the hand-back saved search into a self-monitoring alert, so Backstop becomes the one detection that fires when your detections can't.
Provenance everywhere (each honest limit → a roadmap bullet):
- A static SPL parse can't follow heavy macros / runtime lookups → these are labelled "dependency unknown" today; next, resolve macros server-side before grading.
- Silent isn't always broken (a 3am-quiet sourcetype is idle, not blind) → the quiet-by-design allowlist exists; next, learn the cadence automatically.
- Exposure is a model's opinion → ship edge-of-confidence scoring, never certainty.
The Bigger Picture
Every SOC measures whether alerts fired. Almost none measure whether they still can. The reflex adds another model that summarizes the alert flood, and a summary you can't check is a faster way to be wrong. Backstop takes the other path: it does the one mechanical thing at machine speed, proving which detections can no longer fire, and then makes every verdict re-runnable on your own data. The instruction is trust the silence you can re-measure. 11 detections, 4 blind, and a blindness you can always check for yourself.
Built With
- ai-agents-for-splunk-apps
- cloud-run
- esm
- foundation-sec
- gemini
- google-cloud
- javascript
- metadata
- next.js
- node.js
- outputlookup
- proof-by-silence
- react
- saved-searches
- server-sent-state
- service-account-jwt
- spl
- splunk
- splunk-ai-canvas
- splunk-cloud
- splunk-hosted-models
- splunk-mcp-server
- splunk-rest-api
- tstats
- vercel
- vertex-ai

Log in or sign up for Devpost to join the conversation.