-
-
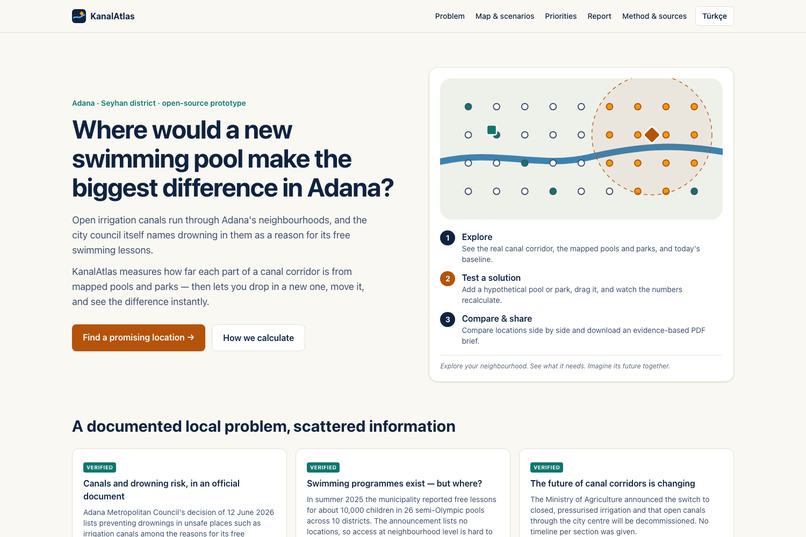
Question and steps
-
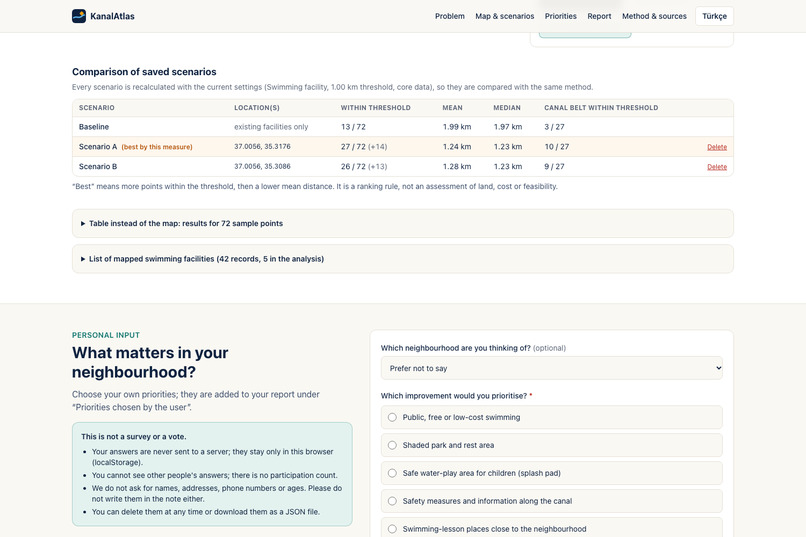
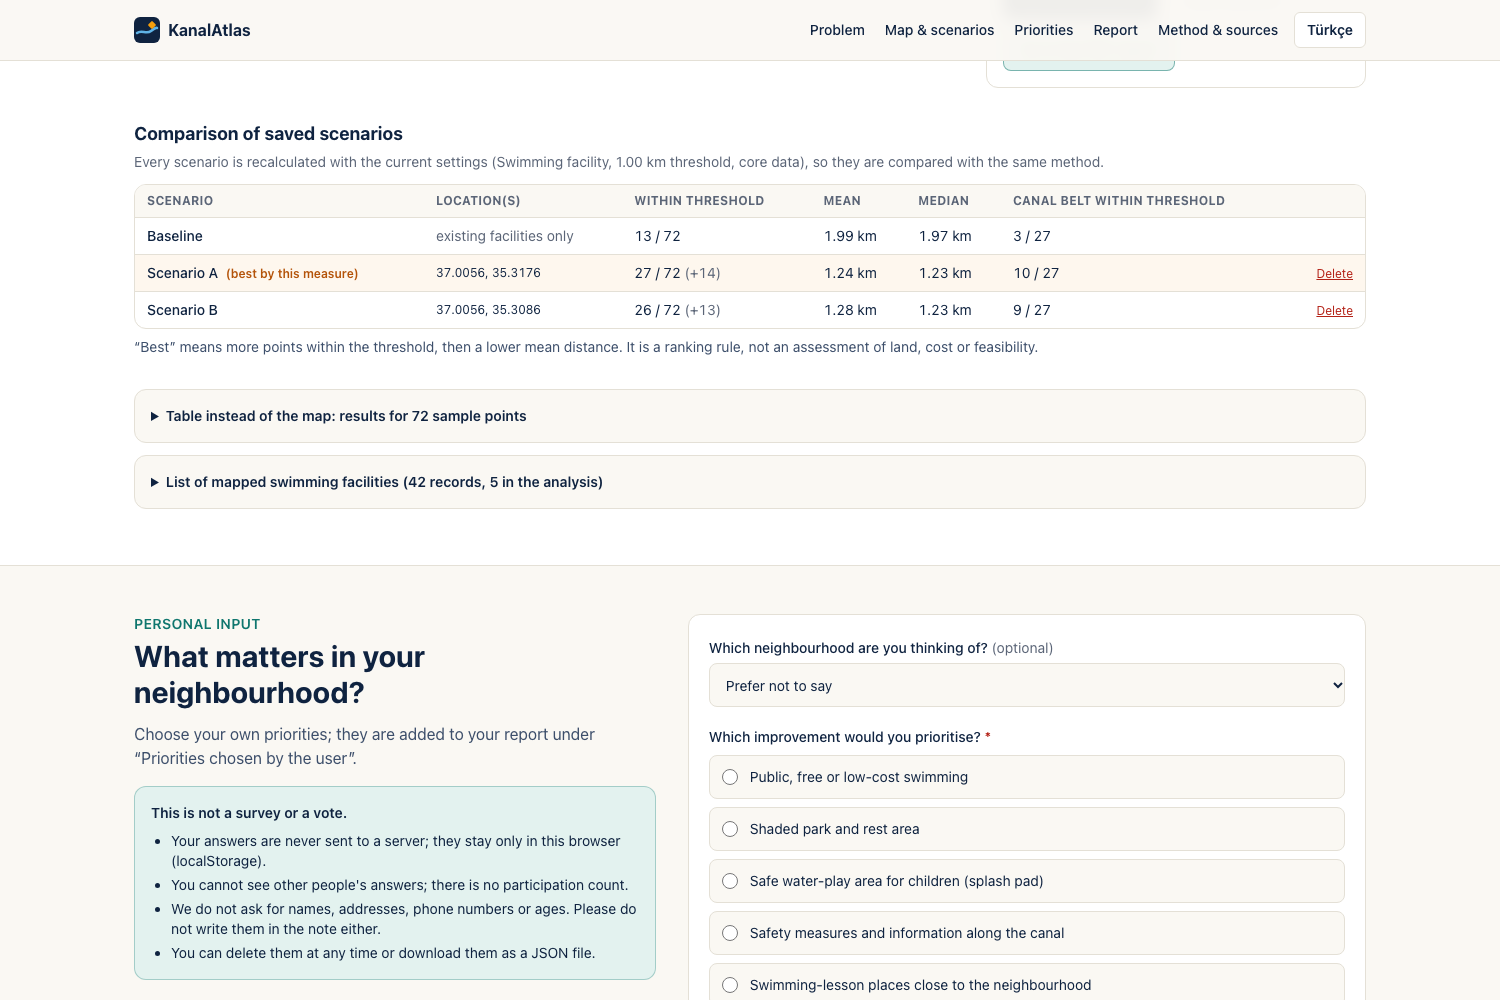
Compare Scenario A and B
-
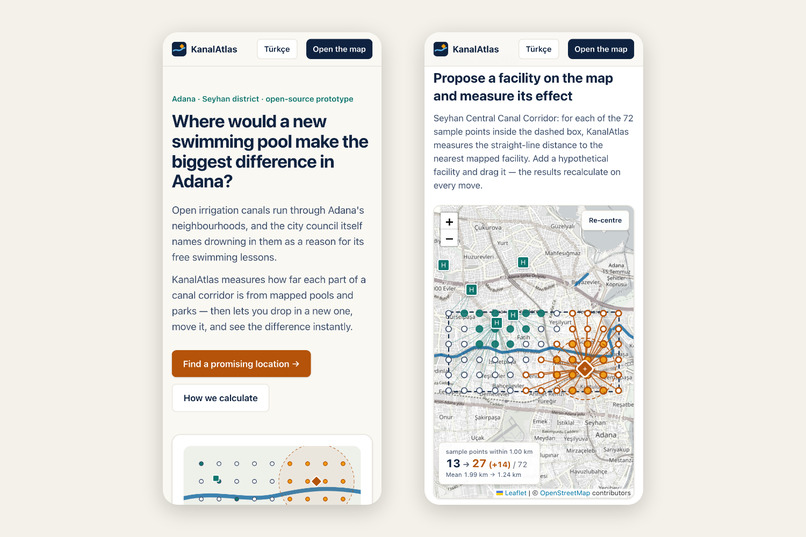
Mobile
-
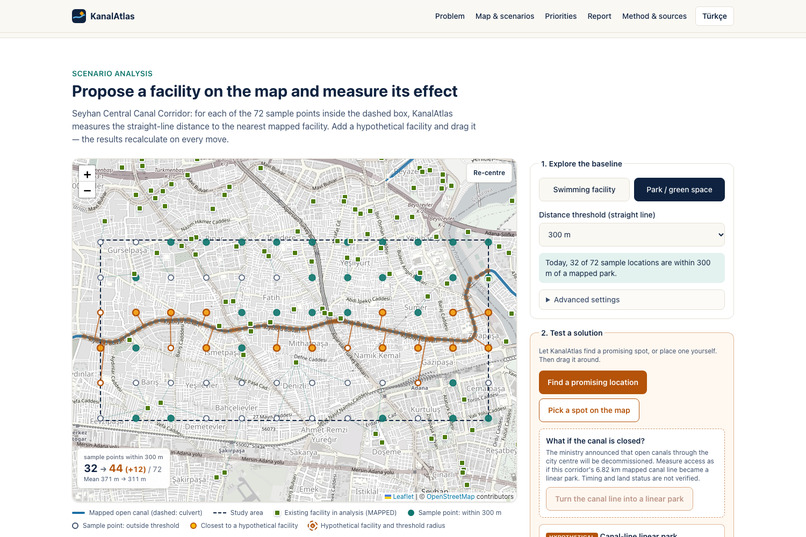
Canal as linear park
-
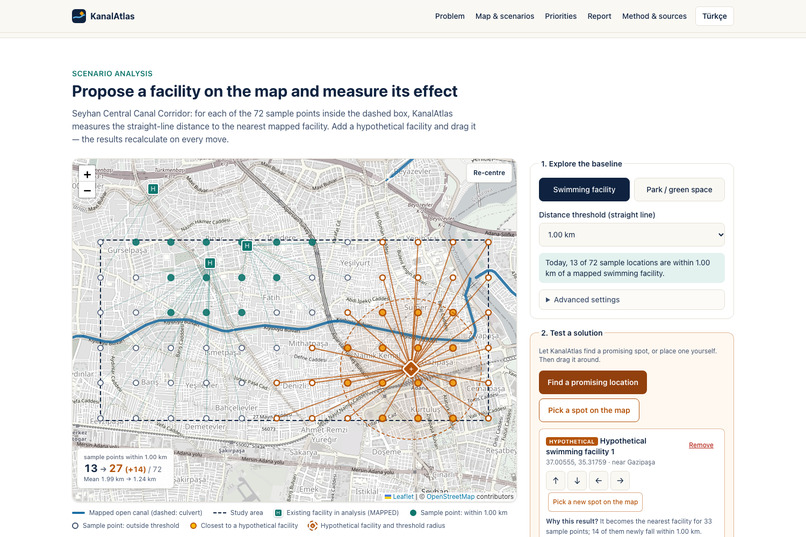
Promising location before and after
-
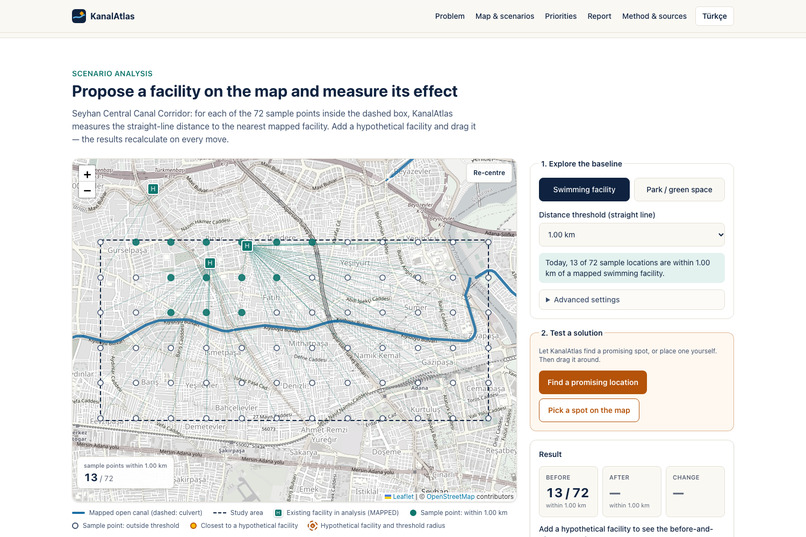
Baseline map
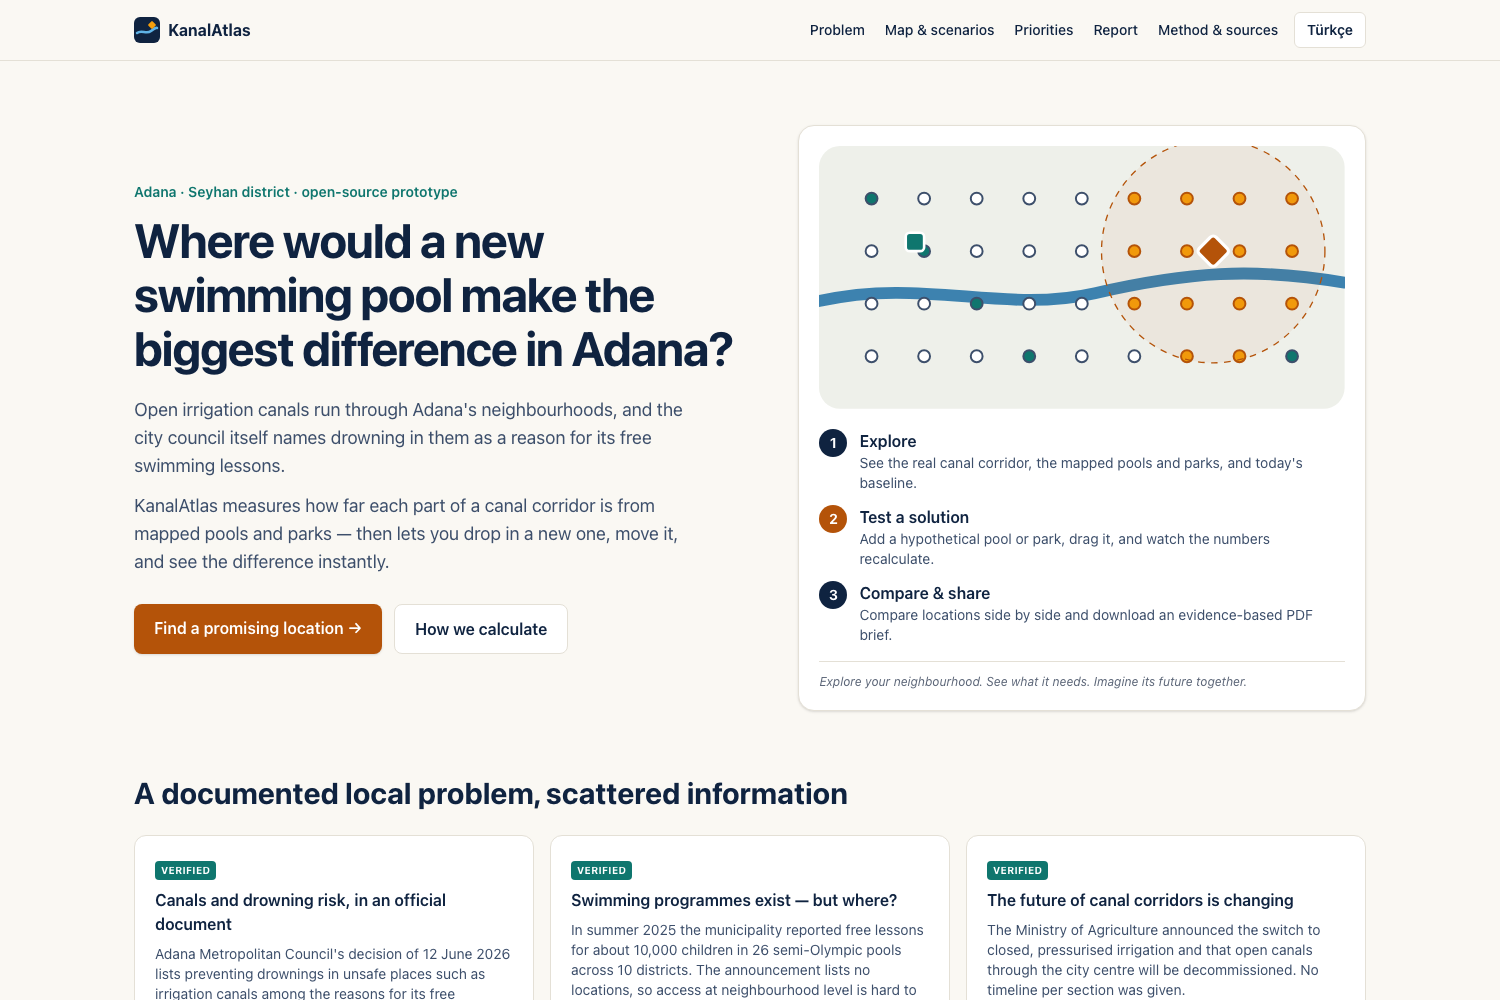
Inspiration
I live in Adana, in southern Türkiye, where summers are extremely hot. Open irrigation canals run straight through residential neighbourhoods, and some people, including children and teenagers according to local reports, go into them to cool off.
I have heard about this from people around me: swimming in the canals to cool off is something people talk about here every summer. That made me wonder why it still happens when the city runs swimming programmes, and whether people living next to the canals actually have a pool or a shaded park within reach.
This is not just a feeling. In June 2026, Adana Metropolitan Council approved a programme with local sports clubs to give free swimming lessons to children from low-income families. The council's written rationale names preventing drownings in unsafe places such as irrigation canals in the summer heat. The year before, the municipality reported free lessons for about 10,000 children in 26 pools. At the same time, the Ministry of Agriculture announced that the open canals running through the city centre will be replaced by closed, pressurised pipes, so the future of these canal corridors is changing.
What I noticed was an information problem. The swimming programmes exist, but their locations are not published in a way that shows whether a neighbourhood next to a canal has a pool nearby. And if a canal is eventually closed, nobody can easily compare where a new pool or park along that corridor would help most.
What it does
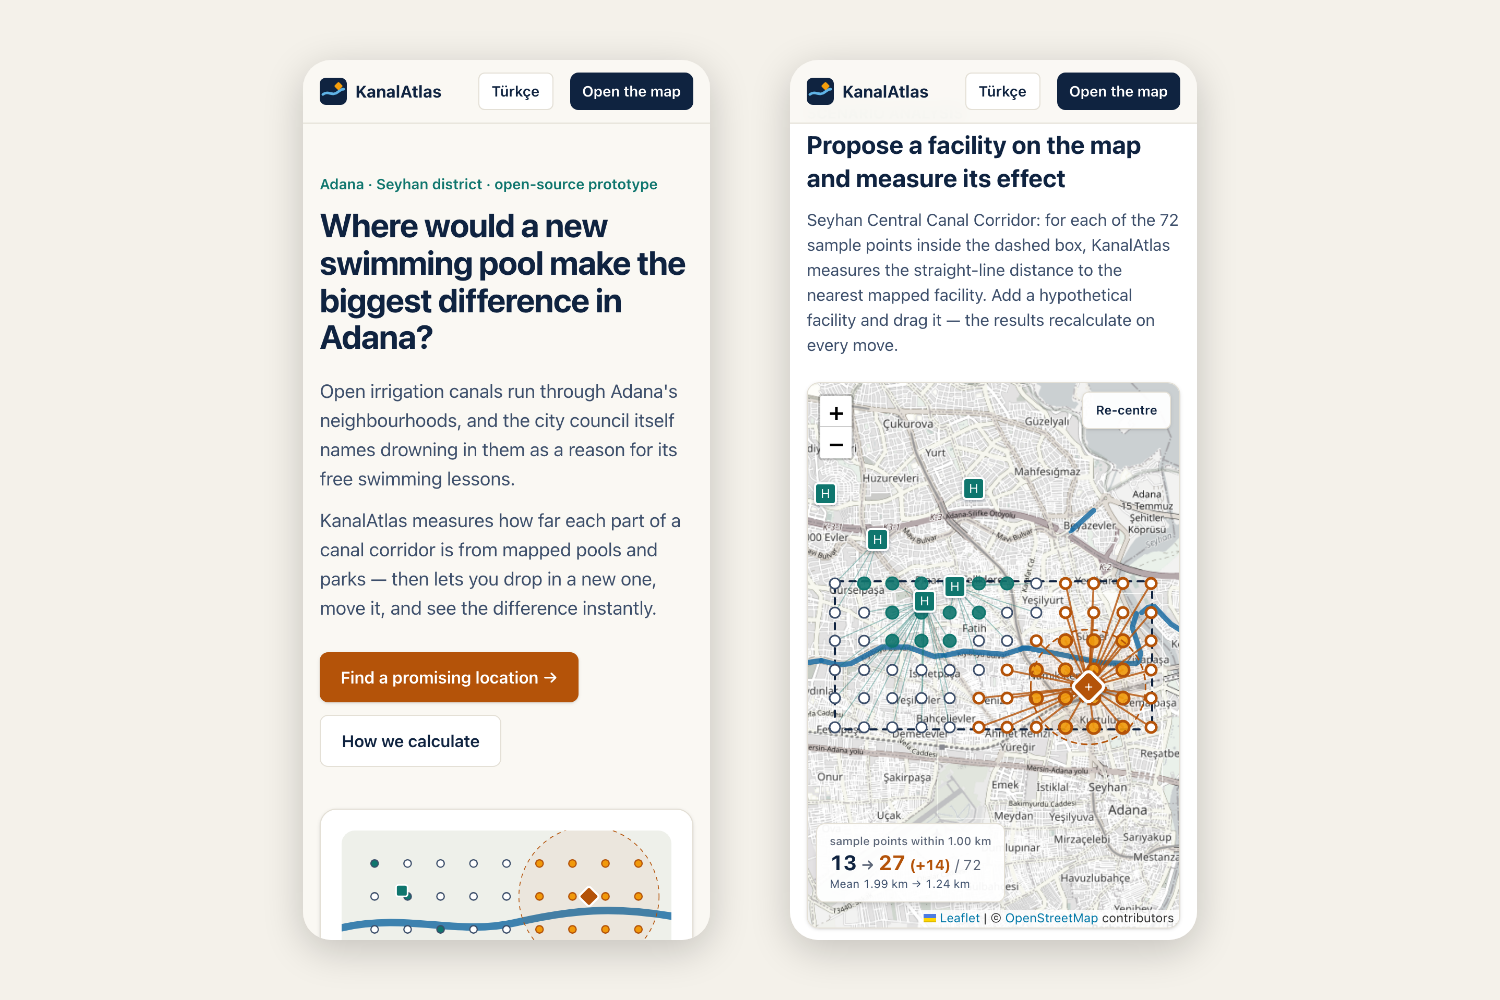
KanalAtlas is a working geospatial decision-support prototype for one real study area: the open canal corridor in central Seyhan, Adana (about 5.5 × 2.6 km). The page asks one question (“Where would a new swimming pool make the biggest difference in Adana?”) and guides you through three steps: explore the baseline, test a solution, compare and share.
- Shows real data: canals, swimming facilities and parks from OpenStreetMap, each with a link to its source and an honest status label. Nothing is called “open” or “public” without evidence; mapped facilities are labelled MAPPED.
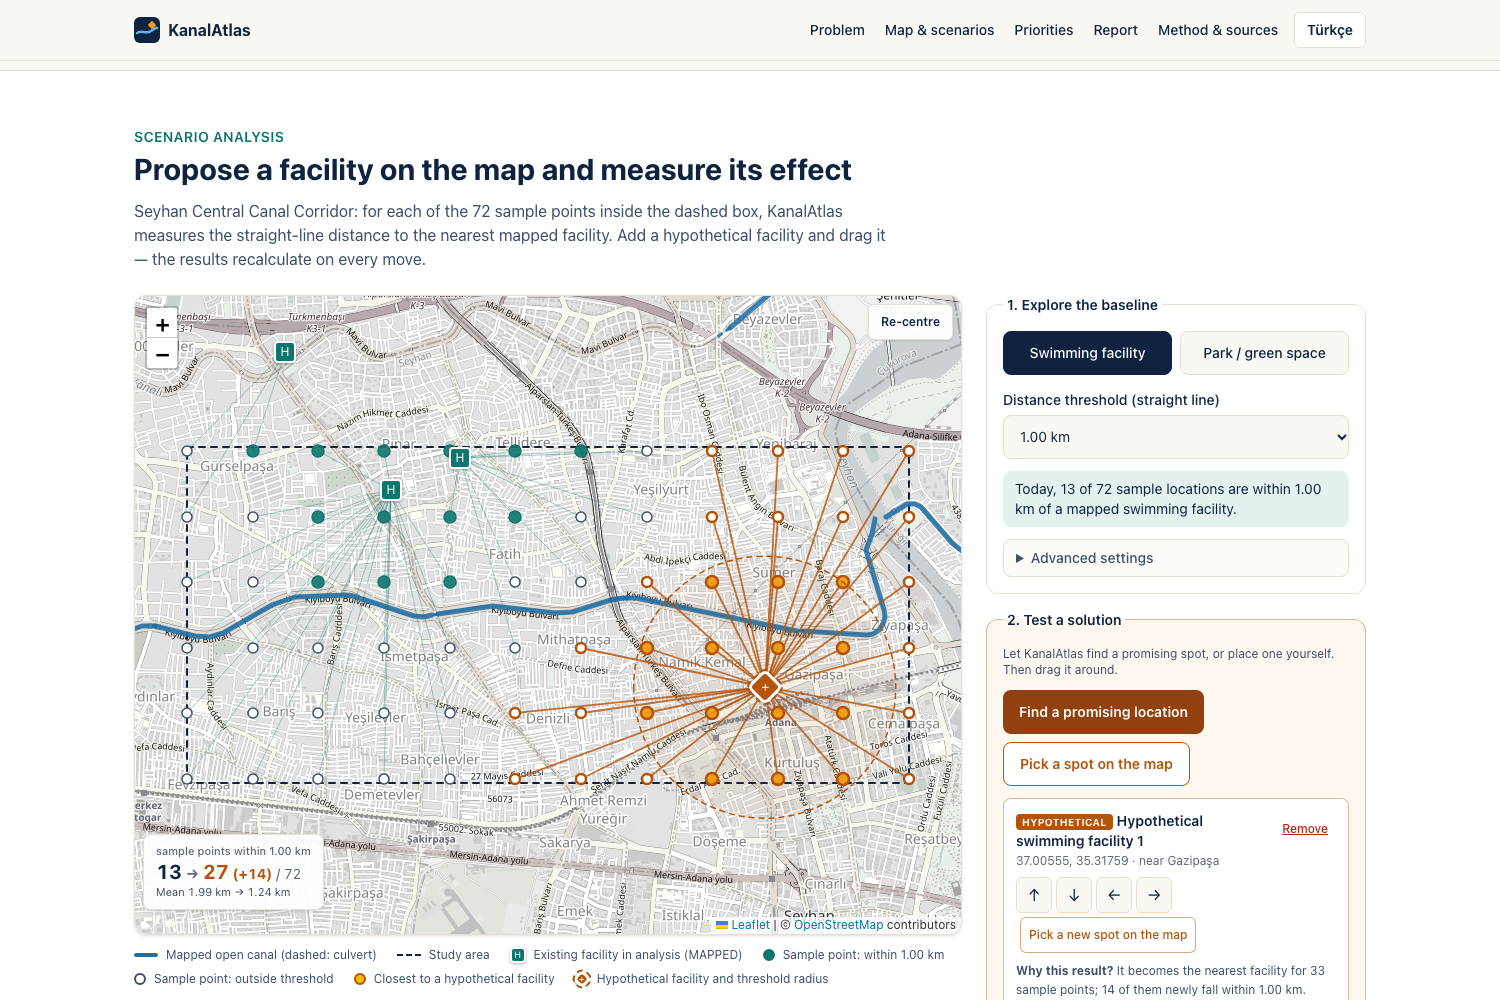
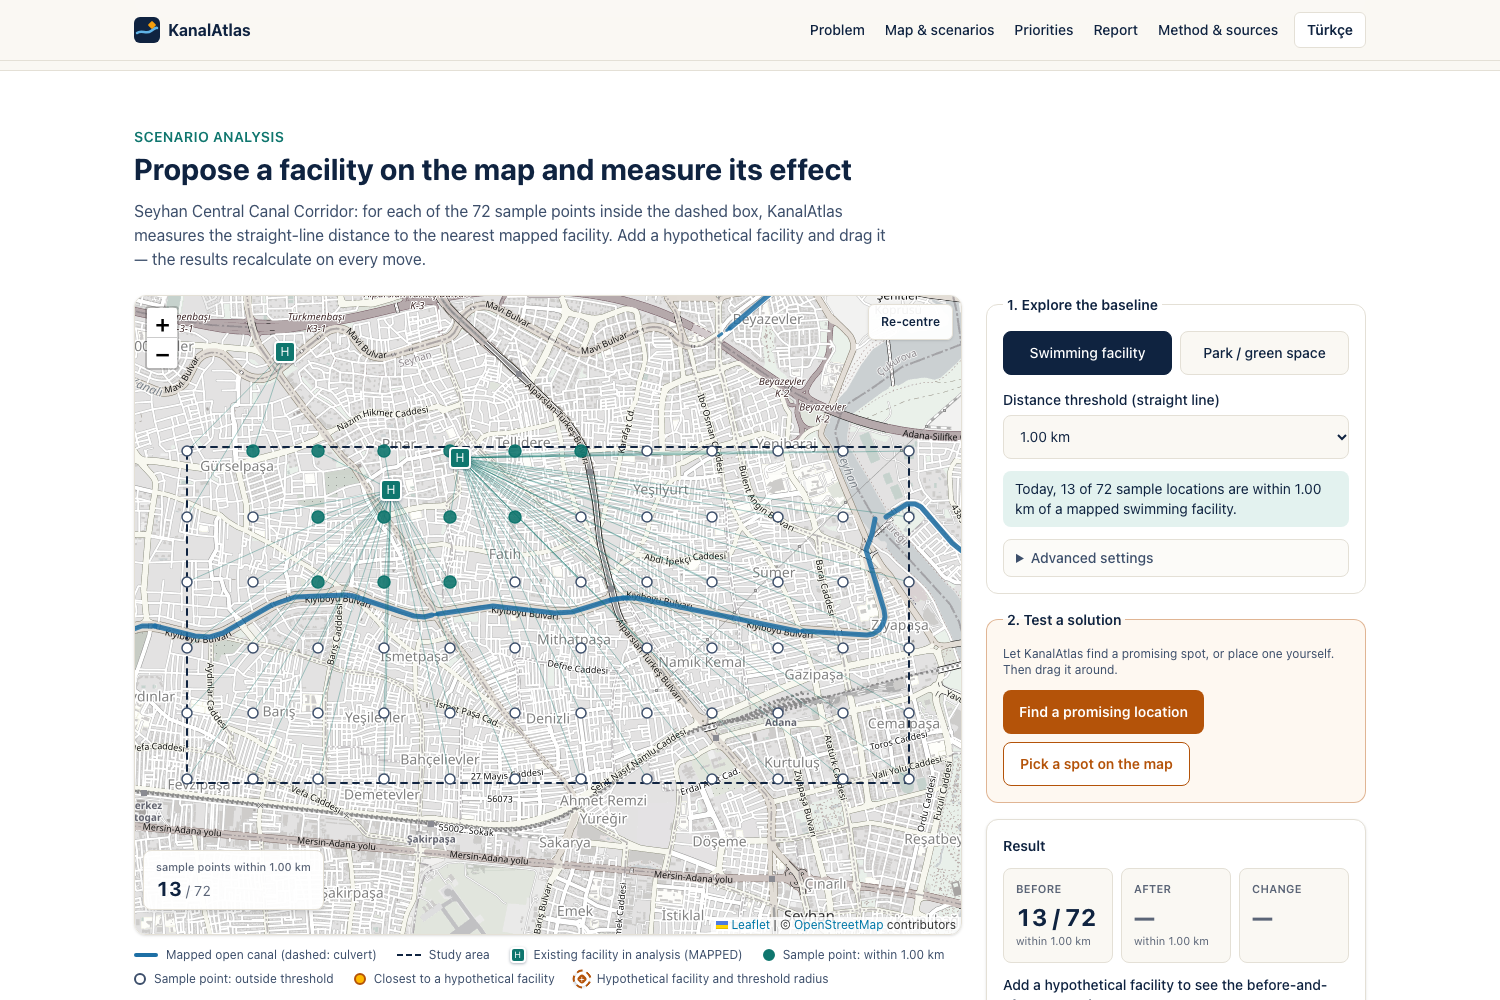
- Measures access: 72 sample points on a 500 m grid. For each one, KanalAtlas calculates the straight-line distance to the nearest mapped facility of the chosen type. Baseline: 13 of 72 sample points are within 1 km of a named or swimming-tagged pool.
- Tests “what if?”: you place a hypothetical pool or park and drag it. Every point, line and number is recalculated live from coordinates. A “Find a promising location” button screens 1,456 candidate sites and places the best one for you. Results appear as BEFORE / AFTER / CHANGE tiles computed from the coordinates. A “why this result?” note explains the outcome (how many points it serves, how far it is from existing facilities).
- Compares fairly: save locations A, B and C; they are re-evaluated with identical settings side by side. With real data, a pool in the east of the corridor reaches 27/72 points, while the same pool in the west reaches 21/72.
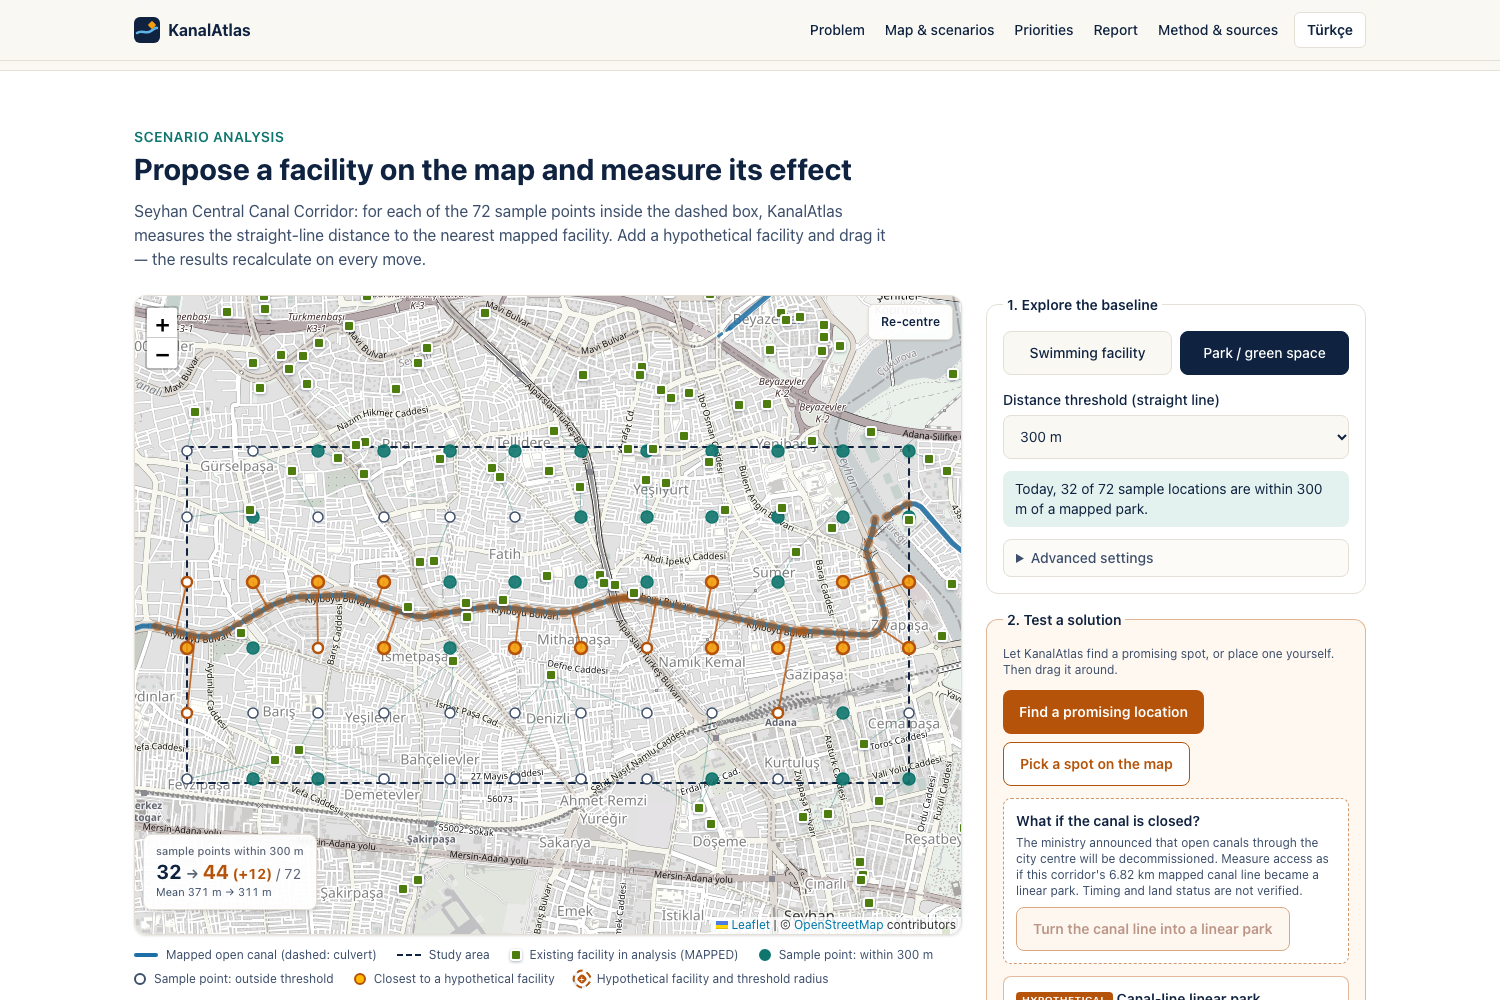
- Asks “what if the canal closes?” In the park view, one button turns the 6.82 km mapped canal line into a hypothetical linear park, with distance measured to the nearest point on the line. Park access within 300 m goes from 32/72 to 44/72 points (canal-side points: 12/27 → 24/27), while the best single new park reaches only 34/72. It is clearly labelled as an assumption: we do not claim the canal will close or that the land is available.
- Is honest about uncertainty: a data-scope switch shows that counting unnamed (probably private) pools would raise the baseline from 13 to 44. How much you trust the data is itself a finding.
- Collects your priorities privately: “What matters in your neighbourhood?” stores choices only in your browser. It is clearly labelled as personal input, not a survey.
- Creates a planning brief: a PDF in the interface language (English or Turkish) with the settings, sources, before/after tables, a map drawn from the same coordinates, the A/B comparison, method, limitations and questions to ask local planners.
What can it tell you that a normal map can't? A map shows where pools are. KanalAtlas tells you how many places in a neighbourhood are far from one, where one new facility would close the biggest gap, how that answer changes if you move it, and how confident you can be in the data.
How I built it
TypeScript, Next.js 15, React 19, Tailwind CSS, Leaflet and pdfmake, with OpenStreetMap data extracted once through the Overpass API and committed to the repo.
- Data pipeline: classifies OSM records (core / extended / excluded), merges duplicate records within 30 m while keeping every source ID, and excludes pools tagged as private.
- Scenario engine: pure functions, separate from the UI. Haversine distance (R = 6,371,008.8 m); a hypothetical facility counts only if strictly closer; undefined baselines never produce fake percentages.
- Testing: 79 unit tests with hand-calculated expected values (for example, a three-point line where moving the pool from 2,200 m to 1,500 m changes the results from 2/3 to 3/3 within range). The tests render real PDFs and read them back to check the numbers. Playwright tests run the full journey in Desktop Chrome, Android Chromium and Safari's WebKit engine against the production build, including downloading and parsing the PDF and a real touch-drag test.
- Bilingual: English by default; one click switches the whole interface and the PDF report to Turkish for residents of Adana.
- Accessibility: zero axe-core WCAG 2.1 A/AA violations in automated audits (desktop and mobile, with and without a scenario); a tested keyboard-only journey; English and Turkish; keyboard alternatives for every map action; a full text table instead of the map, labelled forms, visible focus, live-region announcements, and no meaning conveyed by colour alone.
My role: I chose the problem, wrote the project brief and its honesty rules, found the starting sources (the municipality's swimming news, the council decision PDF and the ministry announcement), made the design decisions (study area, thresholds, what counts as a verified facility) and tested the app.
Challenges I ran into
- Honest data vs. impressive data. Most mapped pools are unnamed polygons inside apartment complexes. Counting them makes access look three times better, so I made the choice visible instead of hiding it.
- A fair metric. Real walking routes were out of reach in the time available. I used straight-line distance and say so on every screen and in the PDF.
- Testing my own claims. In browser testing, a location dragged by hand beat my “Find a promising location” button. I fixed the algorithm to screen a 100 m candidate grid.
- Mobile. My first automated touch gestures panned the map instead of moving the marker. Reading Leaflet's source showed it uses native touch events on phones, so I rewrote the test to send real touch events, and it passed. I also added tap-to-move and arrow buttons. Testing in Safari's engine caught a layout bug that made the page scroll sideways on iPhone, which I fixed.
Accomplishments that I'm proud of
- Every number on screen and in the PDF comes from one tested function using real coordinates.
- The tool says clearly what it does not know.
- The full journey is tested in a real browser on desktop and mobile, from the map to the downloaded PDF.
What I learned
Open data needs to be read critically. The same OpenStreetMap query can make access look three times better or worse depending on which records you trust. A simple, honest metric (straight-line distance, clearly labelled) beats an impressive but unverified one. And testing the claims, not just the code, matters: my own browser test found a location that beat our “Find a promising location” button, which made me improve the algorithm.
What's next for KanalAtlas
Walking-network distances; verifying facilities against the official municipal pool list; a consent-based way for residents to submit priorities; more Adana neighbourhoods; and richer corridor scenarios (only some sections closing, shade, or water-play points along the route).
Important limitations
Straight-line distance is not walking distance. Sample points are not people (no population data is used). Facility operating status and public access are not verified. KanalAtlas does not predict drowning risk, does not claim any canal will close, and does not assess land availability or cost. One study area only. No community input has been collected yet.
AI disclosure
The idea, problem, sources, design decisions and testing are mine. The code was written with an AI coding assistant, and the demo video's voice-over is computer-generated (Kokoro text-to-speech). No data or results were AI-generated: every fact comes from the cited sources and OpenStreetMap.
Sources
- Adana Büyükşehir Belediye Meclisi, decision 67597785-105.04/183, 12.06.2026: https://www.adana.bel.tr/panel/uploads/mecliskararlari_v/files/2026-haziran-ayi-pdf.pdf
- Adana Büyükşehir Belediyesi, 21.07.2025: https://www.adana.bel.tr/tr/haber/27-bin-684-cocuga-ucretsiz-spor-egitimi-veriliyor
- T.C. Tarım ve Orman Bakanlığı (Adana), 10.09.2025: https://egitim.tarimorman.gov.tr/adana/Haber/1162/Adana-Tariminda-Yeni-Donem-Basliyor-Acik-Sulama-Kanallari-Tarihe-Karisiyor-Kapali-Basincli-Sulama-Sistemine-Geciliyor
- Map data © OpenStreetMap contributors (ODbL), extracted 22.10.2026.
Links: Live demo: https://deniz2077.github.io/kanalatlas/ · Code: https://github.com/deniz2077/kanalatlas · Video: https://youtu.be/CL7fIi5G-mE
Built With
- github-actions
- leaflet.js
- next.js
- openstreetmap
- overpass-api
- pdfmake
- playwright
- react
- tailwindcss
- typescript
- vitest

Log in or sign up for Devpost to join the conversation.