-
-
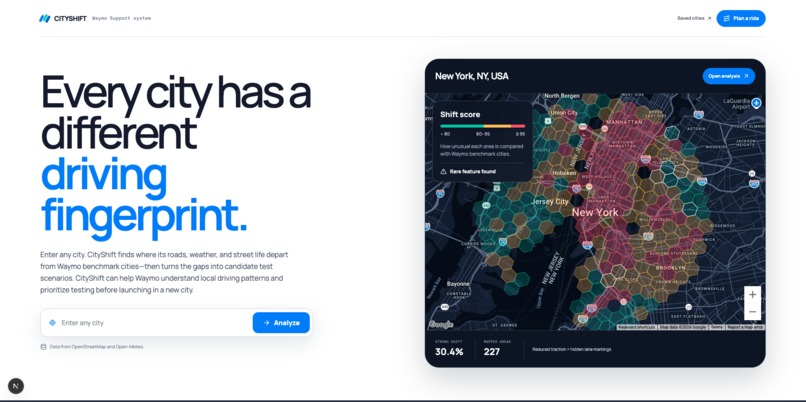
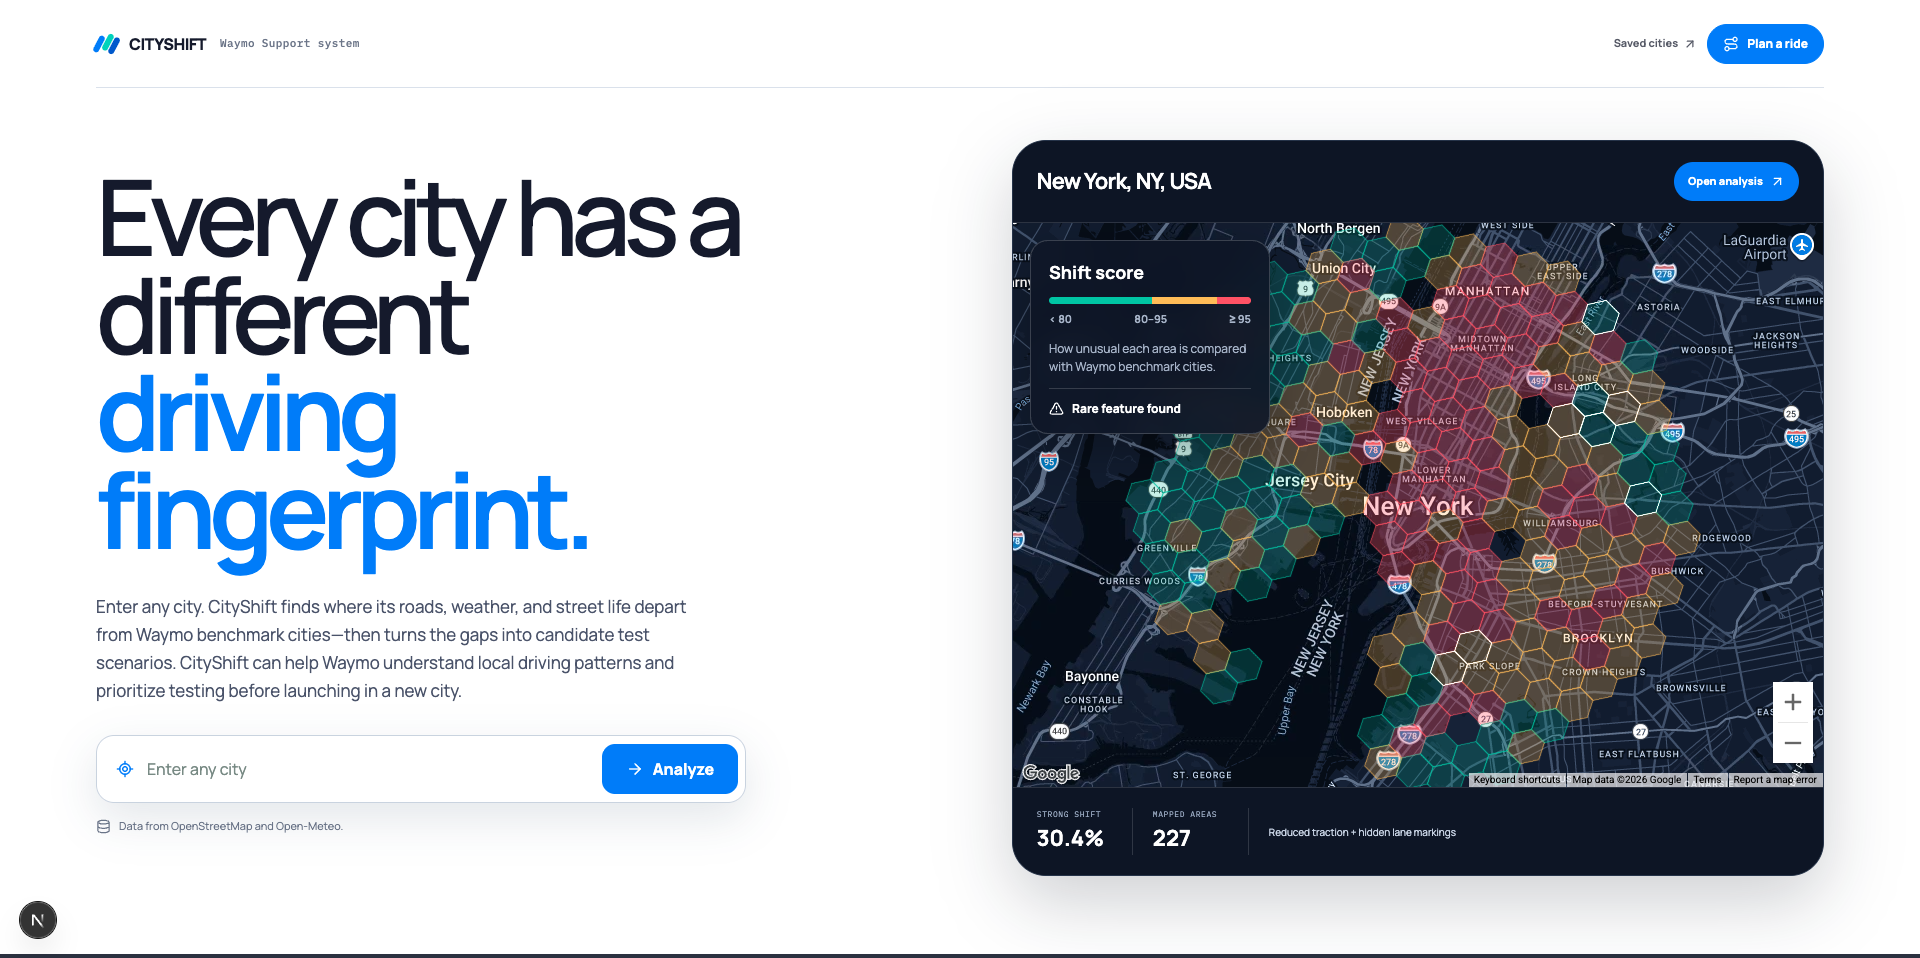
Home page — Discover a city’s driving fingerprint and see how it differs from Waymo benchmark cities.
-
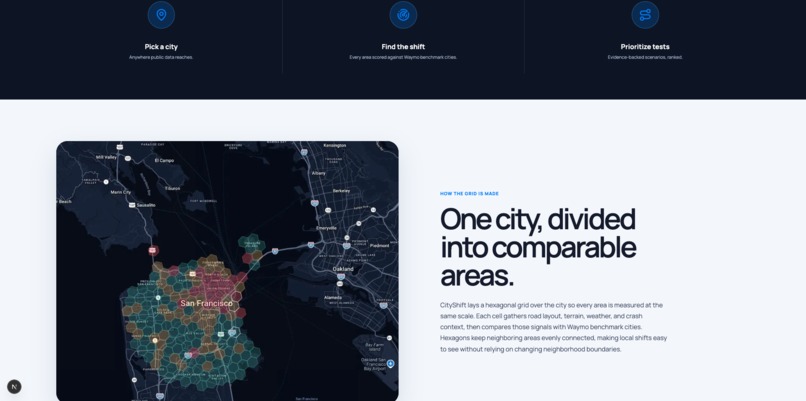
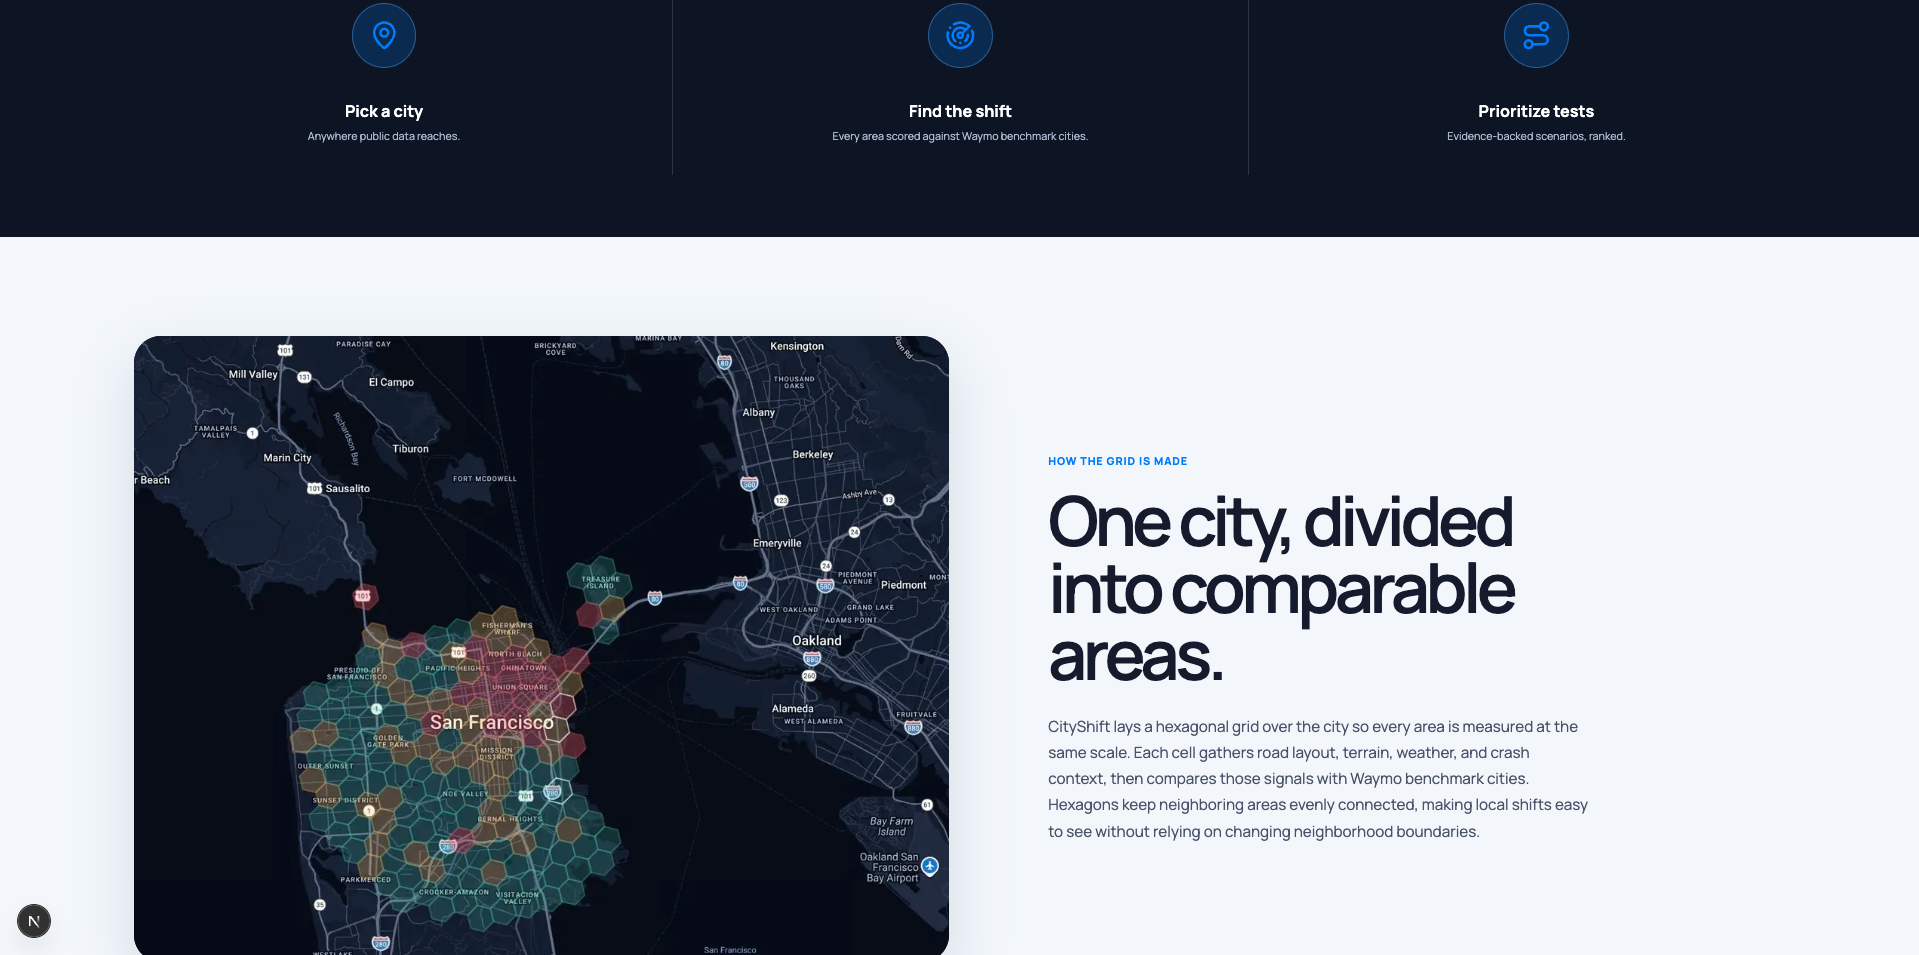
How it works — CITYSHIFT divides cities into hexagons so local driving conditions can be measured and compared consistently.
-
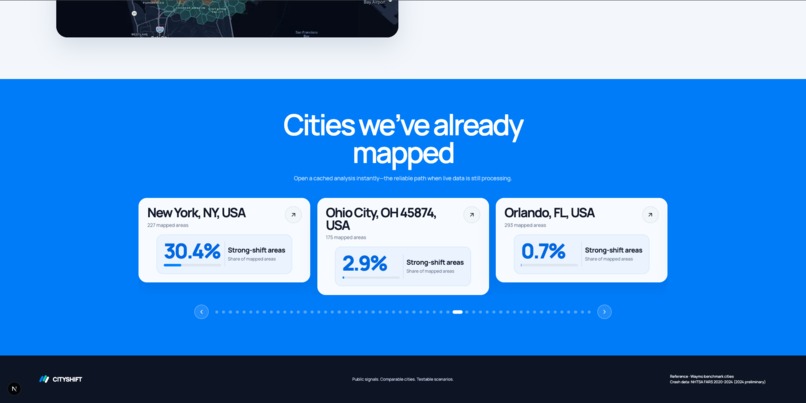
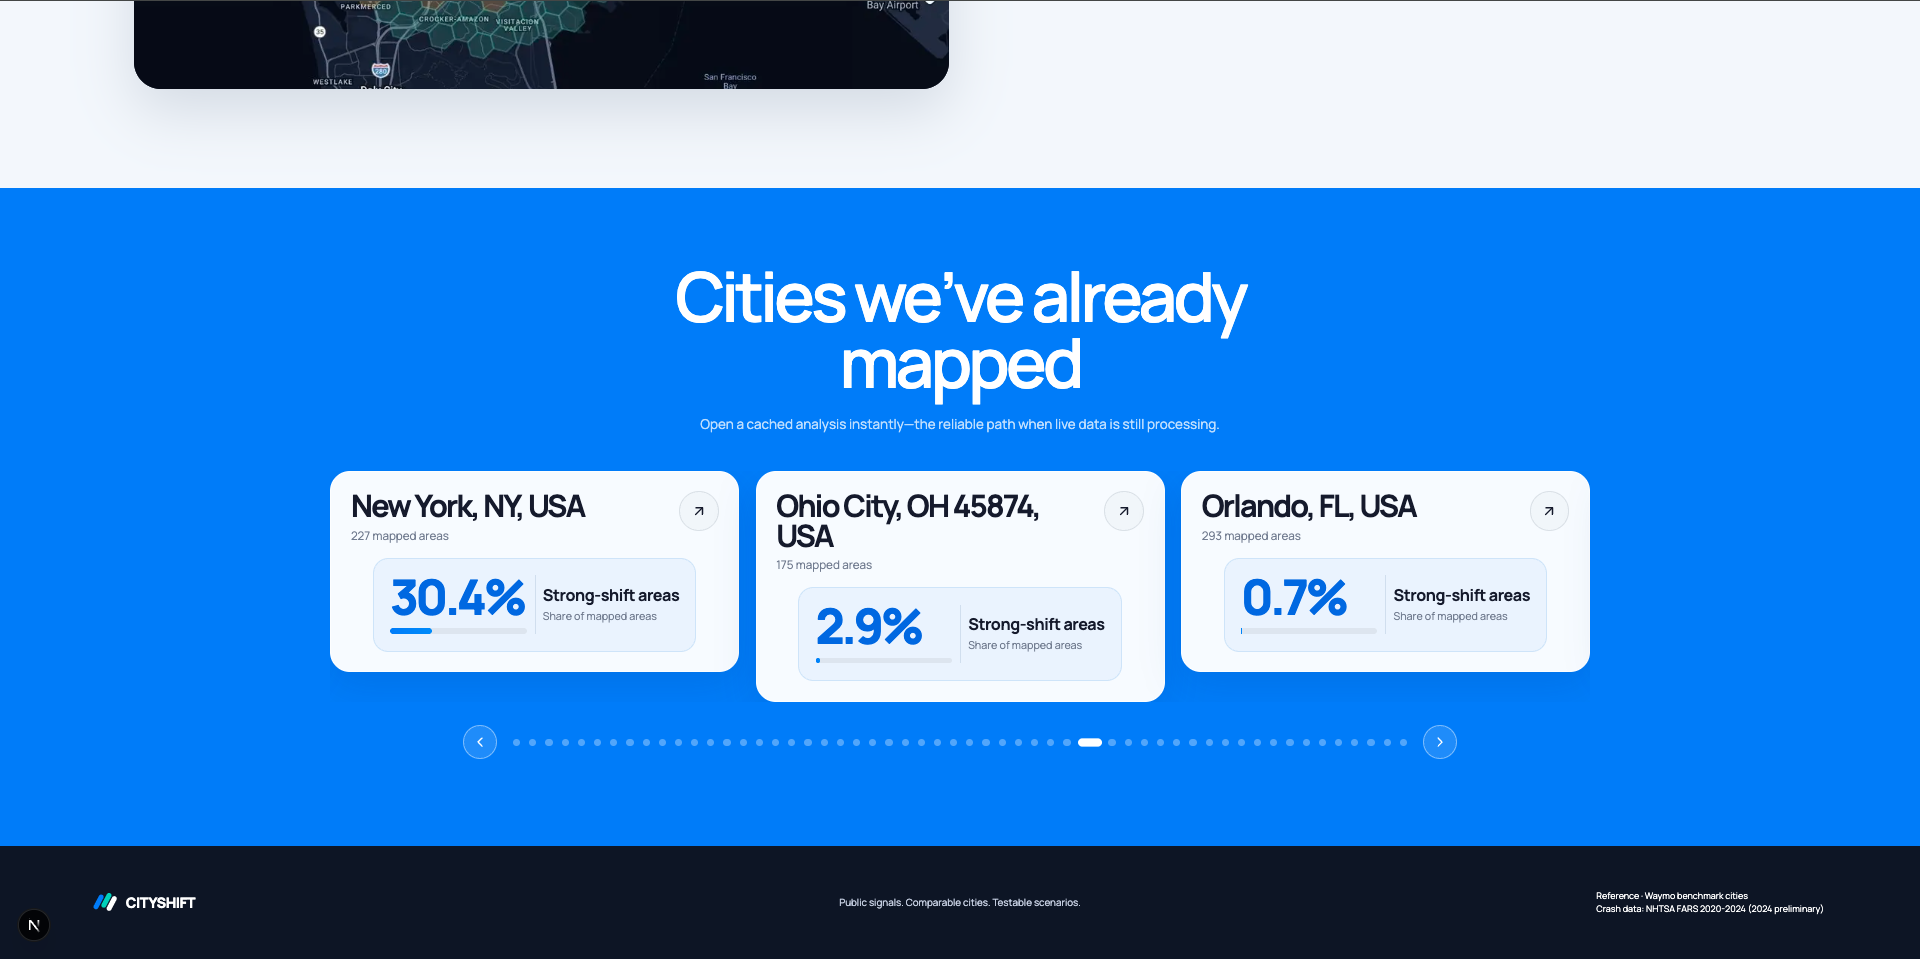
Cached cities — Open completed city analyses instantly, including Austin, Atlanta, and Bal Harbour.
-
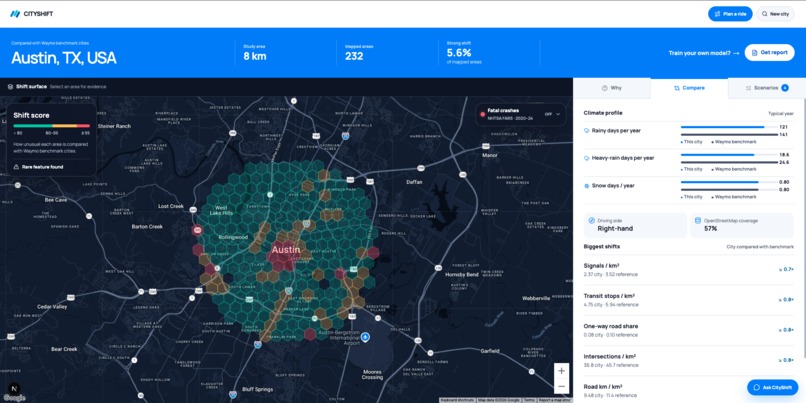
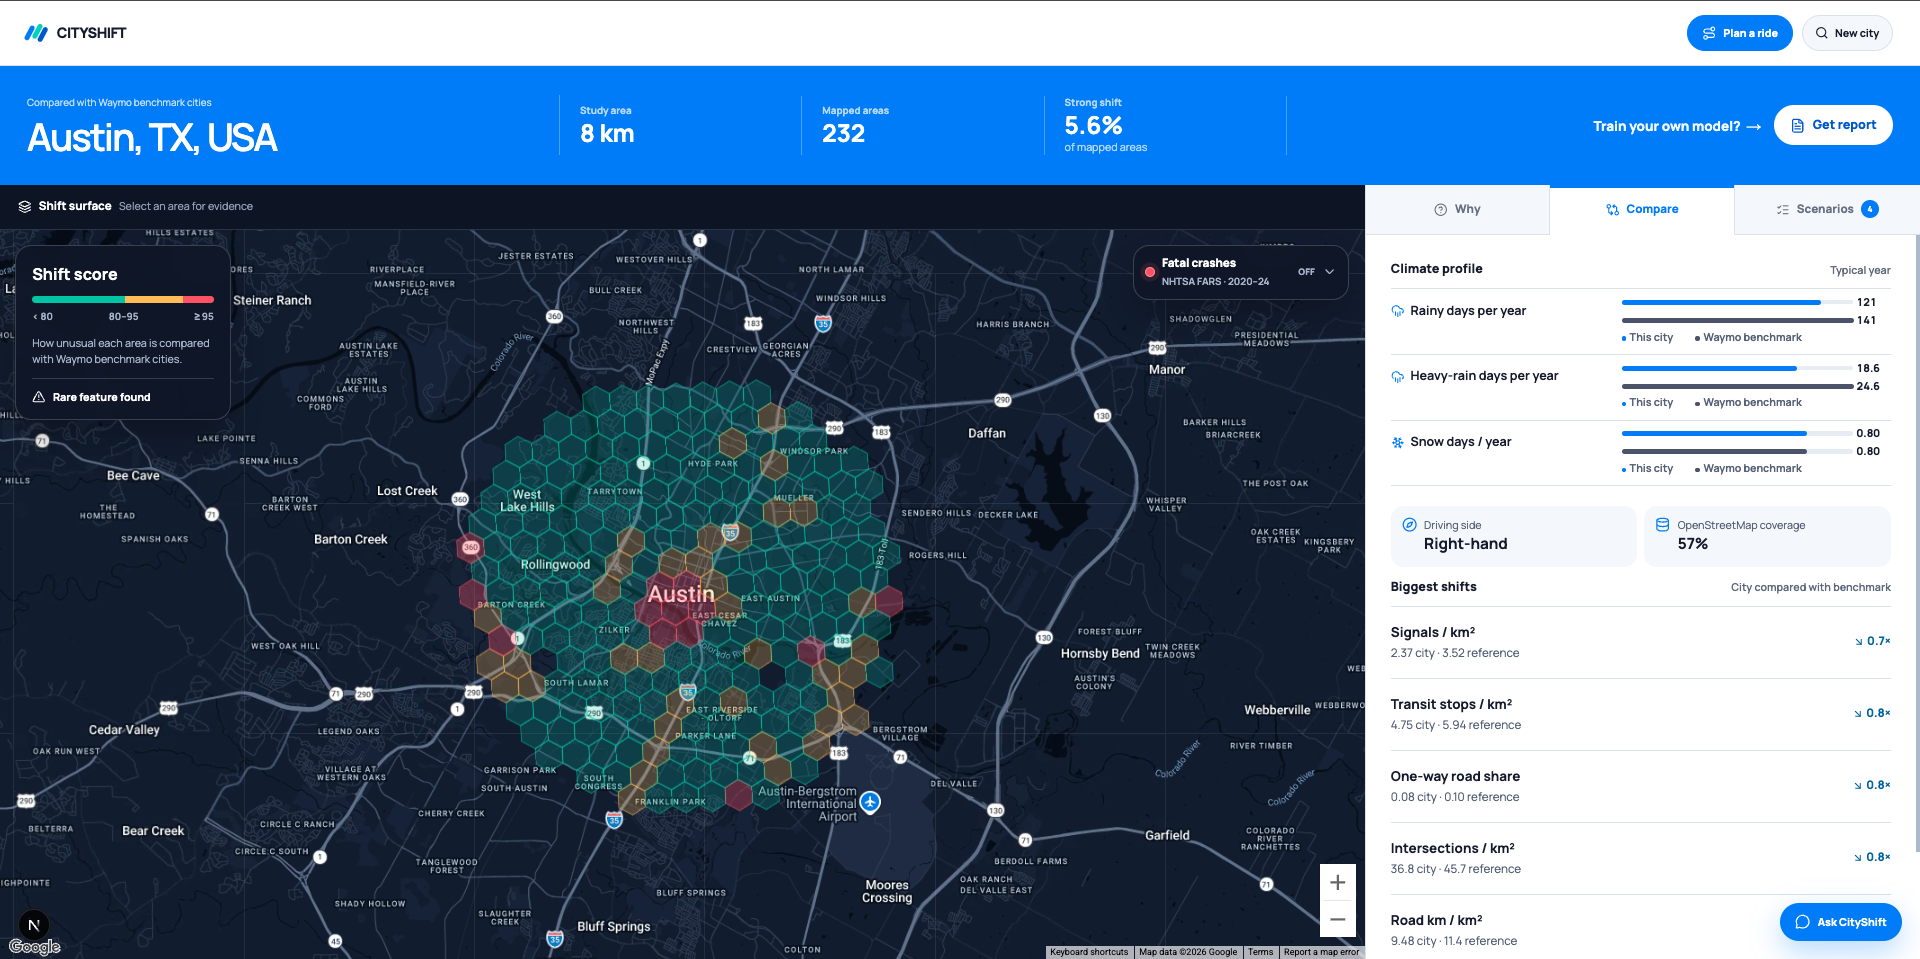
City comparison — Compare Austin’s weather, roads, and infrastructure with the benchmark cities.
-
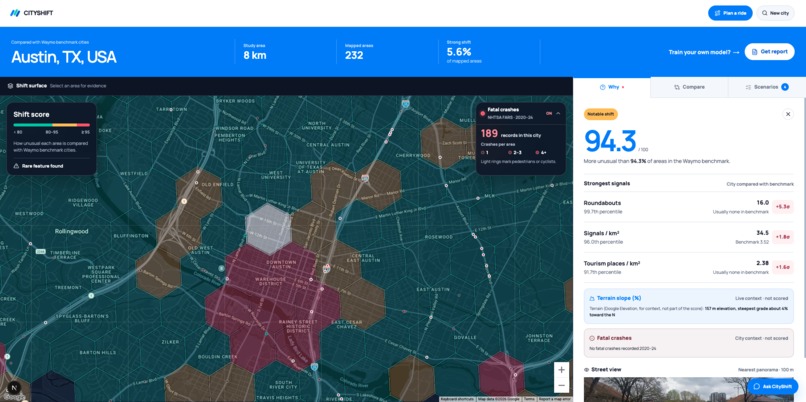
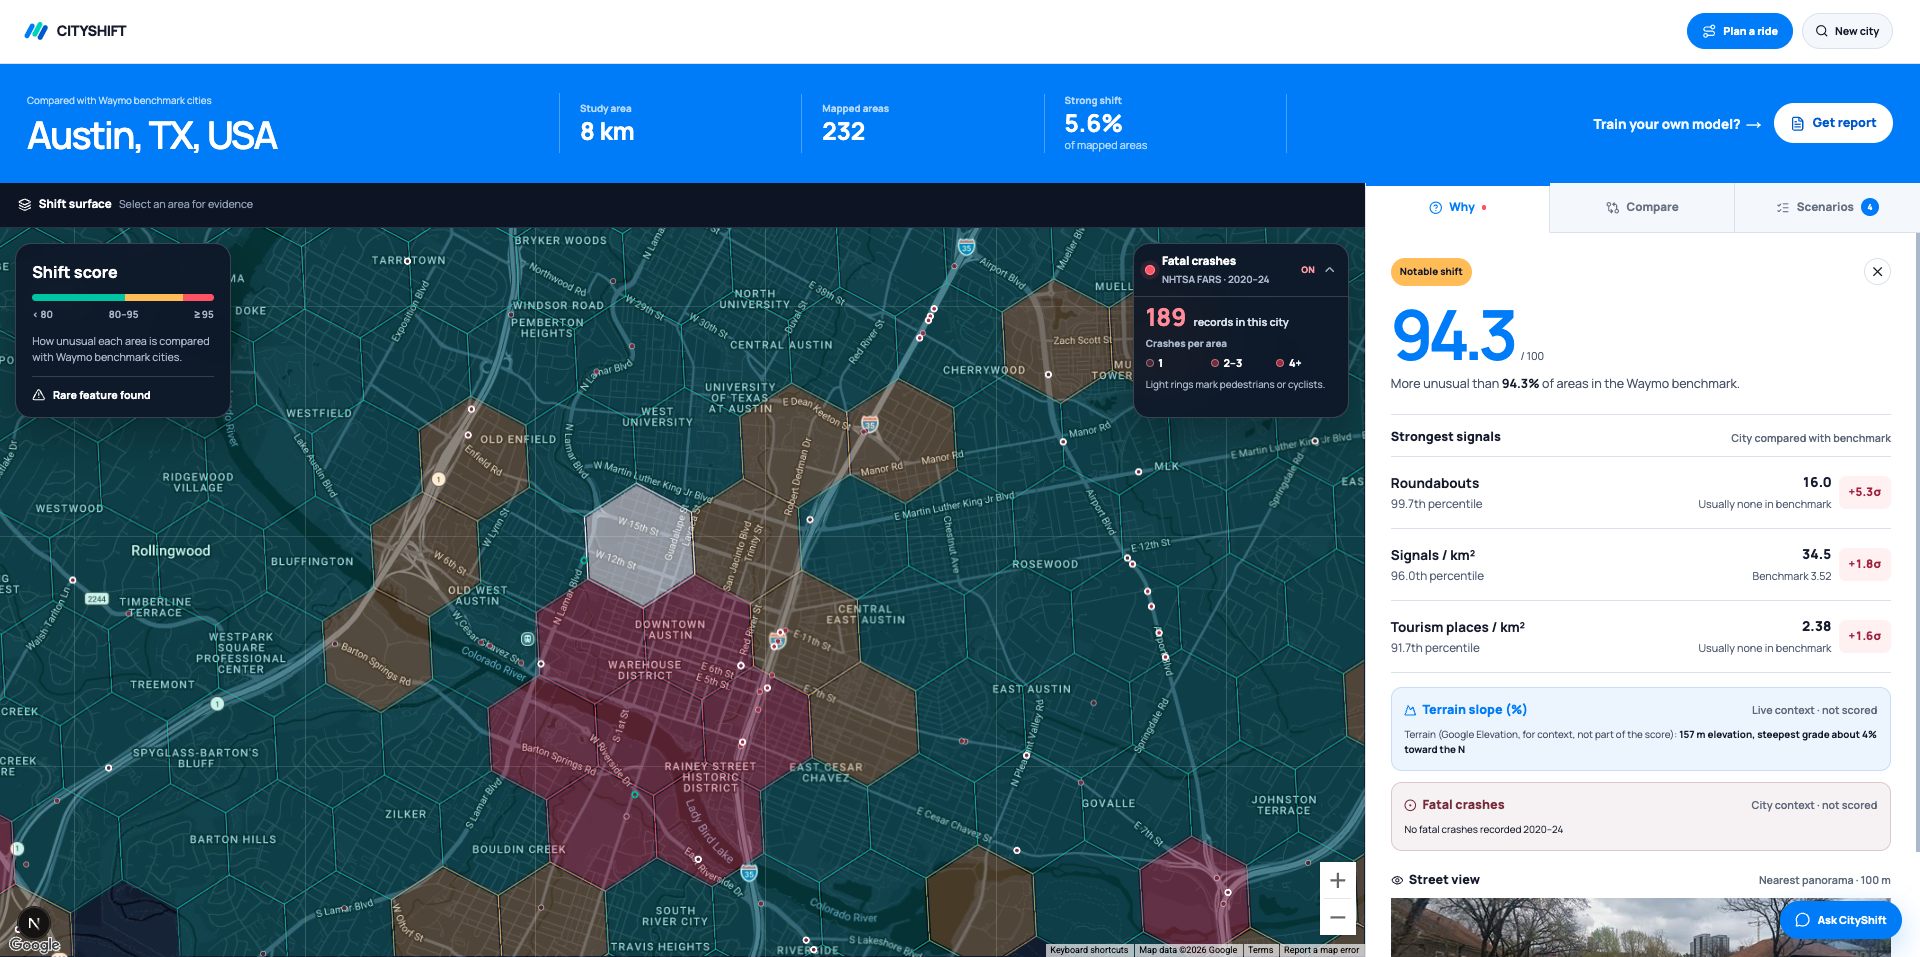
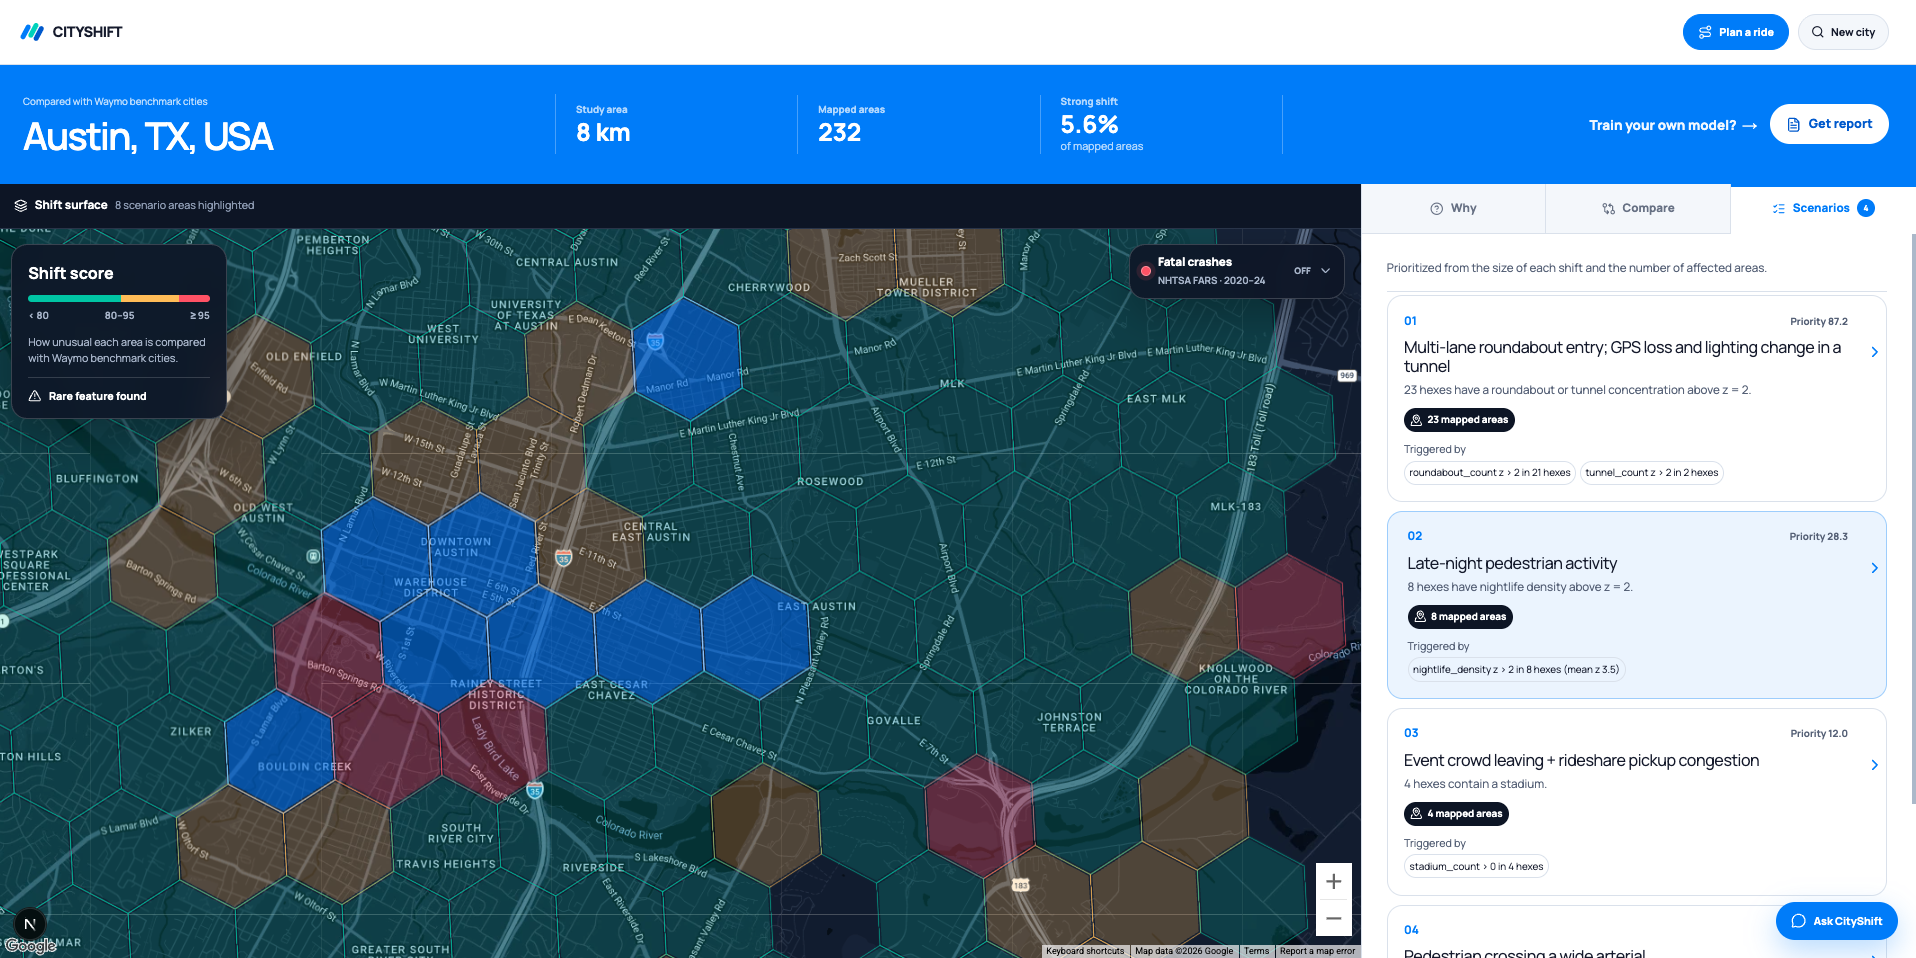
Selected area — Select a hexagon to see its Shift score and the measurements that explain it.
-
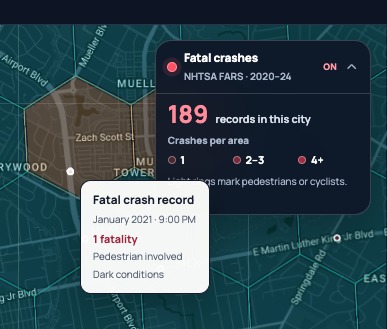
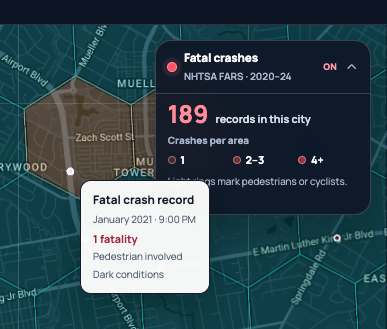
Crash history — Explore historical US fatal-crash locations as separate context on the map.
-
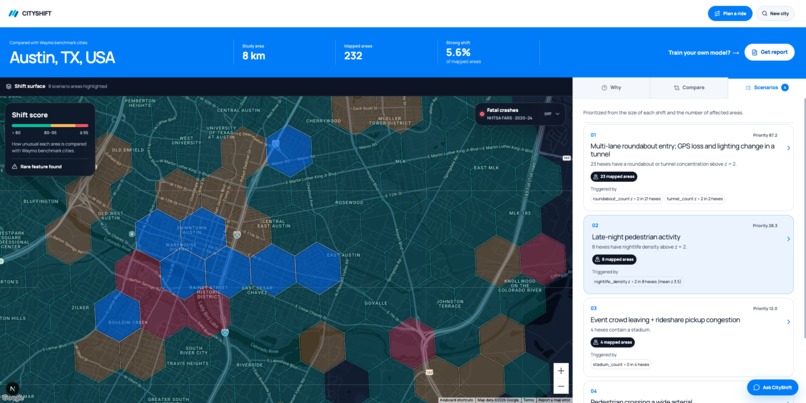
Ranked scenarios — See which local driving conditions deserve testing first and where they occur.
-
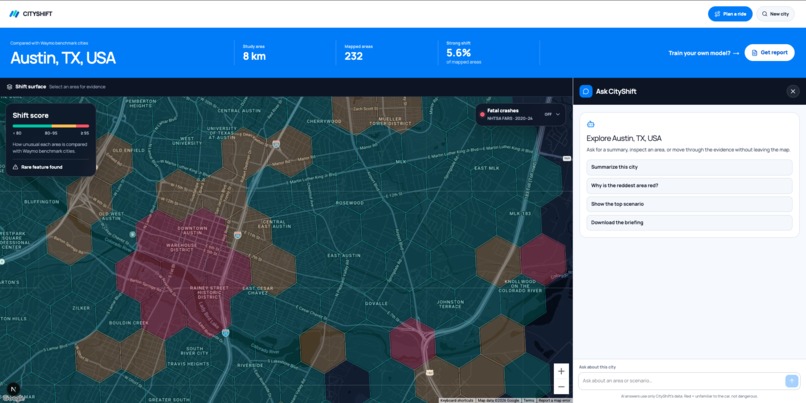
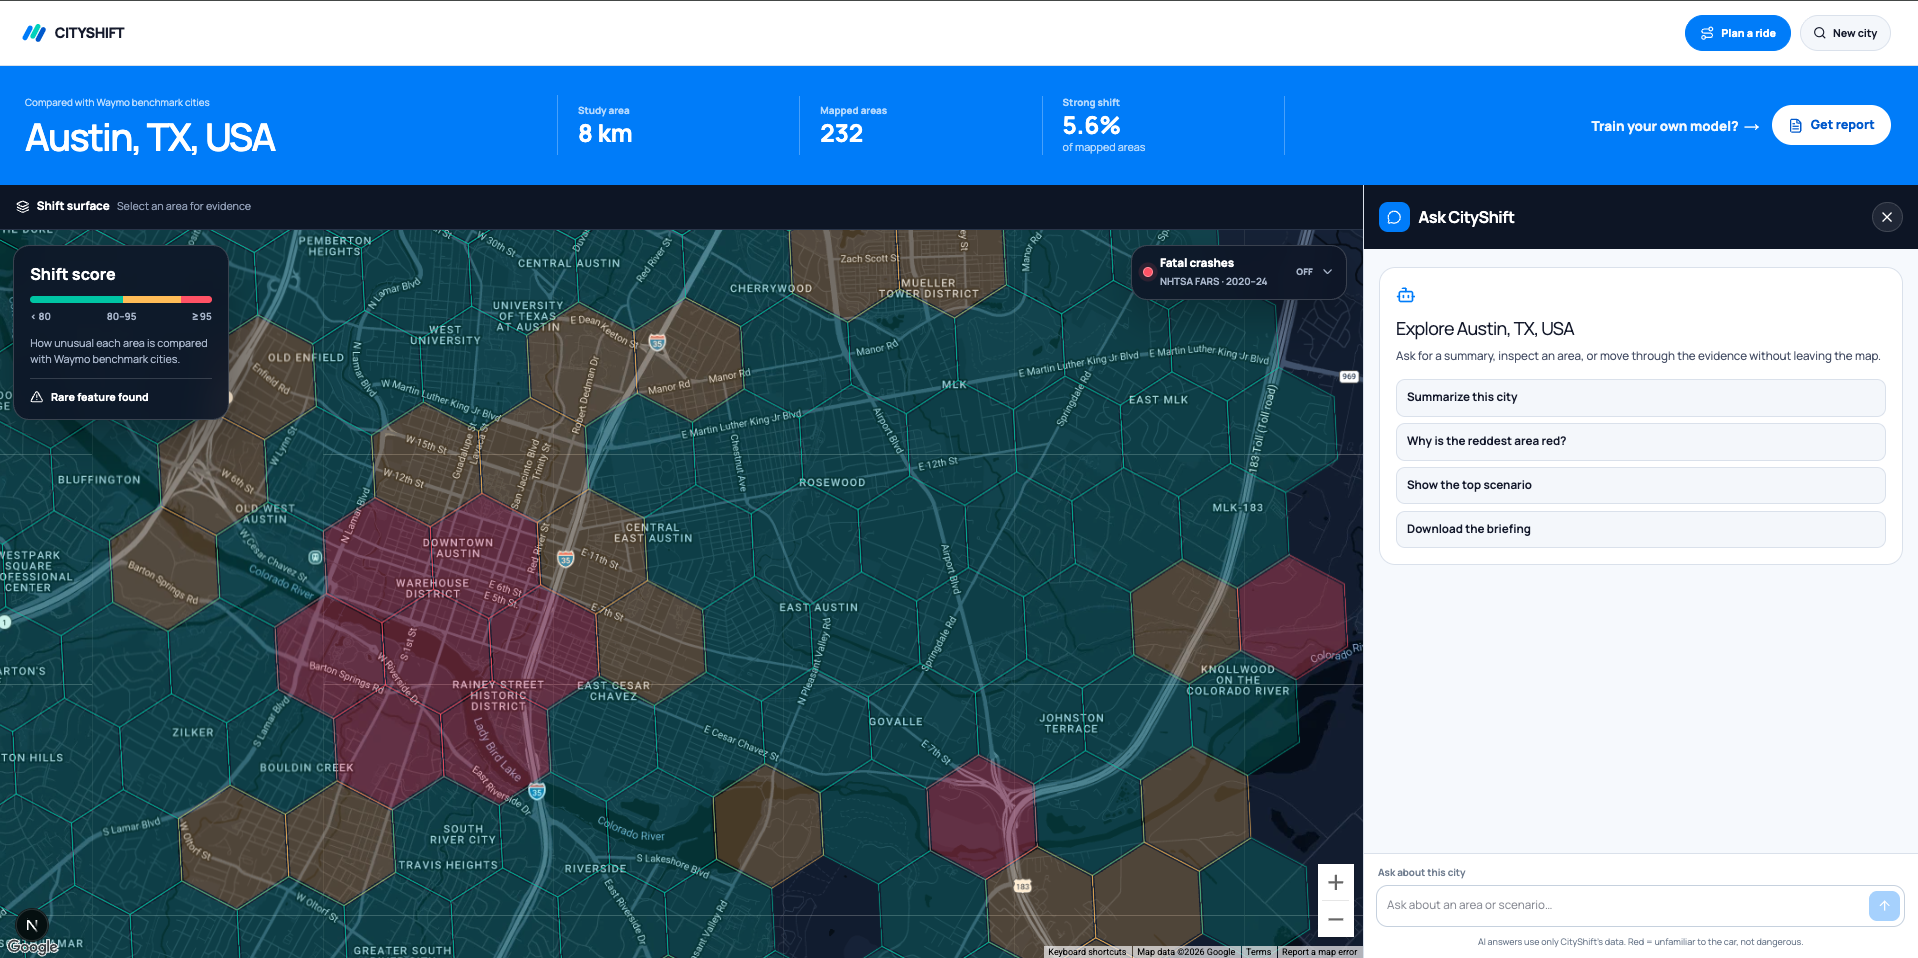
Ask CITYSHIFT — Ask questions about the city, selected areas, and test scenarios using CITYSHIFT’s data.
-
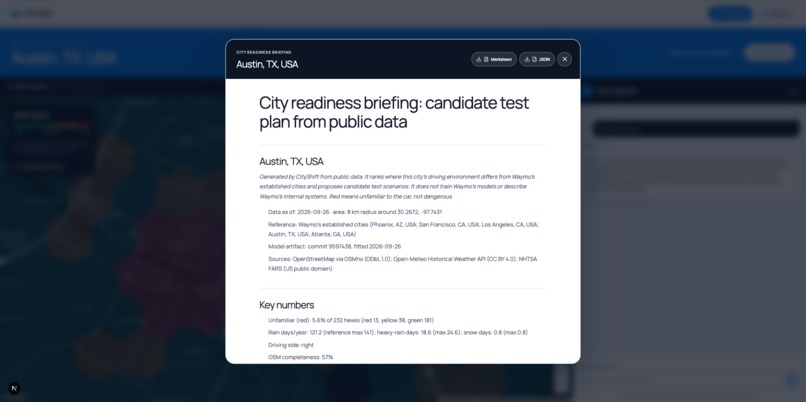
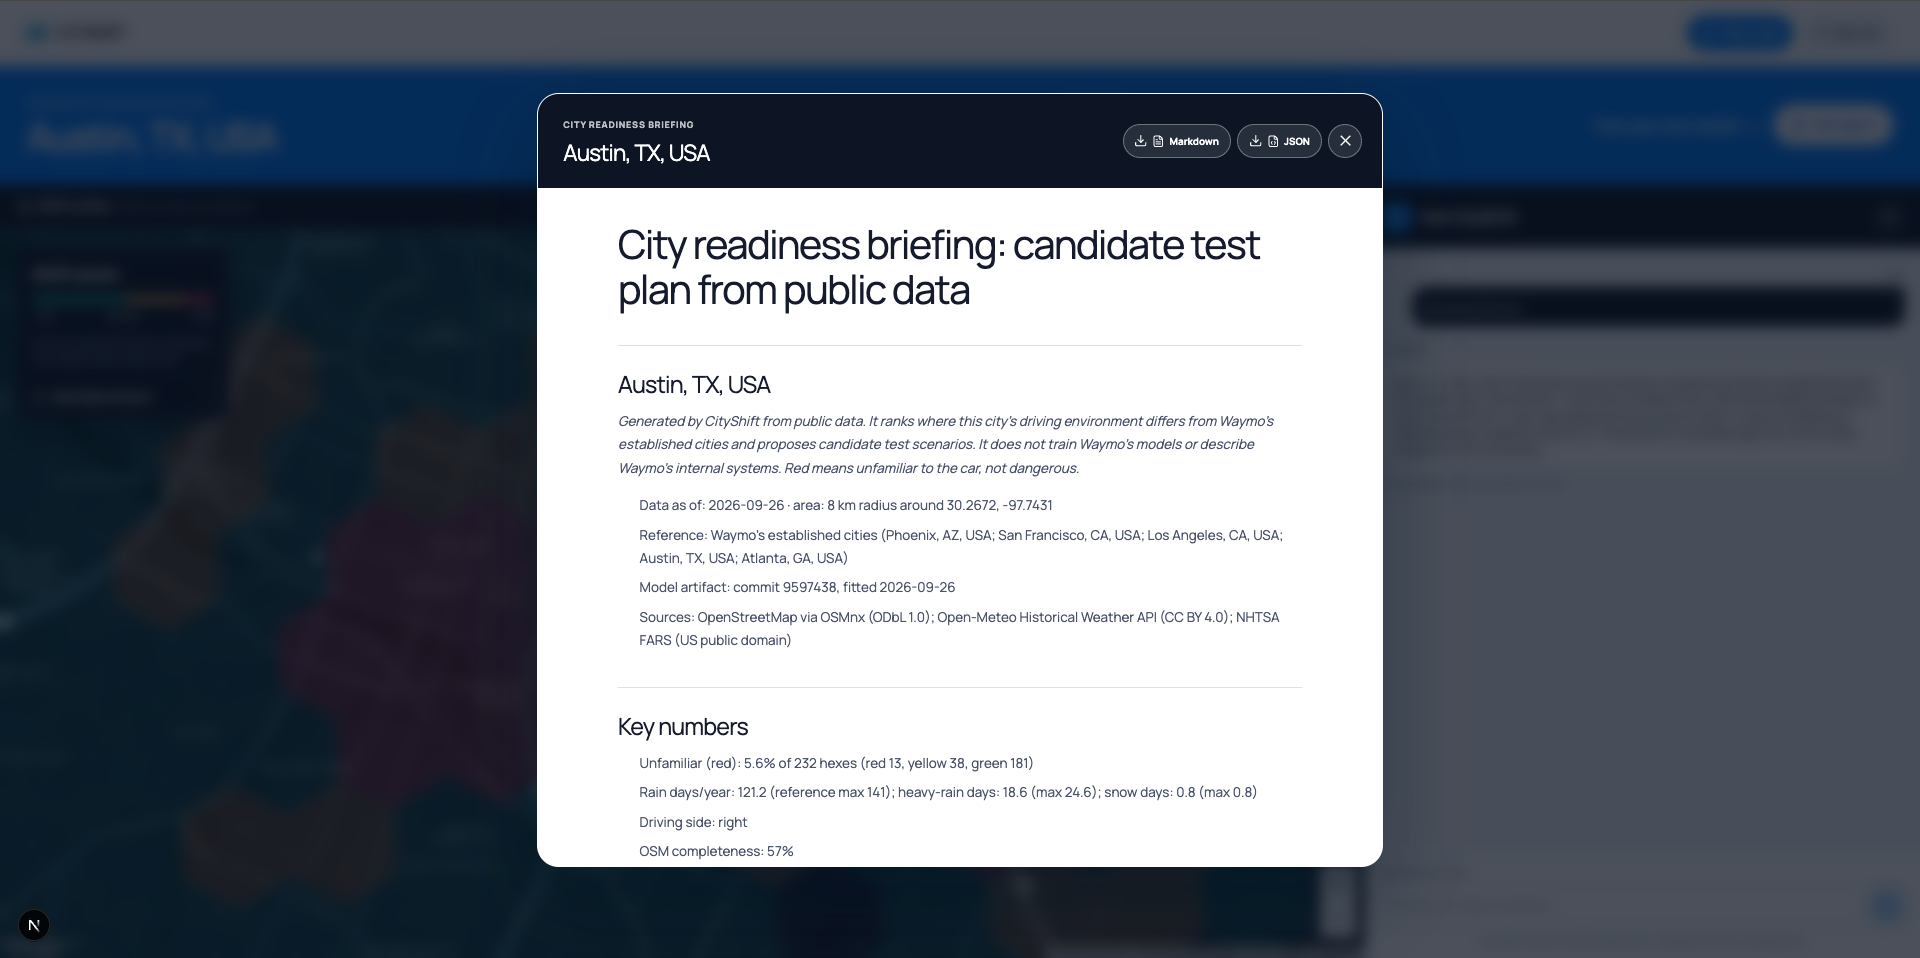
City briefing — Review and download a public-data test briefing in Markdown or JSON.
-
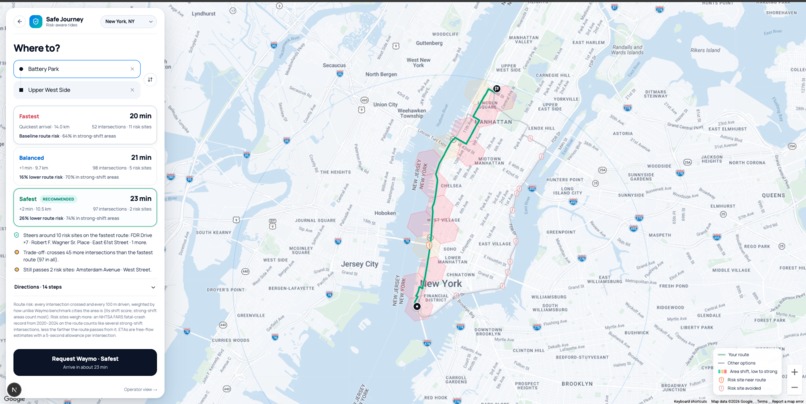
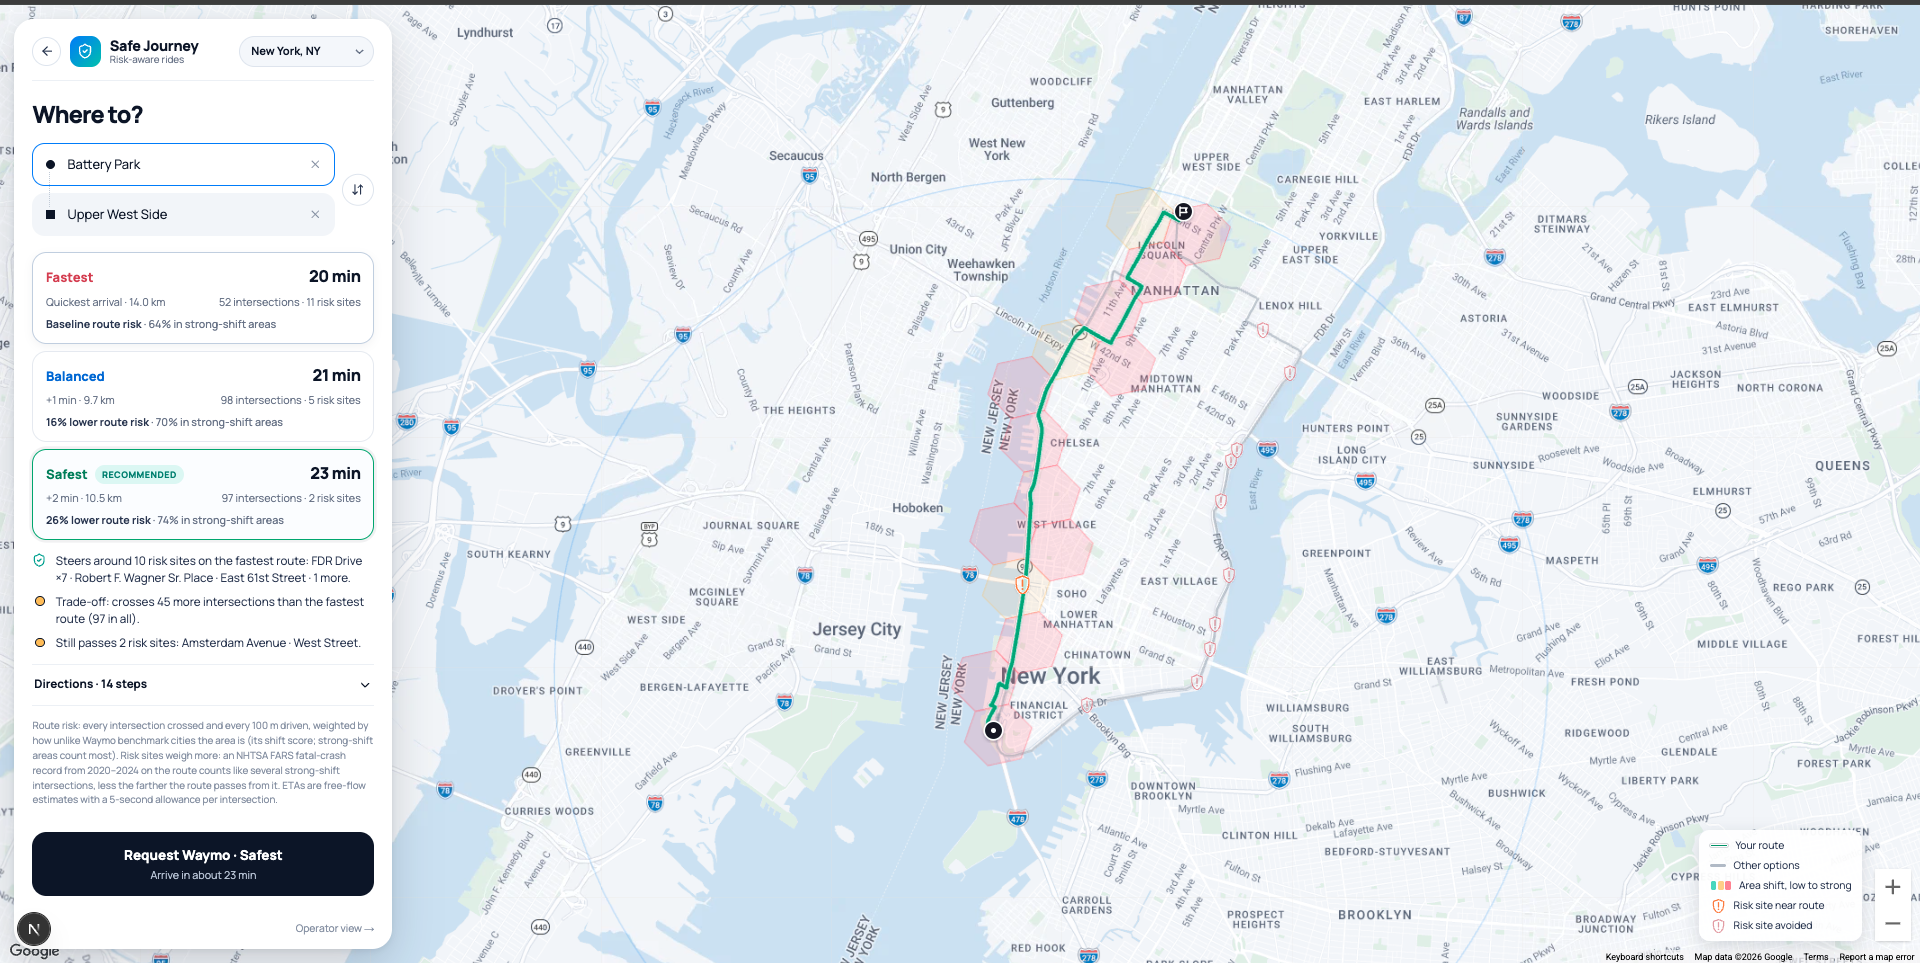
Route choices — Compare travel time and route scores based on hexagon differences and historical crash sites.
Inspiration
Waymo's autonomous driving technology has the potential to serve people in many more cities, but each city brings different roads, weather, infrastructure, and driving patterns. We built CITYSHIFT to help identify those differences and prioritize what should be tested before launching in a new city.
We also thought about older adults who may feel nervous about riding in a driverless cab. Giving riders clear route choices, and explaining those choices, can make the experience more reassuring.
What it does
Search for a city, and CITYSHIFT compares its roads, weather, infrastructure, and local activity with selected Waymo benchmark cities. It shows where the biggest differences occur and turns them into ranked driving scenarios for teams to investigate and test.
City search → local differences → evidence → ranked test scenarios → briefing
- City comparison: highlights the areas that differ most from Waymo's benchmark cities, with evidence for why each one stands out.
- Ranked test scenarios: turns those differences into prioritized driving scenarios for teams to investigate.
- Rider route options: compares routes using historical fatal-crash locations. Riders can see travel-time tradeoffs and choose a route with lower recorded crash exposure when one is available.
- Agent-generated briefings: an agent in the app writes Markdown city briefings that summarize the findings and proposed scenarios. Waymo teams could use these to guide their own data collection, simulation, testing, and model training workflows.
How we built it
CITYSHIFT combines public datasets with Google APIs:
Public data
- OpenStreetMap: roads, intersections, crossings, traffic signals, bike lanes, and infrastructure
- Open-Meteo: weather
- NHTSA FARS: historical fatal-crash locations
Google APIs
- Maps JavaScript API: the interactive map
- Places API: city search
- Elevation API: terrain and road grade
- Gemini API: the agent that writes the Markdown city briefings
CITYSHIFT divides the area around the selected city into H3 hexagonal map cells and measures features such as intersections, road types, crossings, traffic signals, bike lanes, infrastructure, and weather. It compares those measurements with benchmark areas from Phoenix, San Francisco, Los Angeles, Austin, and Atlanta.
We present the results on an interactive map, explain why each area stands out, and connect those findings to ranked test scenarios. The route feature uses historical crash locations to compare route options.
Challenges we ran into
- Uneven data detail: Public datasets vary in detail and completeness. Roads and crossings can be tied to specific locations, while weather data covers a broader area.
- Unusual ≠ dangerous: We had to make the results easy to understand without treating an unusual location as automatically dangerous.
- History ≠ prediction: We were careful not to present historical crash data as a prediction of future safety.
Accomplishments that we're proud of
- We turned public data into a clear path from city search → local differences → ranked testing scenarios.
- Every highlighted area includes evidence explaining why it stands out.
- We connected new-city planning with a rider-facing route experience and an agent that produces shareable Markdown briefings.
What we learned
Understanding a new city takes more than comparing citywide averages. Specific combinations of roads, weather, infrastructure, and activity create the scenarios that deserve attention. We also learned that showing the evidence behind each recommendation makes the results more useful for both engineering teams and riders.
What's next for CITYSHIFT
- Expand the set of benchmark cities
- Improve public-data coverage
- Make the generated briefings easier to use in simulation and testing workflows
- Improve the route experience for older adults with clearer guidance and more personalized preferences
Our goal is to help autonomous ride-hailing adapt to local conditions as it reaches more of the world.
Built With
- deck.gl
- fastapi
- gemini-api
- geopandas
- google-elevation-api
- google-maps-javascript-api
- google-places
- h3
- next.js
- nhtsa-fars
- node.js
- numpy
- open-meteo
- openstreetmap
- osmnx
- overpass-api
- pandas
- python
- react
- scikit-learn
- shapely
- tailwind-css
- typescript
- uvicorn


Log in or sign up for Devpost to join the conversation.