-
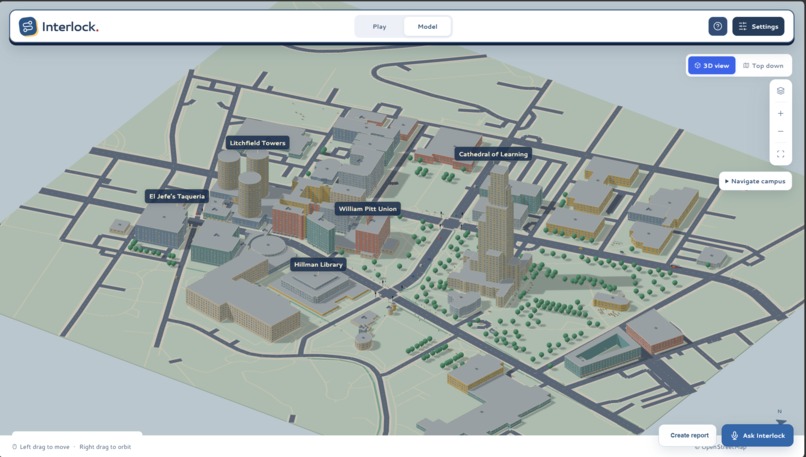
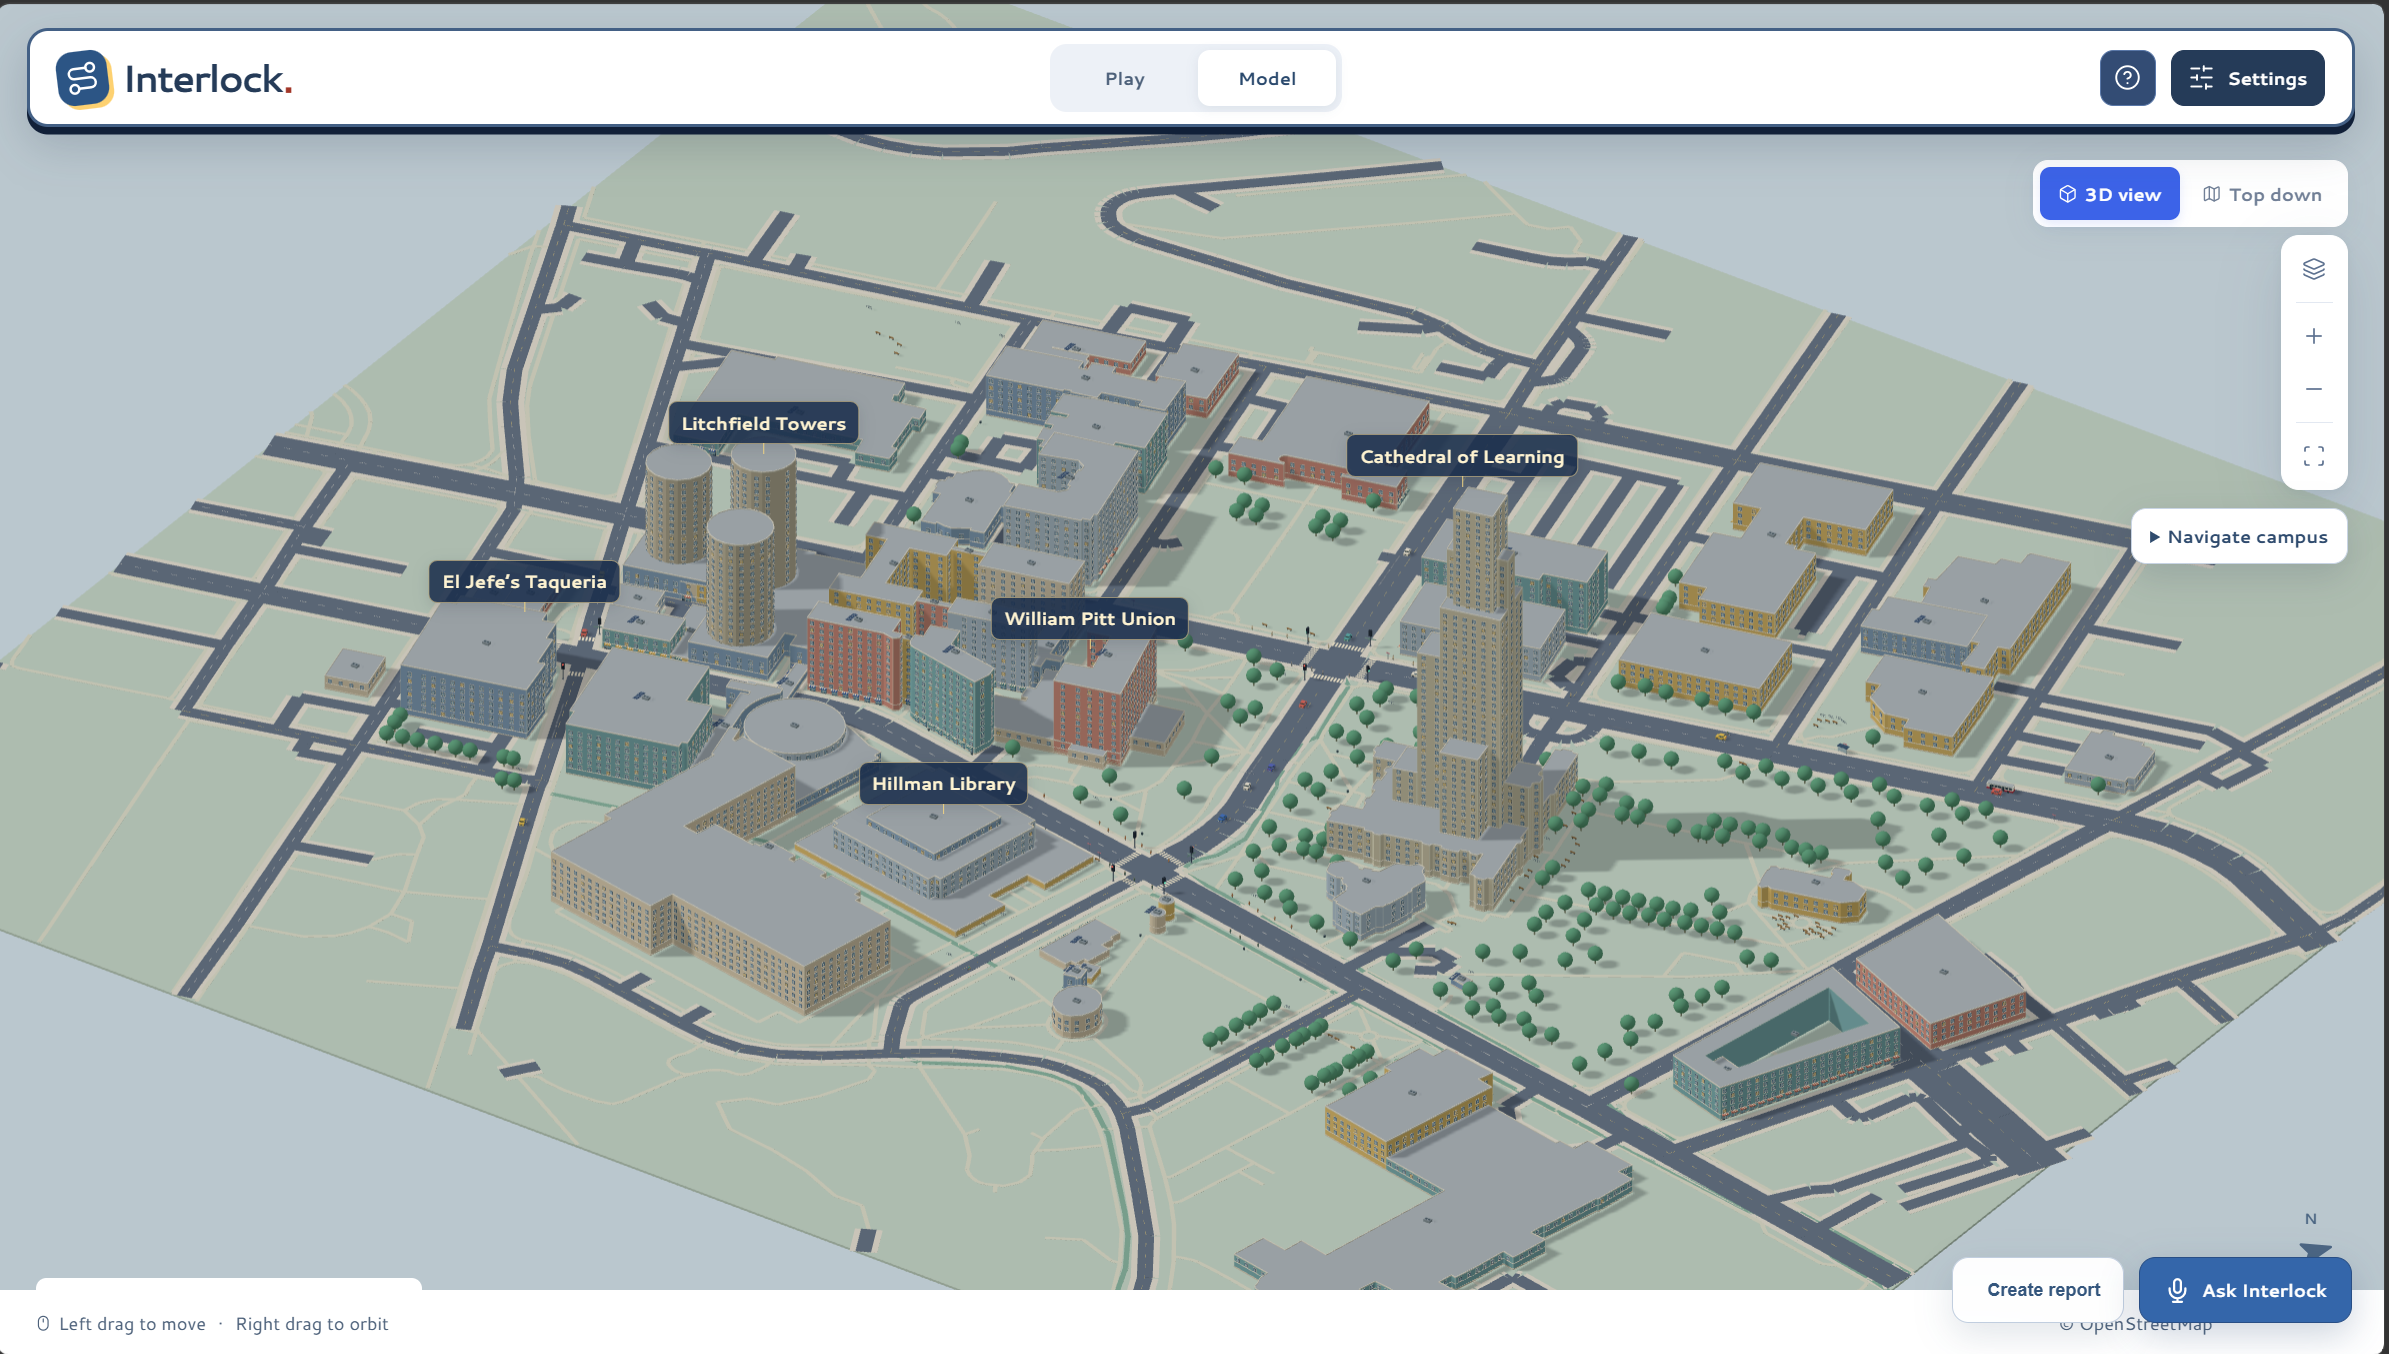
Homepage
-
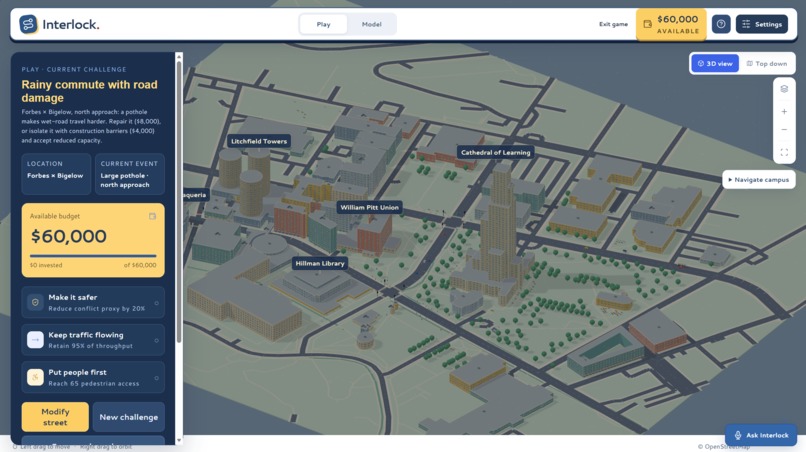
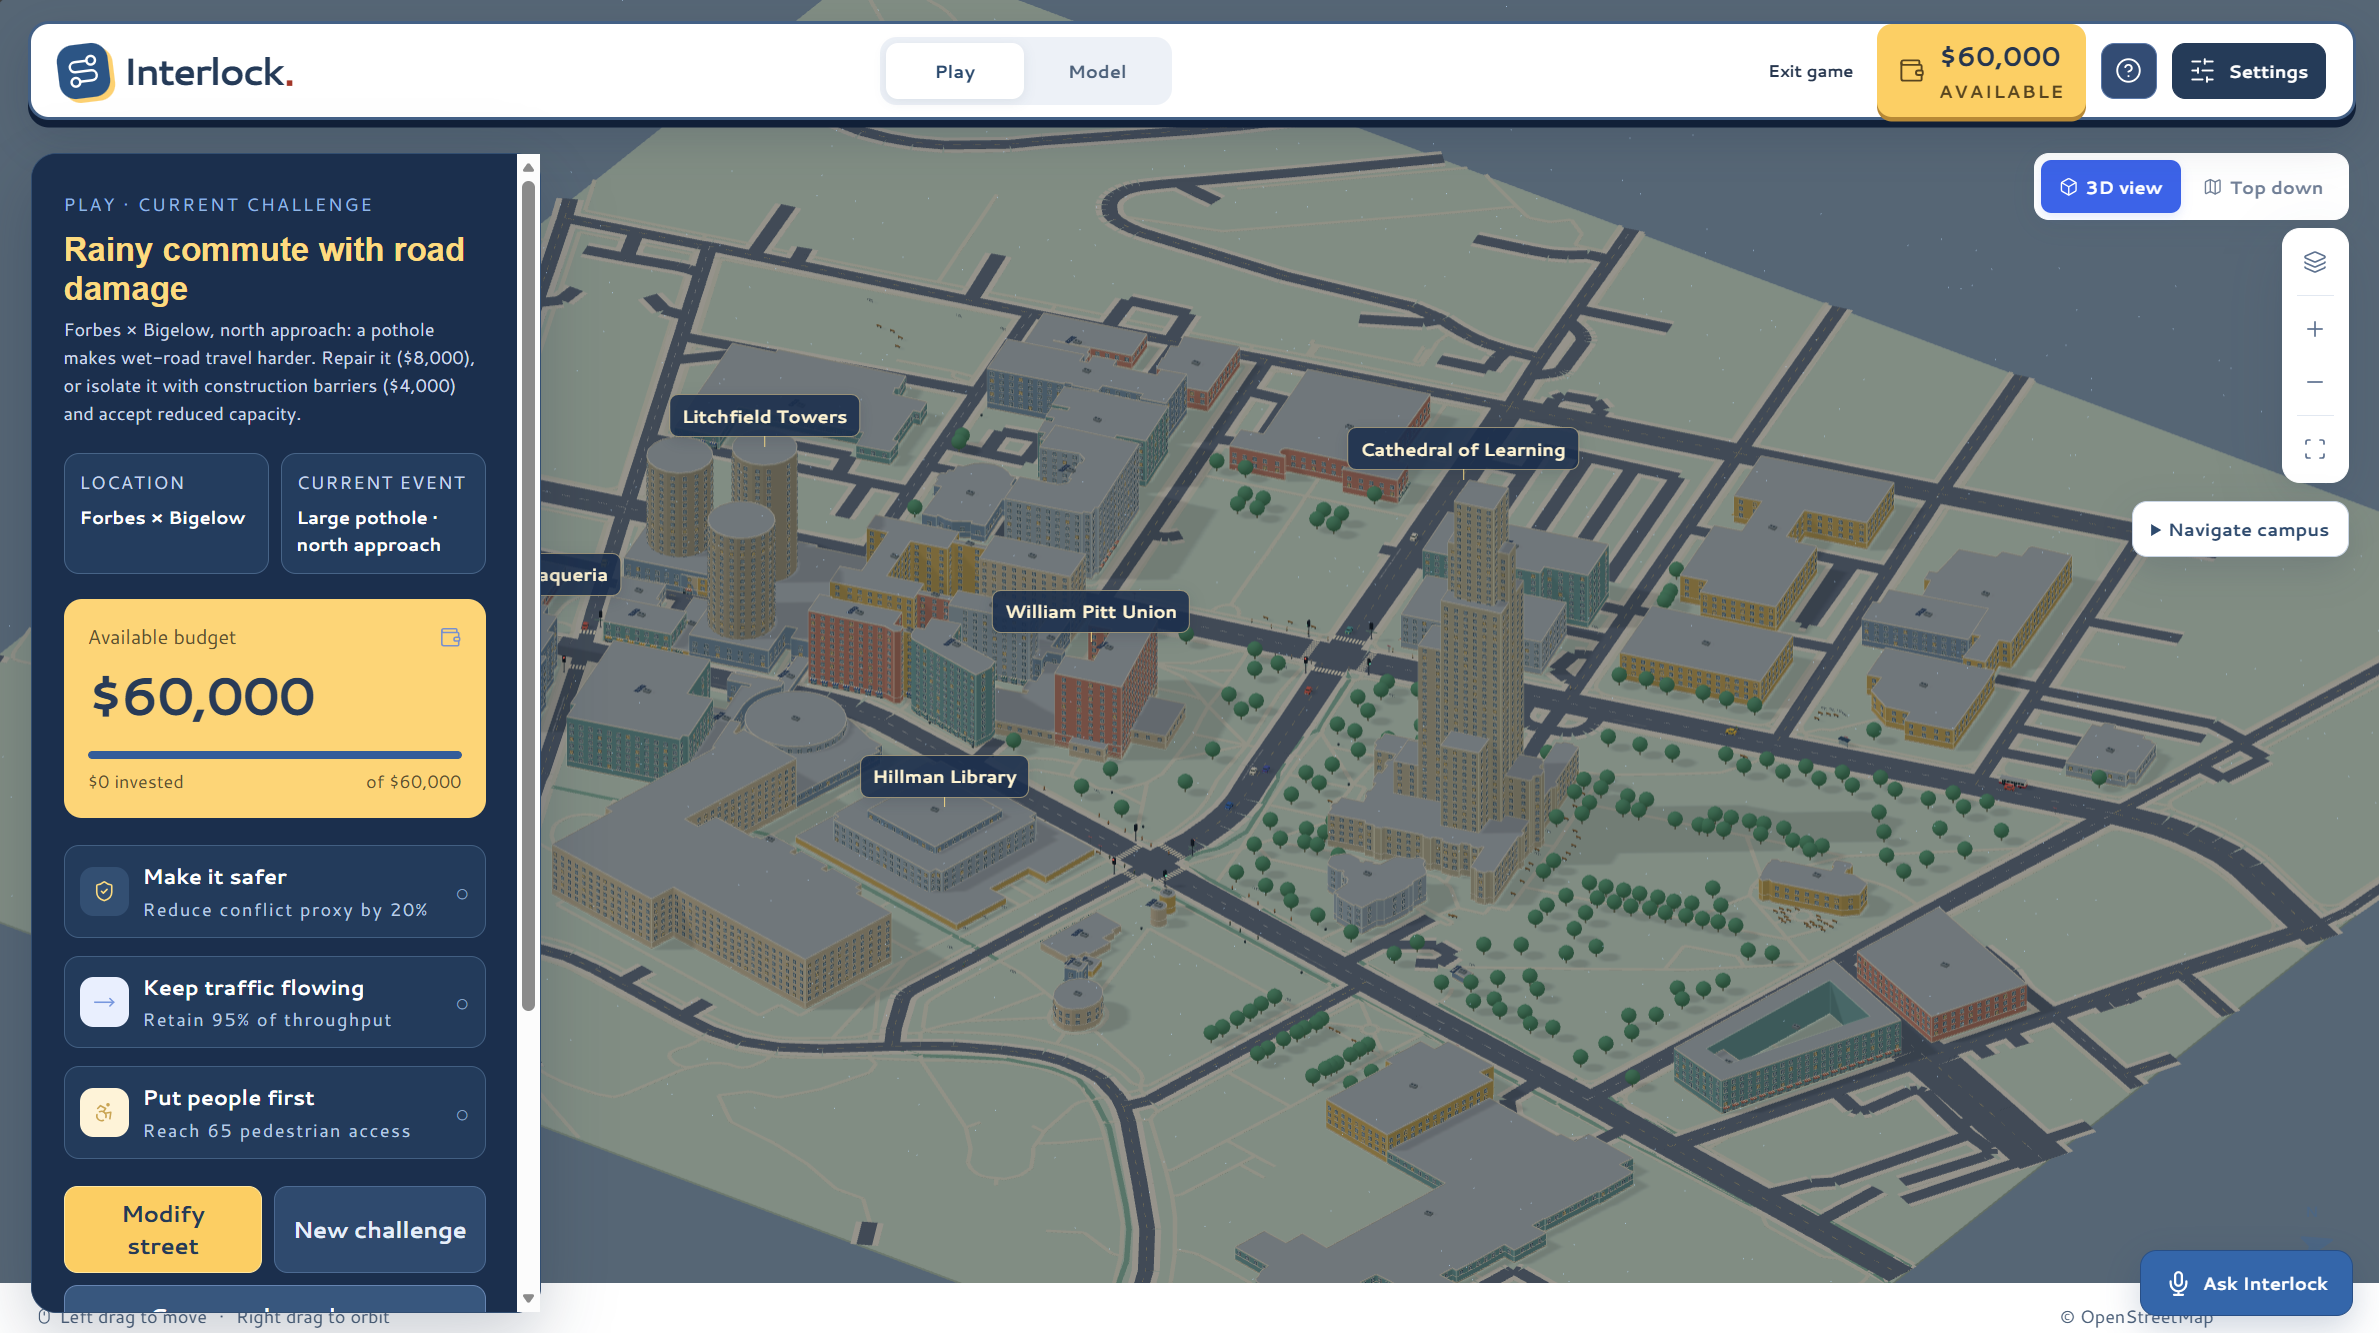
Gamemode
-
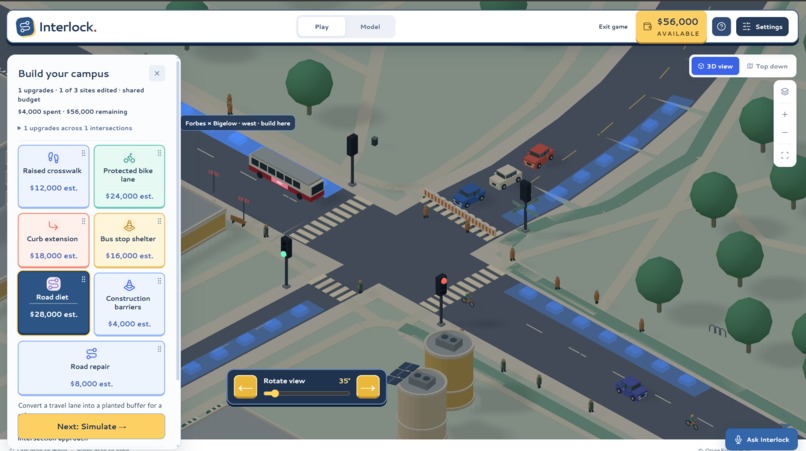
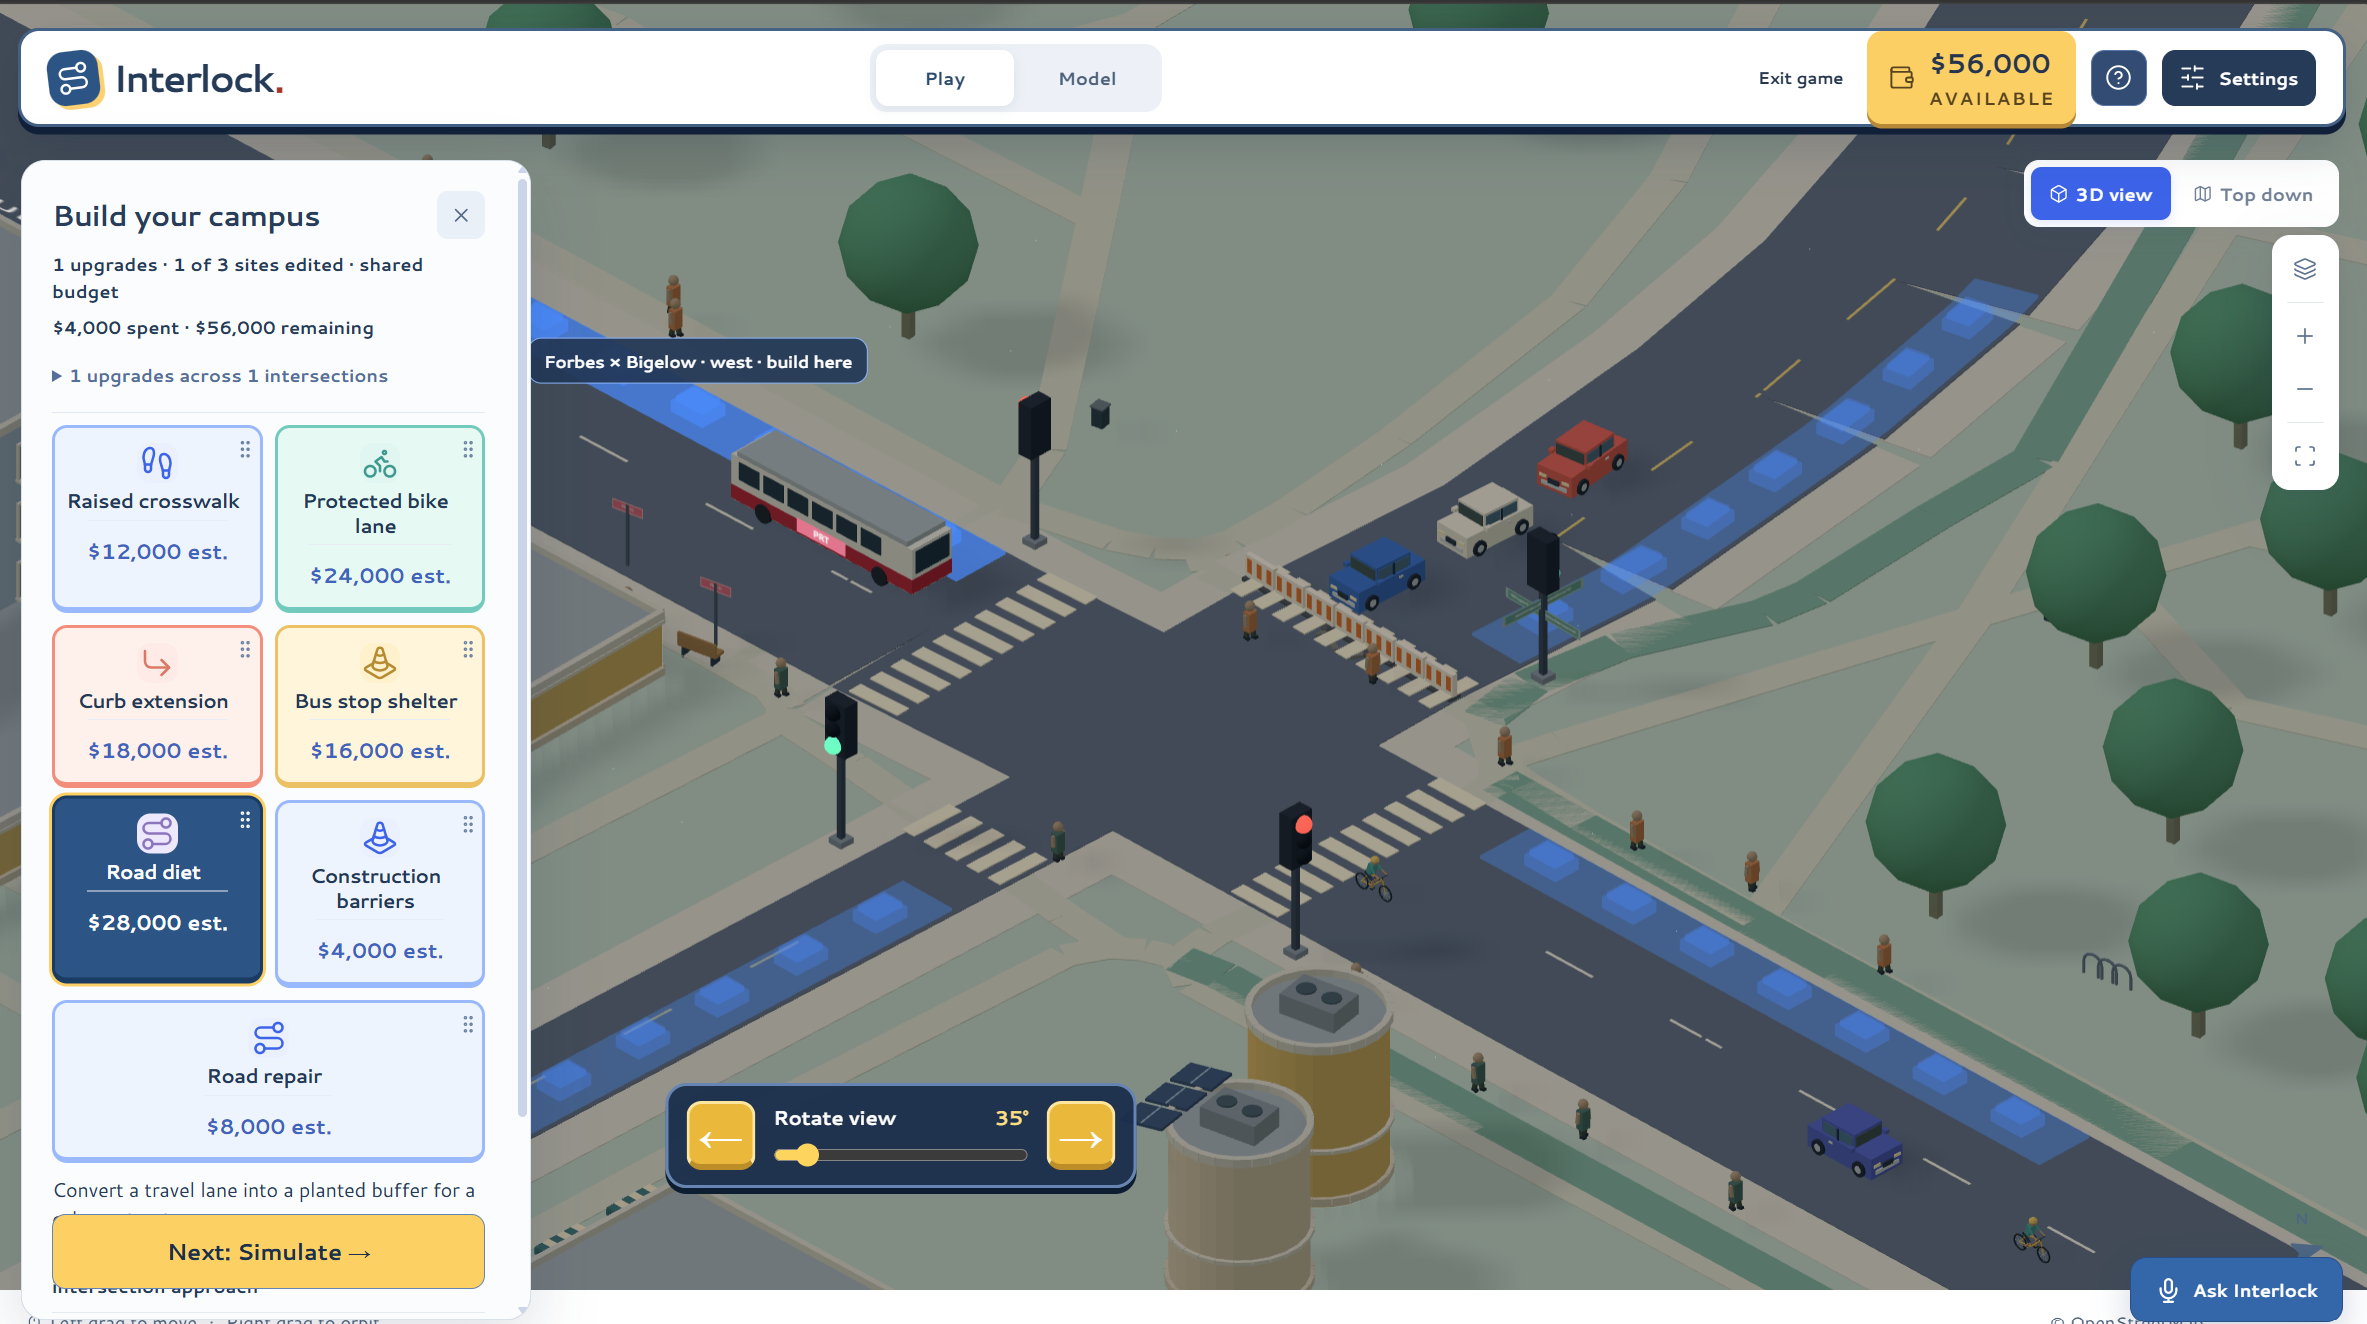
Build Mode
-
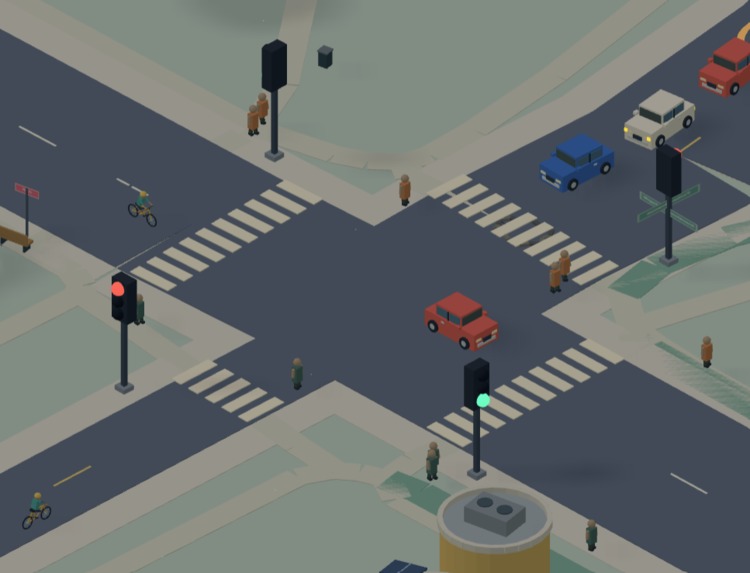
Intersection
-
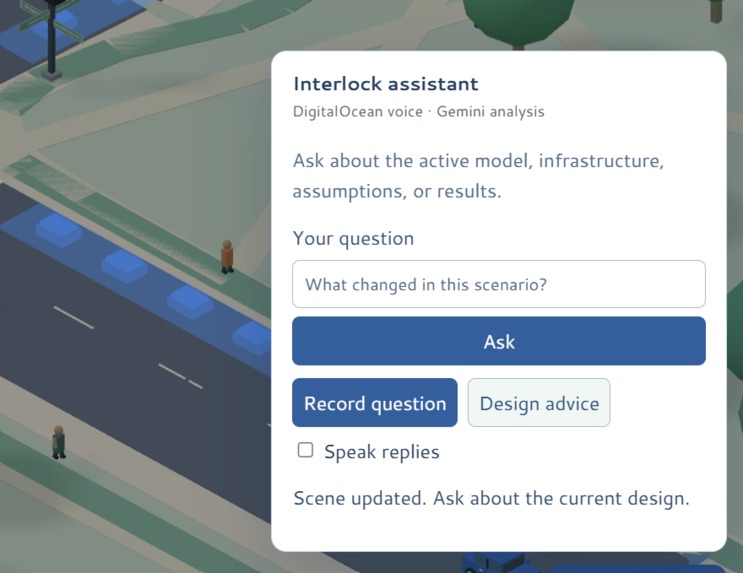
Street Assistant
Project Description
Inspiration
Cities make expensive street-design decisions using crash reports, traffic counts, static maps, and historical data. But those tools make it difficult to answer a more useful question:
What might happen before we actually change the street?
Pittsburgh was a natural place to explore this problem. Its dense neighborhoods, unusual intersections, heavy pedestrian traffic, hills, construction, and changing mobility patterns create complicated tradeoffs between safety and traffic flow.
We wanted to build something more interactive than another crash-data dashboard. What happens if construction closes a lane? What if traffic demand spikes? What if a signal changes? How does a street perform as autonomous vehicles become more common?
That led us to build Interlock, an interactive 3D sandbox for experimenting with real Pittsburgh streets.
What it does
Interlock has two ways to explore urban mobility.
Play
In Play mode, users solve transportation challenges under constraints such as a limited budget, construction, traffic, or weather conditions.
Players can redesign a street, test their changes, and compare the result against the original scenario. The interface makes tradeoffs between safety, delay, throughput, pedestrian movement, and cost visible.
Instead of simply showing a “correct” answer, Interlock encourages users to iterate:
Design → Simulate → Compare → Improve
Model
In Model mode, Interlock acts as a transportation simulation sandbox.
Users can explore scenarios involving:
- traffic demand
- pedestrian activity
- signal timing
- construction and lane closures
- weather conditions
- infrastructure changes
- autonomous-vehicle adoption
The simulation compares a baseline scenario with a modified scenario and reports physical traffic metrics such as speed, delay, throughput, pedestrian wait time, and Time-to-Collision (TTC) conflict indicators.
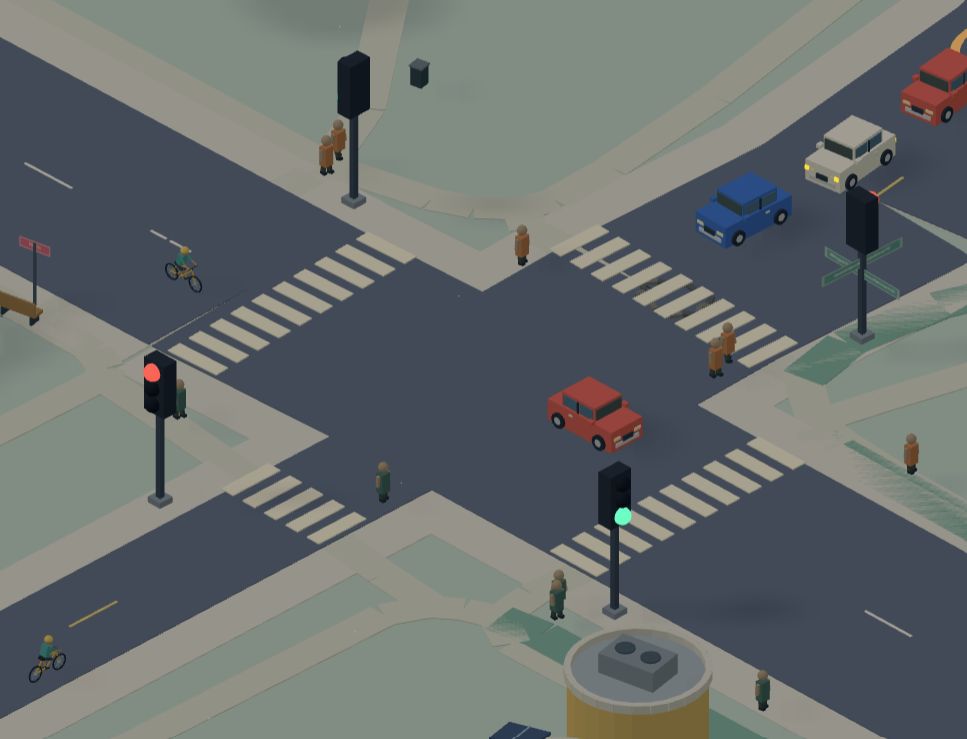
A 3D replay visualizes simulated vehicles, pedestrians, signals, and near-miss events directly on the Pittsburgh street network.
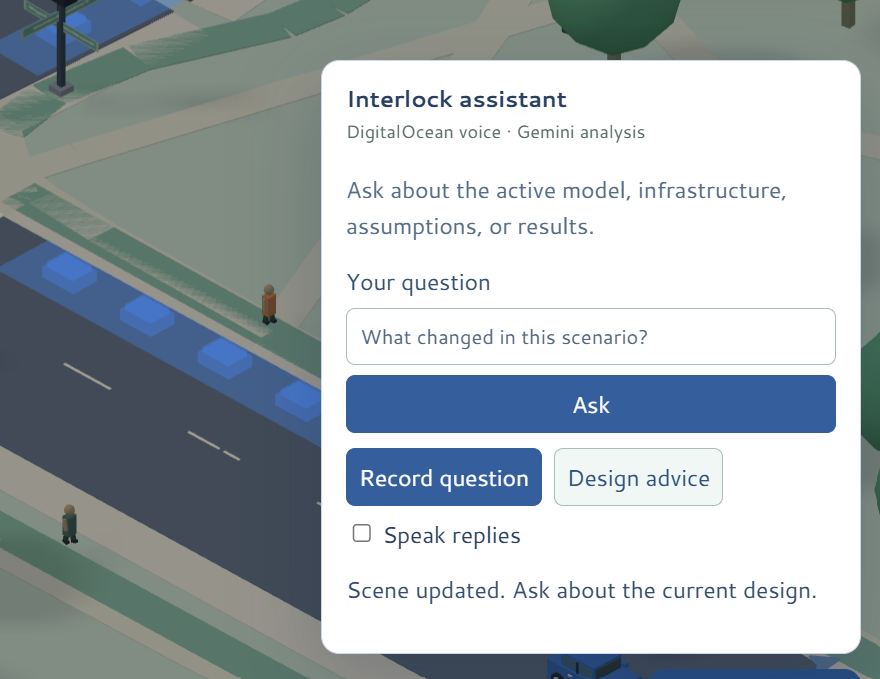
Interlock also includes a street assistant. Gemini helps explain simulation results and scenario tradeoffs, while ElevenLabs provides a spoken interface for asking questions and hearing street information aloud.
How we built it
Interlock combines real transportation data, microscopic traffic simulation, and an interactive 3D frontend.
Data
We built a Python data pipeline using Pittsburgh and Allegheny County transportation datasets, including:
- crash records
- traffic-count observations
- intersection and road geometry
- road-design information
- weather data
We normalize and store this information in PostgreSQL / Tiger Data, which also stores high-frequency simulation outputs and time-series traffic measurements.
Simulation
The simulation engine is written in Python using SUMO and TraCI.
SUMO models individual vehicles, pedestrians, lanes, signals, and intersection behavior. We run repeated Monte Carlo trials with matched random seeds so baseline and modified street designs can be compared under similar traffic conditions.
The engine measures:
- vehicle speed
- delay
- throughput
- pedestrian waiting time
- vehicle–vehicle TTC conflicts
- vehicle–pedestrian TTC conflicts
TTC is treated as a surrogate conflict metric, not a prediction of future crashes.
We also built a replay contract that exports real SUMO trajectories, pedestrian states, signal states, and TTC events for visualization.
3D frontend
The web interface is built with Three.js, JavaScript, and Vite.
Real street geometry is rendered as an interactive 3D environment. Rather than showing a separate illustrative animation, the frontend can replay actual SUMO simulation output, including vehicles, pedestrians, traffic signals, and conflict events.
API and AI
A FastAPI service connects the frontend to the Python simulation engine.
Gemini 2.5 Flash receives application context and computed simulation results to explain outcomes and help users reason about their design choices. The calculations themselves remain in the simulation code rather than being generated by the model.
ElevenLabs provides speech input and spoken responses for the street assistant.
Challenges we faced
The hardest part was connecting several systems that represent the same street in very different ways.
OpenStreetMap geometry, Pittsburgh datasets, SUMO networks, Three.js coordinates, traffic observations, and game scenarios all use different formats and assumptions. We had to create consistent definitions for intersections, approaches, traffic conditions, interventions, and simulation results.
Another challenge was keeping different kinds of results clearly separated.
Observed traffic data, simulated vehicle behavior, near-miss indicators, and game scores do not mean the same thing. We designed the system so that physical simulation metrics remain distinguishable from gameplay abstractions and historical observations.
Connecting SUMO to the 3D frontend was also a major integration challenge. We built a shared replay format containing stable vehicle and pedestrian IDs, geographic coordinates, signal timelines, and TTC events, then projected those results back onto the interactive map.
Finally, traffic simulation involves a huge number of possible parameters. We had to decide which controls were meaningful to expose while keeping the interface understandable.
What we learned
Interlock taught us how different transportation data sources can be combined with microscopic simulation to study a real physical system.
We learned how to:
- build and control SUMO traffic simulations with TraCI
- process geospatial transportation data
- model vehicle and pedestrian interactions
- run Monte Carlo scenario comparisons
- store simulation time-series data in Tiger Data
- replay simulation trajectories in Three.js
- connect a Python simulation engine to a web application
- use generative AI to explain results without making it responsible for the underlying calculations
Most importantly, we learned that transportation design rarely has one perfect answer.
A change that improves pedestrian safety may increase vehicle delay. Construction may redirect traffic into nearby streets. Future autonomous vehicles may change traffic behavior in ways current infrastructure was not designed for.
Interlock makes those tradeoffs something users can actually see, test, and explore.
What's next
Our current prototype focuses on a small number of Pittsburgh intersections and selected scenario types.
With more time, we would expand Interlock to:
- larger connected street networks
- more Pittsburgh intersections
- richer autonomous-vehicle behavior models
- additional infrastructure interventions
- stronger calibration using local traffic observations
- corridor-level traffic effects
- more detailed construction and weather scenarios
Our long-term goal is to make Interlock a sandbox where planners, researchers, students, and residents can explore how today's street decisions affect tomorrow's city.
Built With
- docker
- elevenlabs
- fastapi
- fasttiger
- gemini
- geopandas
- javascript
- openstreetmap
- pandas
- playwright
- pytest
- python
- sumo
- three.js
- tigerdata
- traci
- uvicorn
- vite
- wprdc


Log in or sign up for Devpost to join the conversation.