-
-
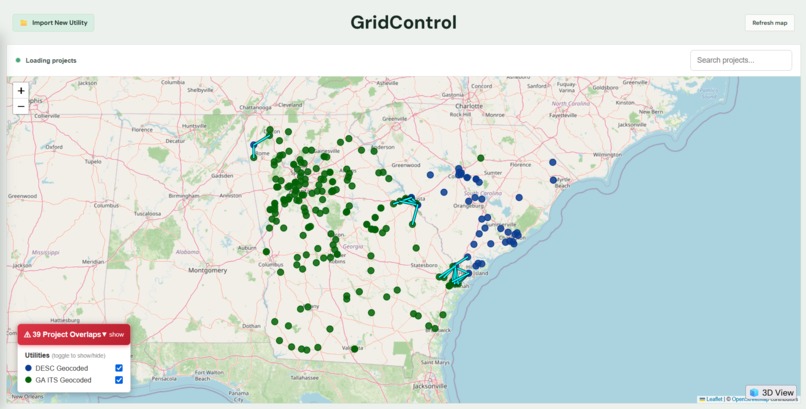
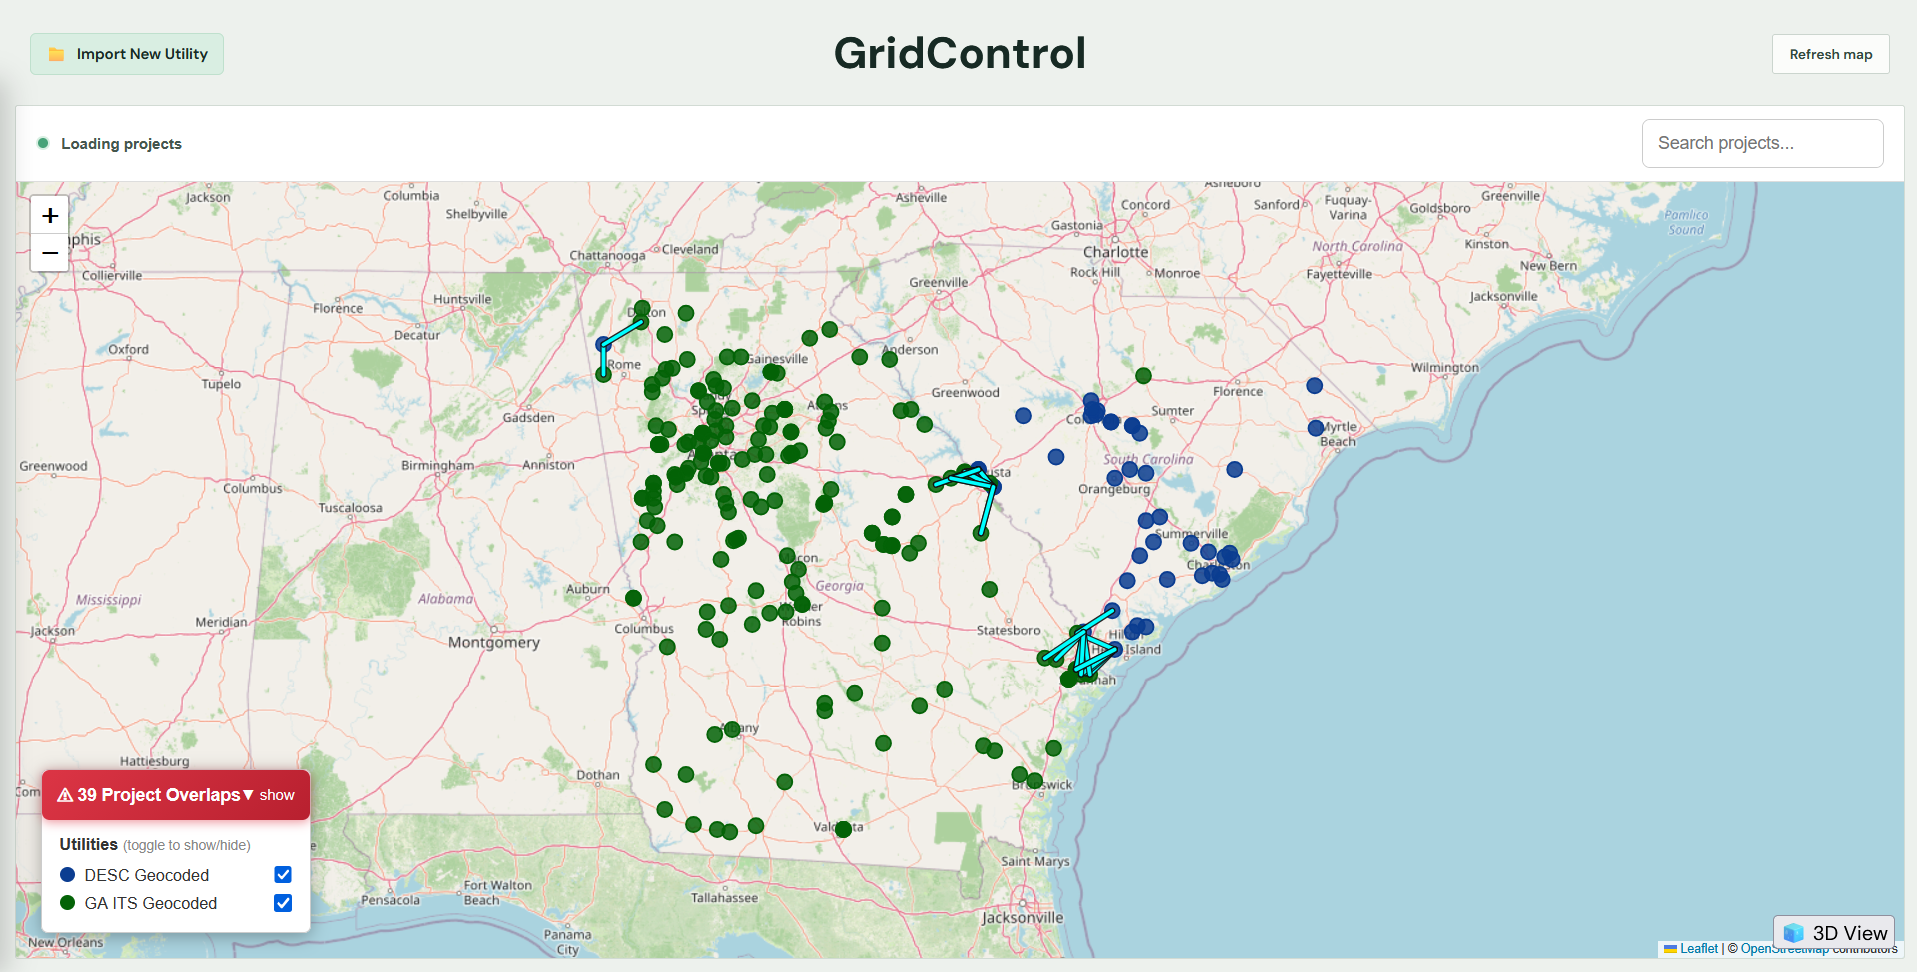
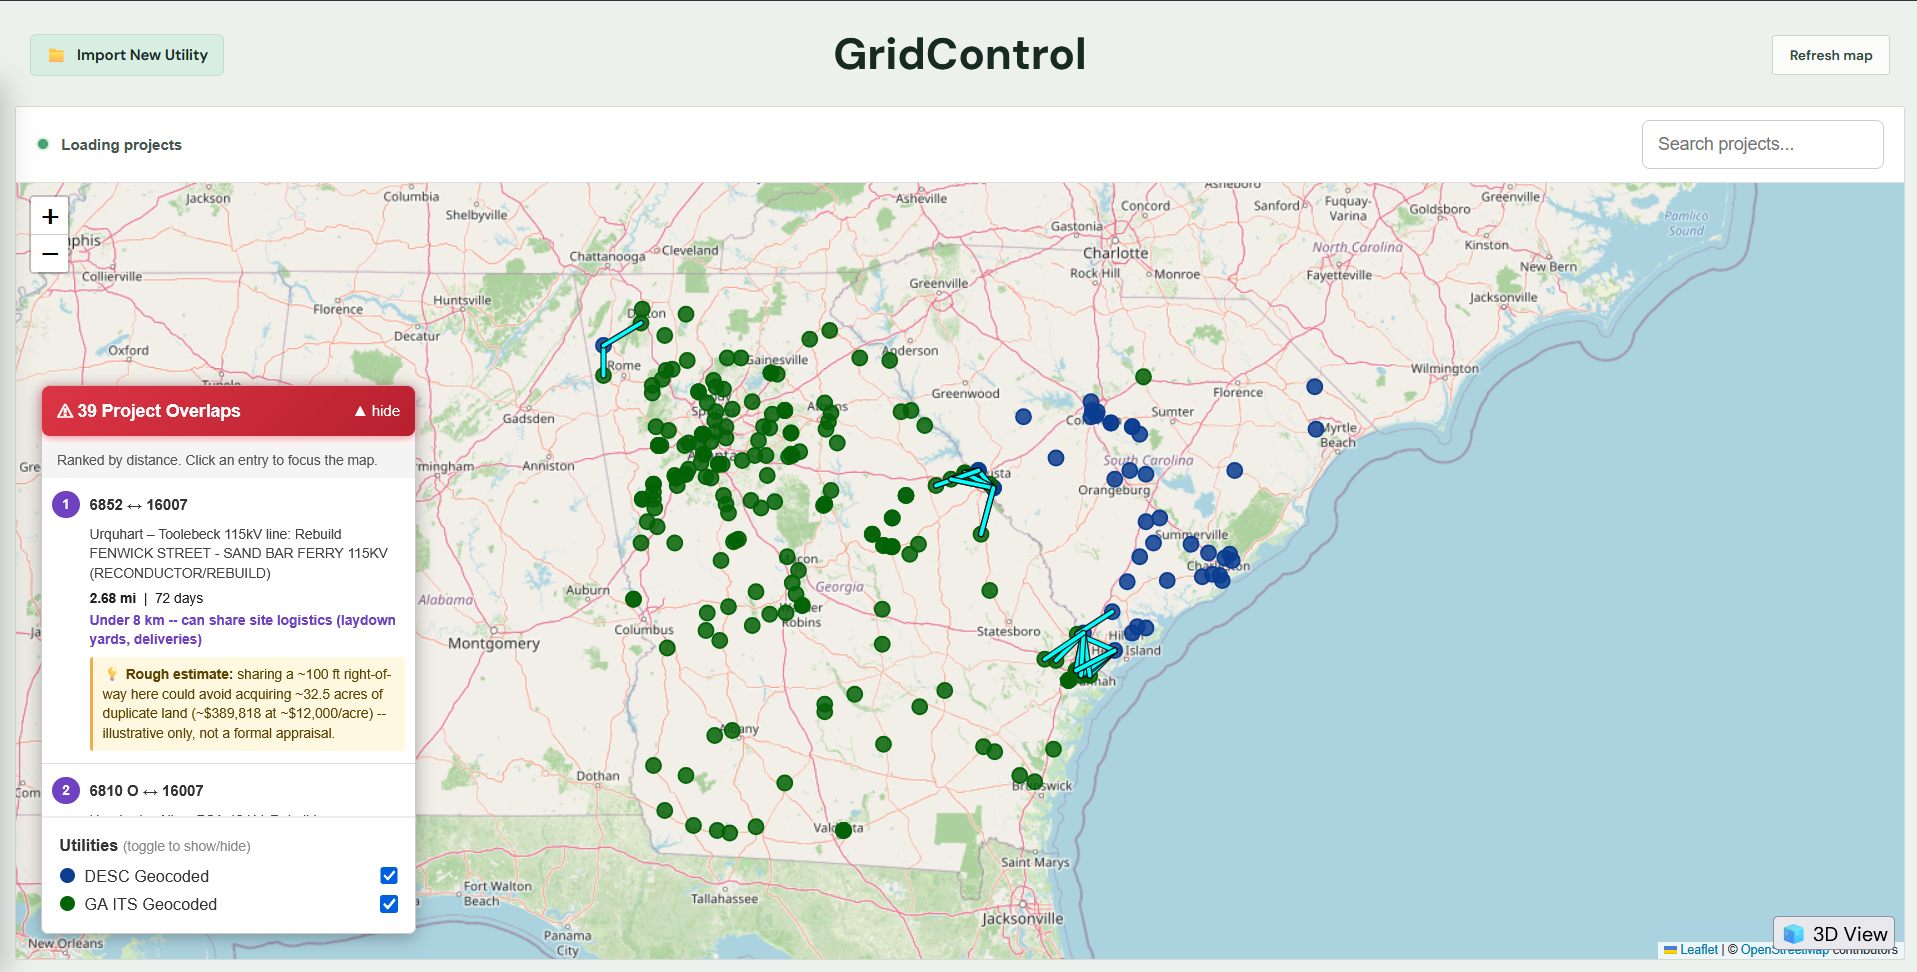
GridControl 2D Overview
-
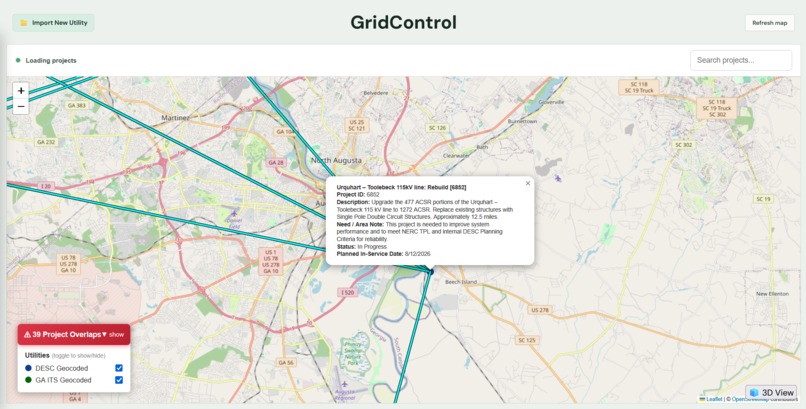
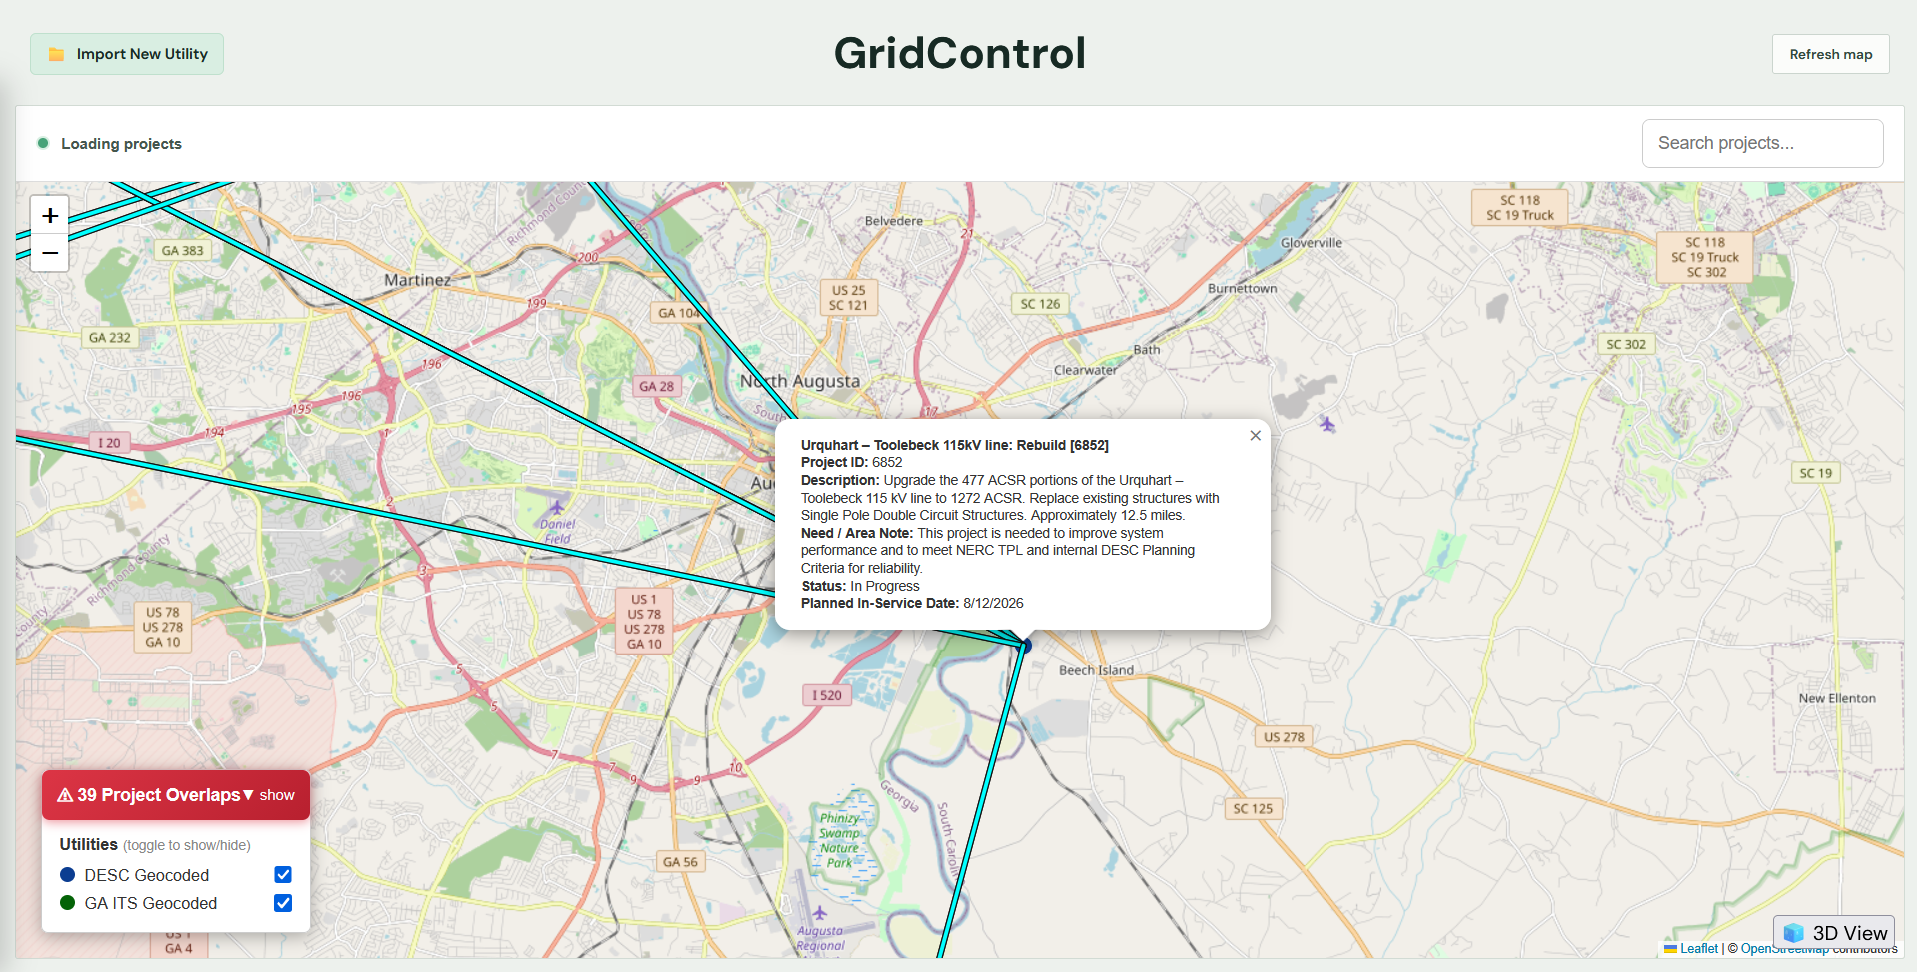
GridControl 2D Infobox
-
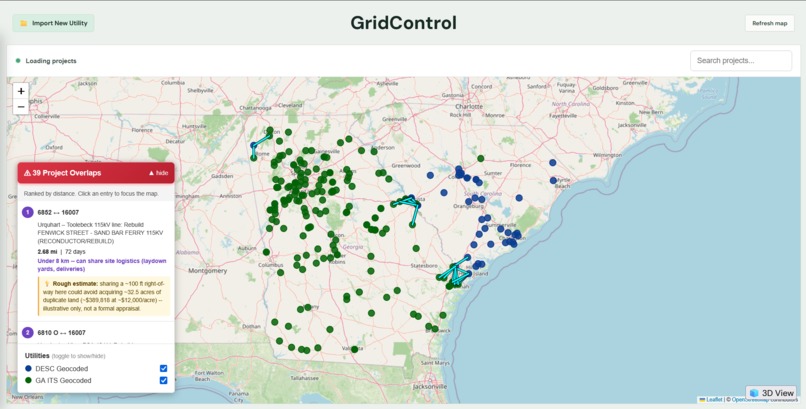
GridControl 2D Overlap Ranking Chart
-
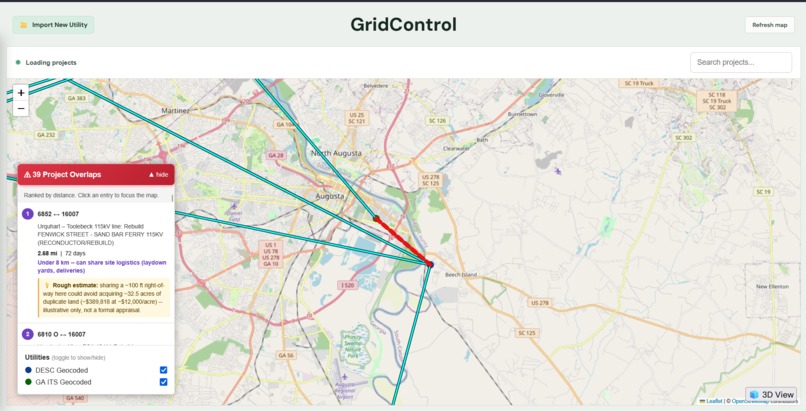
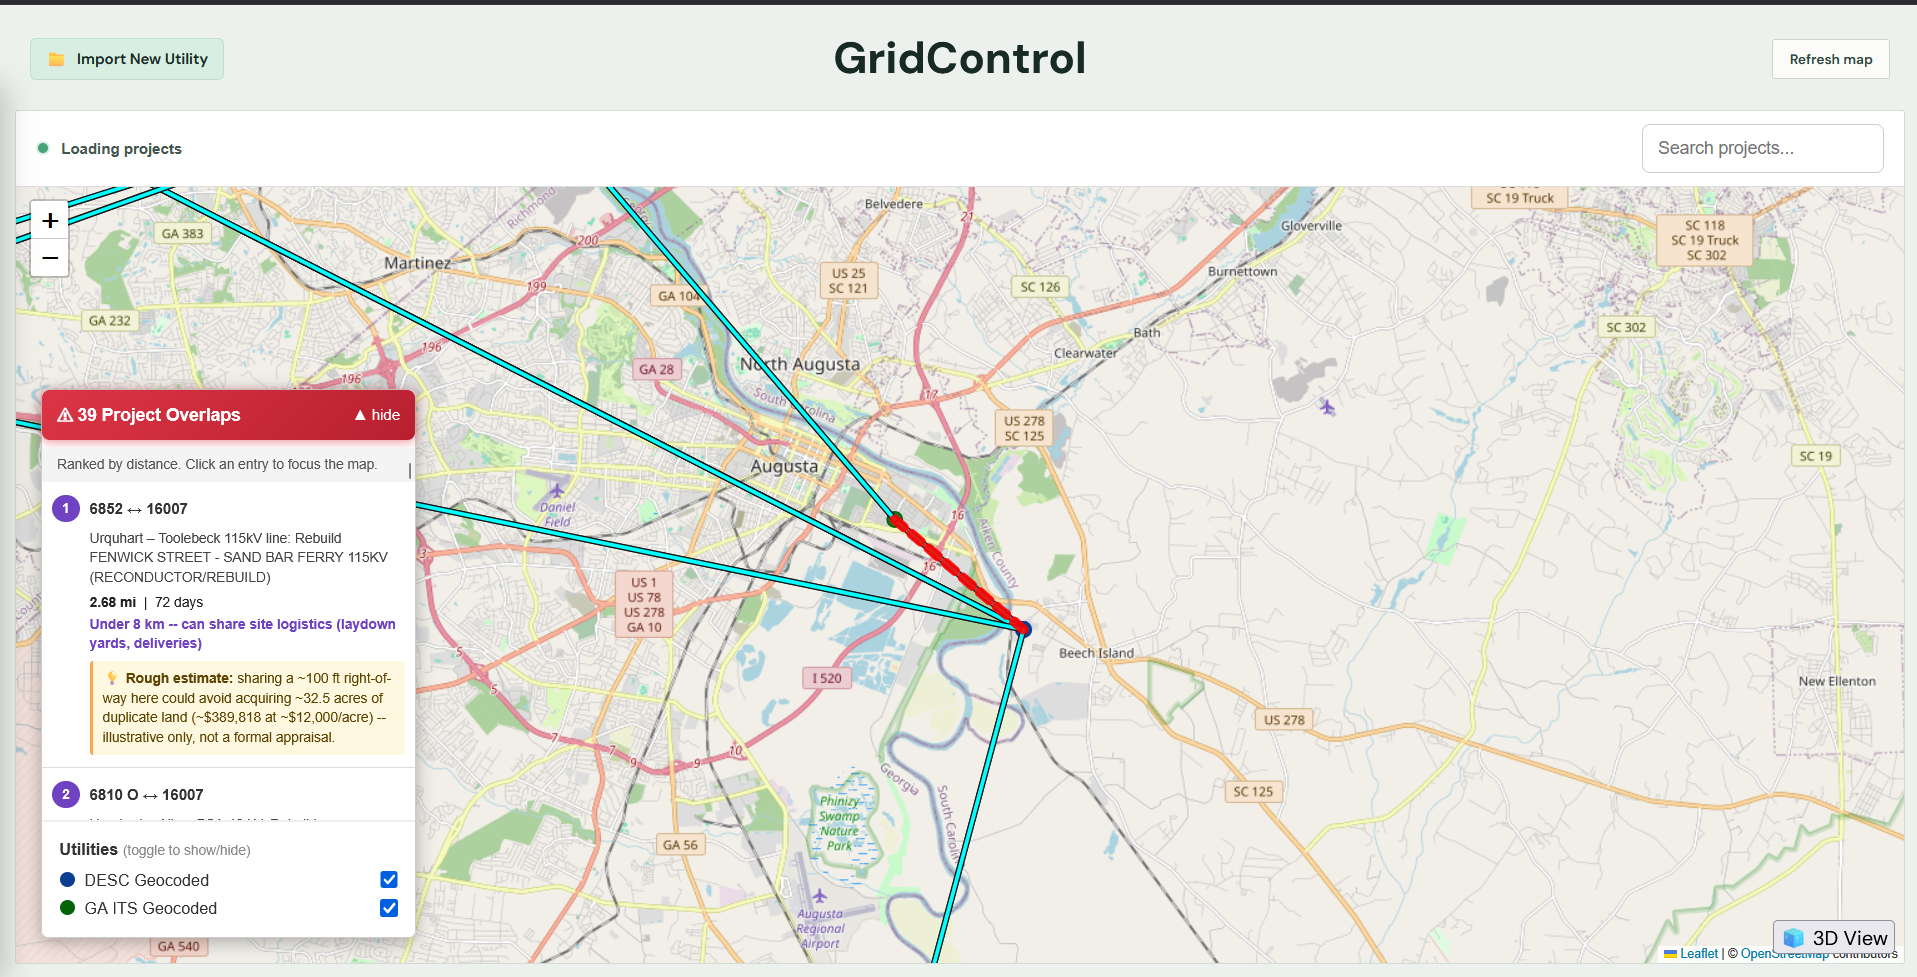
GridControl 2D Overlap Highlight
-
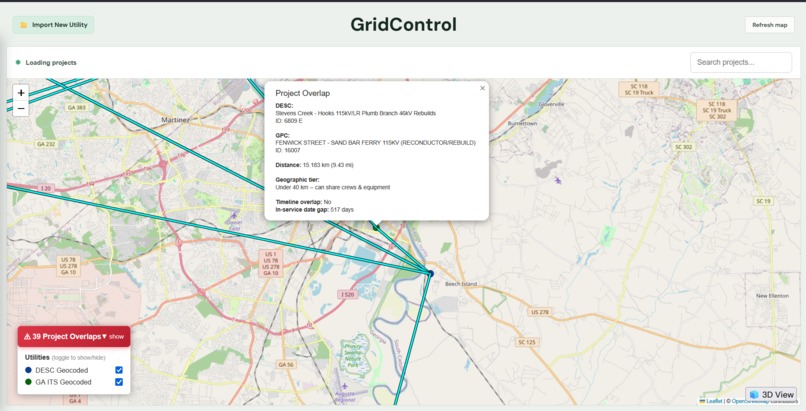
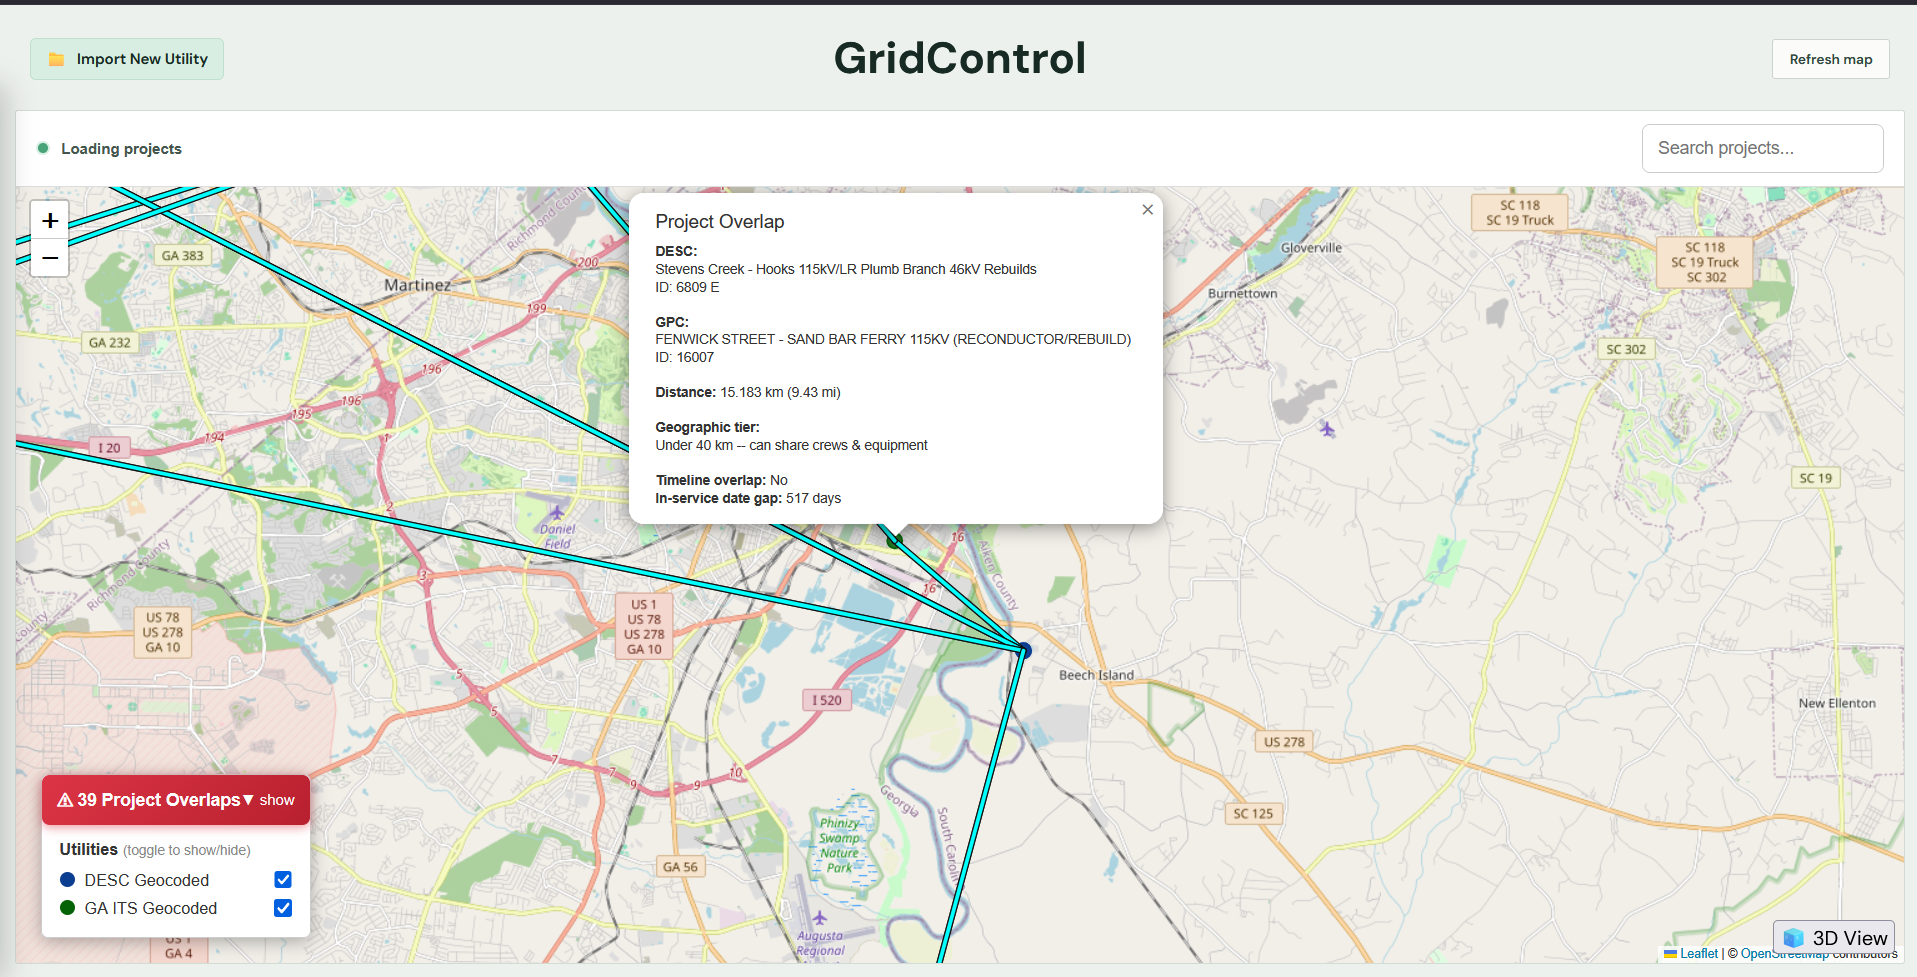
GridControl 2D Overlap Infobox
-
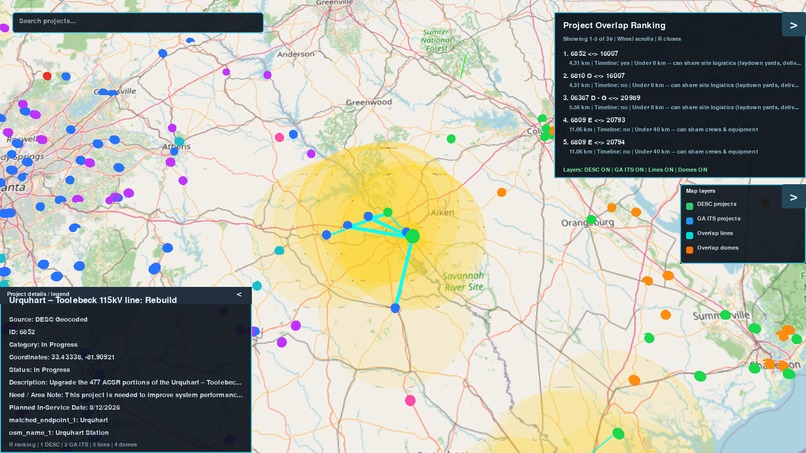
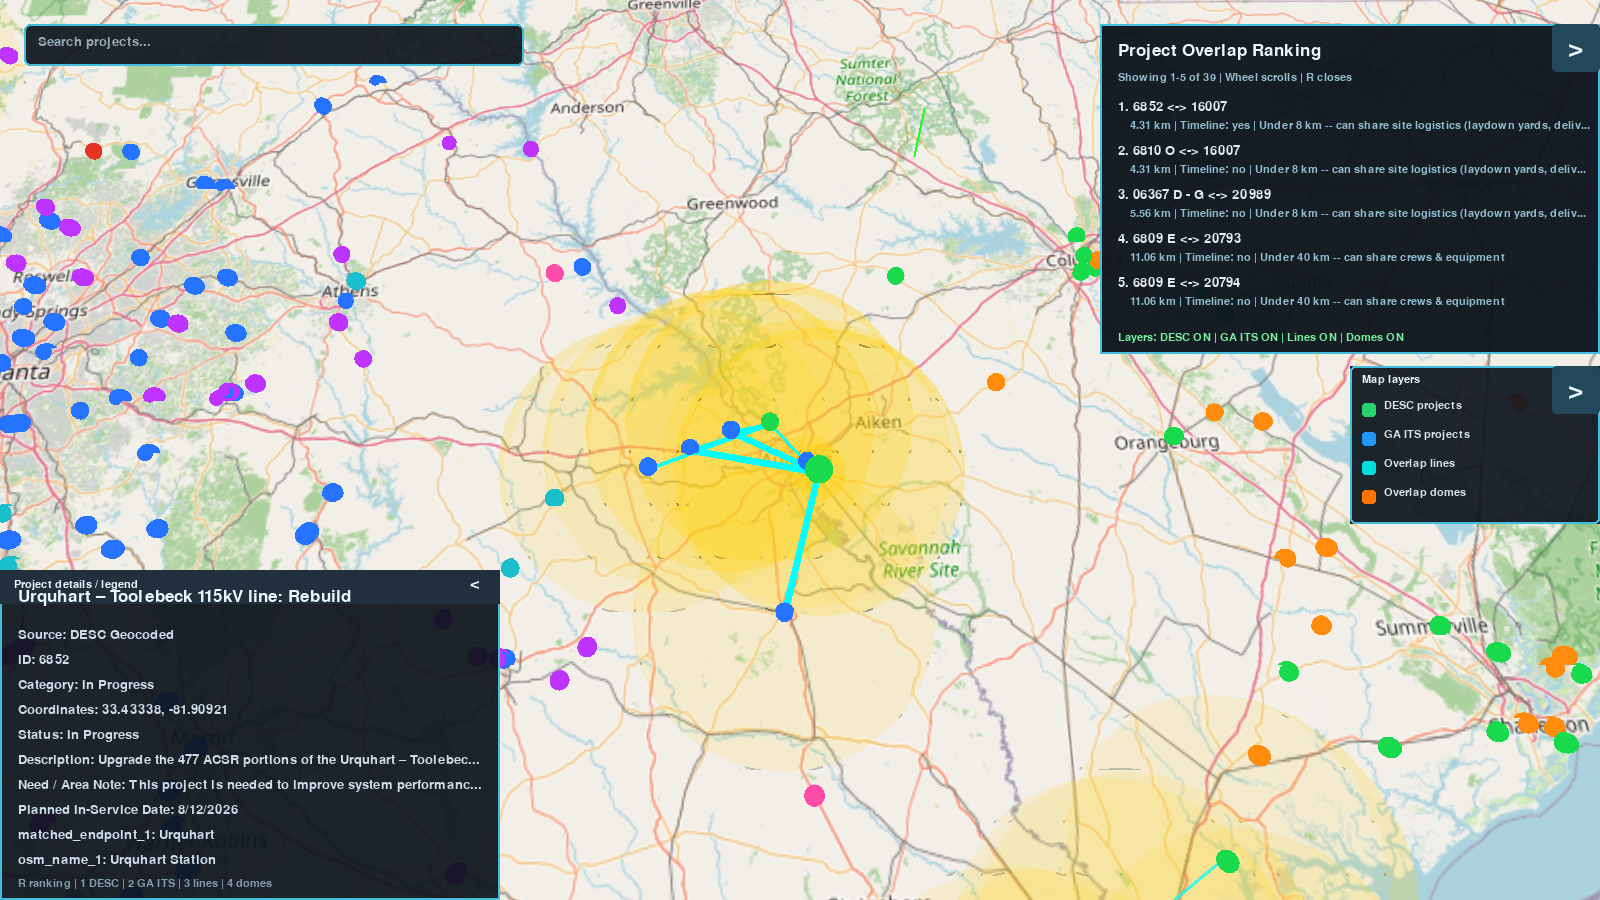
GridControl 3D View
Inspiration
One of our engineers comes from a construction background and in the company they previously worked at they used two different planning platforms used as aids for construction plans. They specialized in drones, one of the platforms being a 3D plan processing and viewing platform called Propeller that views street plans in a 3D space using drone flights, and another that was a purely 2D plaform that was used to plan drone flights with hard limits geographically based off of air zones. They were constantly used in conjunction to aid contracting ventures, and as they were both useful for different engineers internally, so we thought it would be more helpful to provide 2 different ways to view construction plans and overlaps within one platform. We hope that our project might be used to actually assist some engineers, and make planning for the future that much easier.
What it does
GridControl details long term utility construction projects that are planned on a map and displays any distance or time overlap on the projects. It parses through pdf planning documents and Excel sheets to locate coordinates using the Overpass API and Open Infrastructure Map which then populates the map with all the locations, lines to indicate overlaps, and a list of the overlaps ranked based on how close they are geographically then based on relative time. GridControl also offers the customization of viewing the map within either a 2D or 3D perspective.
How we built it
We used a whole catalogue of various tools that we've each used in the past in order to come together, share our knowledge, and create GridControl. Using Pygame and OpenGL (PyOpenGL), MongoDB, and various calls towards a streetview API, we were able to create the 3D perspective environment. Utilizing the engine of Pygame, and visual enhancements of OpenGL, we were able to setup the initial stages of our 3D environment, before then using MongoDB and a streetview API in order to not only make API calls to gather images of zooming into the Earth, but having MongoDB act as a storage bank for each of those image calls, so anyone could make use of the 3D view, without needing the load of images that were gathered from the API. Moving onto the 2D perspective, we made use of Python's many libraries (http server, openpyxl, pandas, etc.) in order to parse through the data and create Excel sheets that could then be read through and populate a map with pinpoints of calculated coordinates. Additionally, we made use of Tiger Data for data storage on Excel sheets that users could submit to further add future construction sites and projects to GridControl.
Challenges we ran into
We had a lot of trouble with implementing the Overpass API into the webpage to find the coordinates of each project. Due to the Open Infrastructure Map given having certain incomplete labeling in various substations, manual input and estimating general areas was required to confirm project locations. All of us were working on different features so when it came to merging them together through Github we would encounter challenges when it came to linking specific parts or moving features over from one branch of the repository to the other which we were able to overcome through patience and communication. When working on the 3D map representation, the visuals were a challenge to get right and in a place where the user would encounter no lag from moving around or zooming in due to the massive amount of assets and files needed to run it which MongoDB was able to solve.
Accomplishments that we're proud of
Throughout the challenge, we wanted to see how we could improve the initial prompt to create a tool that is versatile and simple to handle. We were able to implement a data parser to take in documents of construction projects to easily add to the map and a 3D view. We also included many features to make the webpage readable for any user to understand, navigation implements within our 3D viewing software that make it simple to see the complexities of how much area a project takes up in real space, and of course our lists of parsed, ranked overlaps of job sites as well as search functionality in both versions.
What we learned
We learned so much thanks to GridControl:
- How to create a 3D environment with pygame and opengl
- Creating a 2D map view with the help of libraries and databases
- How to parse through various media and formulate an excel sheet from said parsed data
- Managing a stressful environment when obstacles seem to never end
- Managing a workflow that involved balancing AI assistance and meaningful prompting
What's next for GridControl
In future development, rather than depending on a straight line on the map, we want to rely on the actual roads for calculating distance. It would be more realistic for workers to estimate the travel time between each project location and have more accuracy in planning for them. Using the Overpass and Nominatim API we were able to get data on the transmission lines which with manual oversight and a way to confirm unlabeled data would allow to check for the distance all along the line to help calculate geographic overlap. Another stretch goal is to improve 3D visuals so that when zooming in the cities and areas become elevated allowing the user to see the roads, transmission lines, and substations that the projects are working on for better planning purposes. With extra time we would also be able to find and include extra information that was redacted, not found, or unlisted to make the map and projects more detailed.
Built With
- css
- geminiapi
- html
- javascript
- mongodb
- nominatim
- opengl
- openpyxl
- overpass
- overpass-openstreetmap
- pillow
- pygame
- pypdf
- python
- requests
- streamlit
- tigerdata


Log in or sign up for Devpost to join the conversation.