Inspiration
The idea for this project came from the growing importance of immunotherapy in modern cancer treatment. Many patients and researchers struggle to quickly find specialized clinics that provide advanced immunotherapy methods. We wanted to create a simple and visual tool that helps users easily discover leading clinics in the United States that offer treatments such as CAR-T therapy, PD-1/PD-L1 inhibitors, and other immunotherapy options. The goal was to combine healthcare information with an interactive map interface to make the data more accessible.
What it does
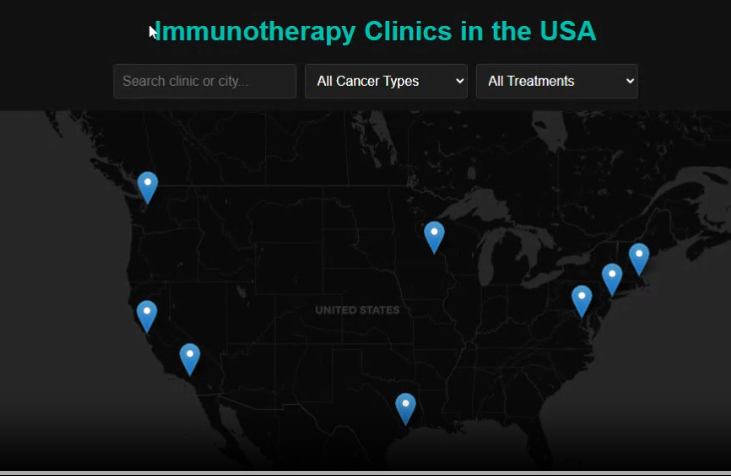
Immunotherapy Clinics Map (USA) is an interactive web application that displays major cancer immunotherapy clinics across the United States on a map. Users can:
View clinic locations on an interactive map
Search clinics by name or city
Filter clinics by cancer type (lung, melanoma, breast, blood cancers, etc.)
Filter by treatment method (CAR-T, PD-1/PD-L1, checkpoint inhibitors, clinical trials, TIL therapy)
Click markers to see clinic information and visit the official website
This allows users to quickly explore where advanced immunotherapy treatments are available.
How we built it
The project was built using HTML, CSS, and JavaScript along with the Leaflet.js mapping library.
Main components of the project include:
Leaflet.js for rendering the interactive map and markers
A JavaScript dataset that stores clinic information such as location, treatments, and cancer types
Filtering logic in JavaScript that dynamically shows or hides markers based on selected criteria
A dark UI theme created with CSS to improve visual clarity and modern design
Interactive search and dropdown filters that allow users to quickly narrow results
The application loads clinic data, places markers on the map, and updates them dynamically when filters are applied.
Challenges we ran into
One of the main challenges was implementing the dynamic filtering system. We needed to ensure that markers appear or disappear correctly when users combine search input with multiple filter options.
Another challenge was managing the clinic dataset structure so that it could support multiple cancer types and treatment methods while still being easy to filter in JavaScript.
We also worked on improving the map usability and design, ensuring the markers remain clear and the dark theme looks good with the map tiles.
Accomplishments that we're proud of
We are proud that we successfully created a clean, interactive healthcare visualization tool. The project demonstrates how geographic data and medical information can be combined into an easy-to-use interface.
Key achievements include:
A fully interactive map-based healthcare directory
Multi-filter search functionality
A responsive and visually consistent dark UI design
Clear presentation of important clinical information
What we learned
During this project we learned how to:
Work with the Leaflet mapping library
Manage and structure JSON-like data in JavaScript
Implement real-time filtering logic
Design a user-friendly UI for data exploration
Integrate map markers with dynamic popups and external links
This project also helped us better understand how web technologies can be used to visualize healthcare data.
What's next for Immunotherapy Clinics Map (USA)
In the future we plan to expand the project with several improvements:
Add more clinics and hospitals across the United States
Include additional cancer types and therapies
Integrate real medical datasets or APIs
Add distance search to find the nearest clinic
Improve the interface with marker clustering and better filtering
Possibly expand the map to global immunotherapy centers
The long-term goal is to turn the project into a comprehensive resource for discovering immunotherapy treatment centers worldwide.

Log in or sign up for Devpost to join the conversation.