
Inspiration
Delhi consistently ranks among the most polluted cities in the world, but most people only ever see a single vague "AQI number" for the entire city on the news. That number doesn't tell you what's happening near your own home, whether it's safe to send your kids to school without a mask, or whether you should skip your evening run. We wanted to build something that turns raw pollution data into a real, actionable, everyday health tool — not just a statistic.
What it does
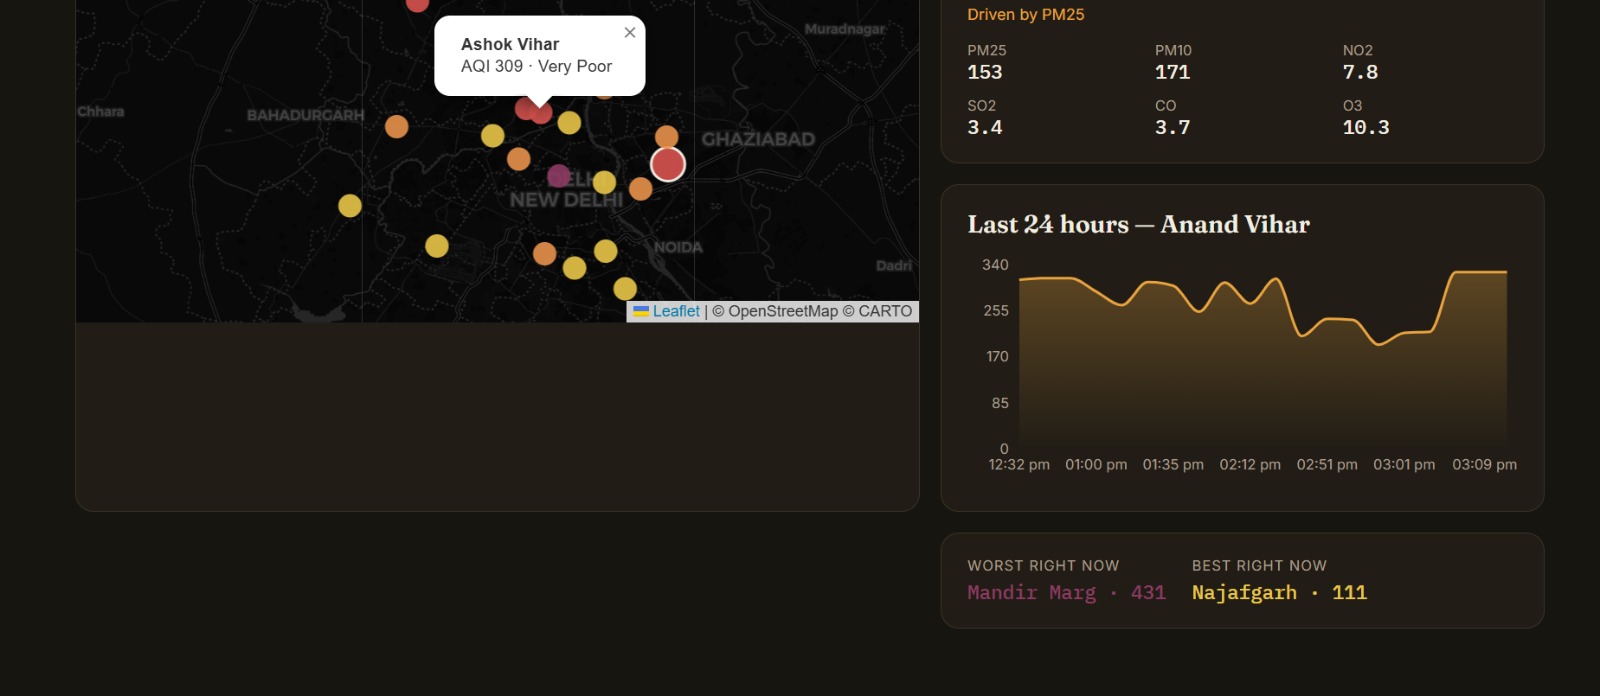
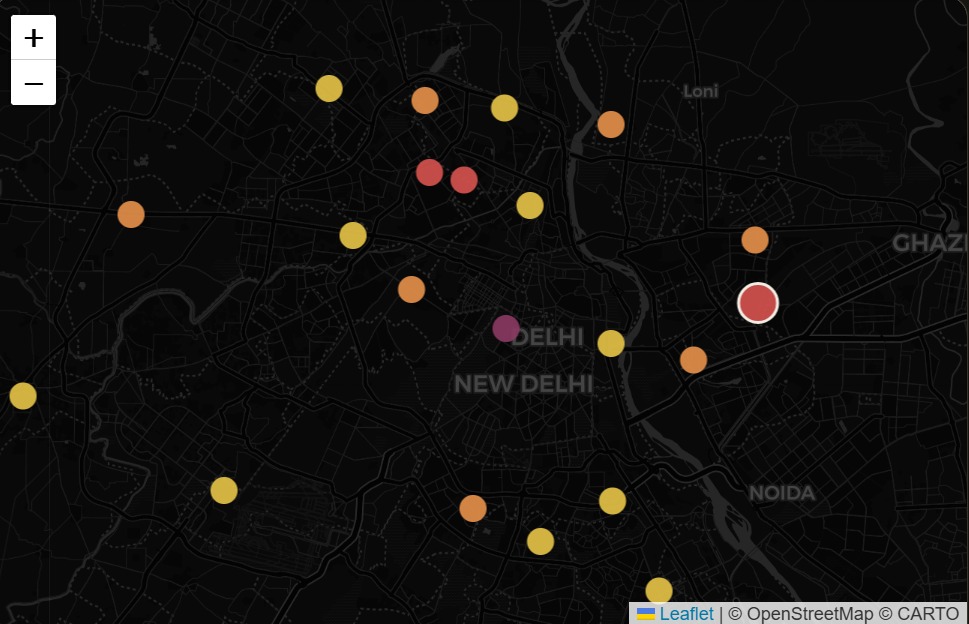
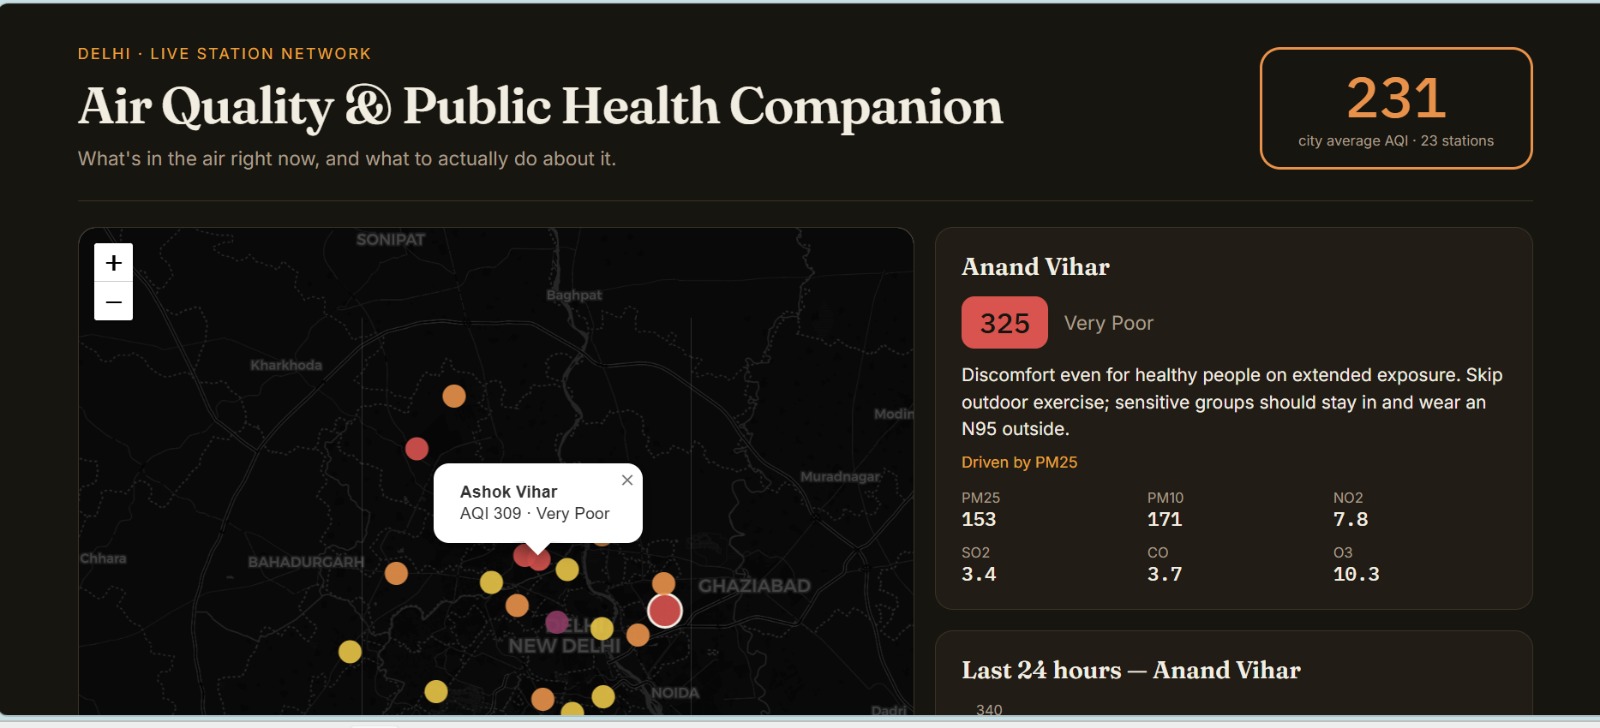
Delhi Air Quality & Public Health Companion is a live dashboard that shows real-time air quality across 23 monitoring stations in Delhi on an interactive map. For each station, it displays:
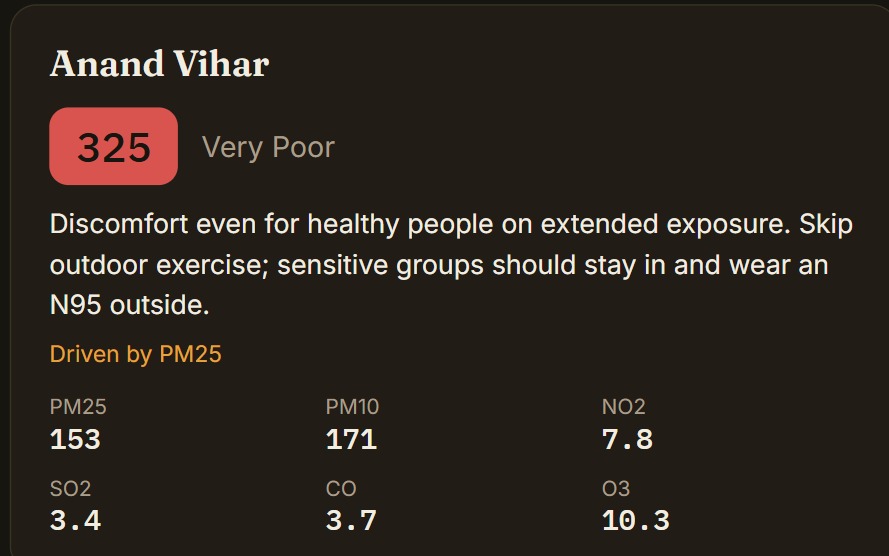
- The current AQI, calculated using India's official CPCB formula
- Which specific pollutant (PM2.5, PM10, NO2, etc.) is driving that score
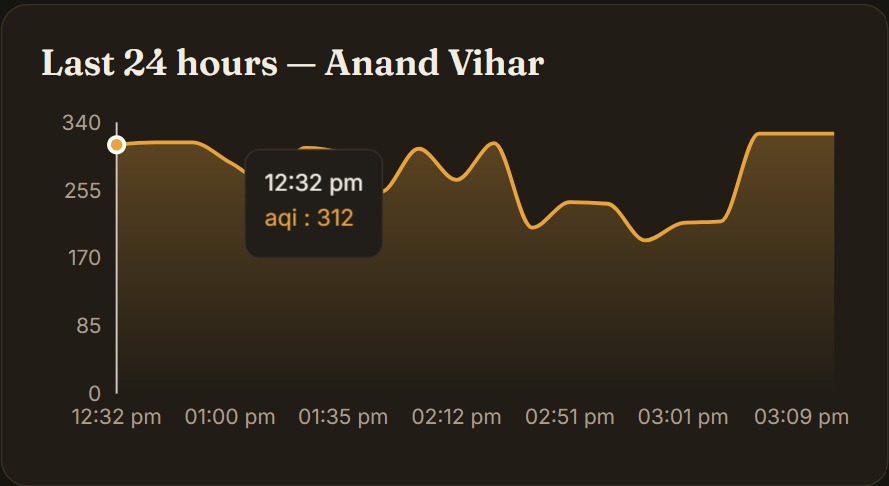
- A 24-hour history trend chart
- Plain-language health advice — like "avoid outdoor exercise" or "wear an N95 outside" — tailored to the current severity level
- A city-wide average AQI at a glance
If live data is temporarily unavailable, the app automatically falls back to a realistic synthetic model built from real seasonal and hourly pollution patterns, so the dashboard is never broken — and every reading is honestly labeled as real or synthetic.
How we built it
- Backend: Python + FastAPI, handling ingestion, AQI computation, and API routes
- Data source: Live pollution data pulled from the WAQI (aqicn.org) API every 30 minutes
- AQI calculation: A custom module implementing CPCB's official piecewise-linear breakpoint formula — the same method India's pollution board uses, not the US EPA formula
- Database: Elasticsearch, storing every reading as a timestamped JSON document, enabling fast queries for "latest per station" and "last 24 hours" history
- Frontend: React + TypeScript (Vite), with a Leaflet map for station visualization and a custom history chart component
- Infrastructure: Fully containerized with Docker Compose — backend, frontend, and Elasticsearch run as three linked services
Challenges we ran into
- Government API reliability: We initially built against India's official data.gov.in CPCB API, but found it extremely unreliable — frequent timeouts even with generous retry windows. We had to design a resilient fallback system and eventually migrated to the WAQI API for better uptime.
- Container networking issues: Requests that worked instantly in a browser were timing out inside our Docker containers, which turned out to be a Docker Desktop/IPv6 routing quirk — solved by forcing IPv4 and adding retry logic with backoff.
- Matching data sources to real locations: Since WAQI identifies stations differently than CPCB, we had to build a nearest-coordinate matching system to correctly map external station data onto our known Delhi station list.
Accomplishments that we're proud of
- A fully working, end-to-end live data pipeline — from external API to Elasticsearch to a polished, interactive frontend
- Implementing the actual official Indian AQI formula, not a generic approximation
- Building genuine resilience into the system: it degrades gracefully instead of breaking when external data is unavailable, and is always transparent about which mode it's in
What we learned
- Real-world government APIs are often far less reliable than expected, and building resilient fallback systems is just as important as the "happy path"
- Elasticsearch is a powerful fit for time-series geographic data, especially for fast aggregations like city-wide averages and per-station history
- Docker networking issues can look like application bugs, but debugging at the container/network layer separately from the application layer is essential
What's next
- Street-level AQI: Using spatial interpolation (IDW/Kriging) and machine learning to estimate air quality between stations, not just at the 23 fixed points
- More data sources: Combining WAQI, CPCB, and low-cost community sensors for denser coverage
- Route-based exposure: Letting users check air quality along a route (e.g. home to office) for daily planning
- Push notifications: Alerting users when AQI crosses dangerous thresholds near their saved locations
Built With
- css
- docker
- docker-compose
- elasticsearch
- fastapi
- html
- httpx
- javascript
- leaflet.js
- openstreetmap
- python
- react
- typescript
- uvicorn
- vite

Log in or sign up for Devpost to join the conversation.