Inspiration
Floods can cause serious damage, especially in hilly regions like the Himalayas, where roads can get blocked and entire communities can become difficult to reach. I wanted to build something that could use satellite data to help people understand the impact of floods more easily. That idea led to HydroViz.
What it does
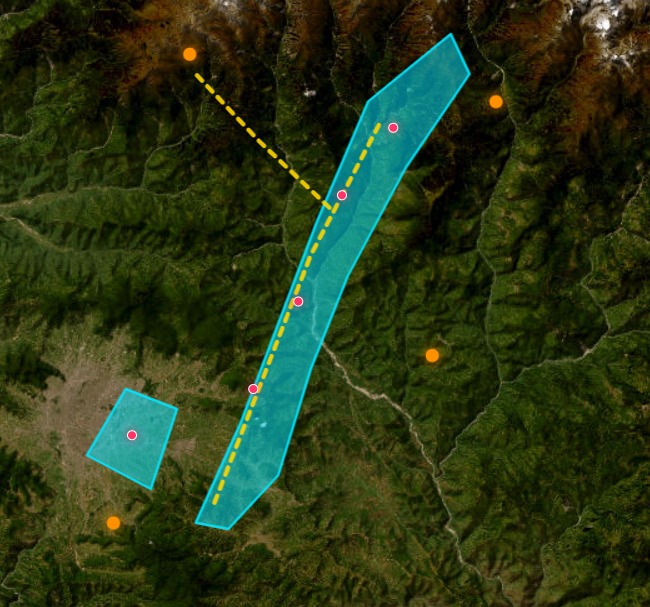
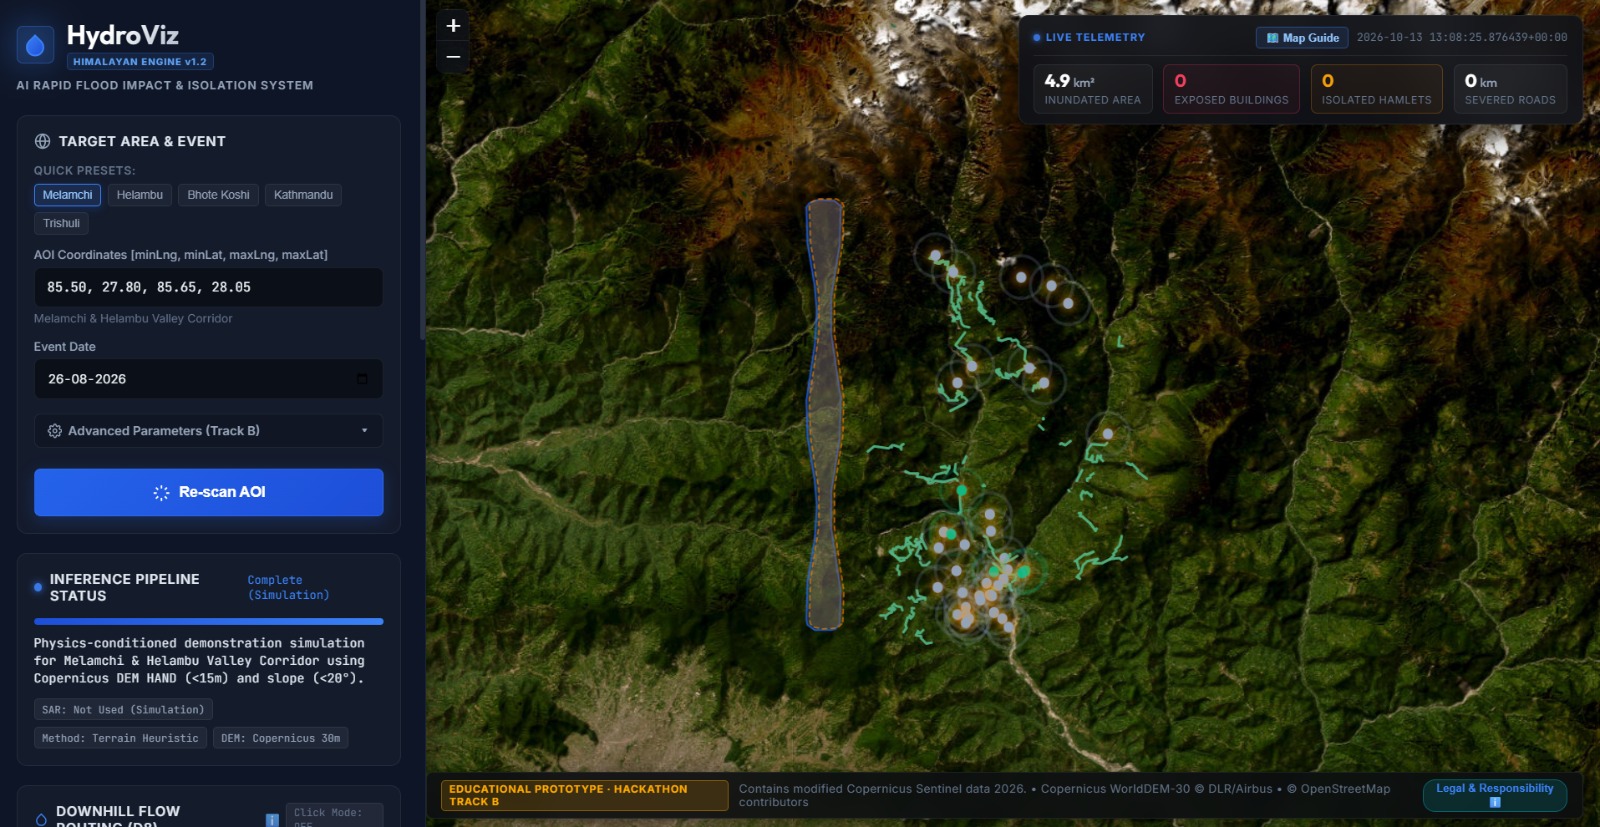
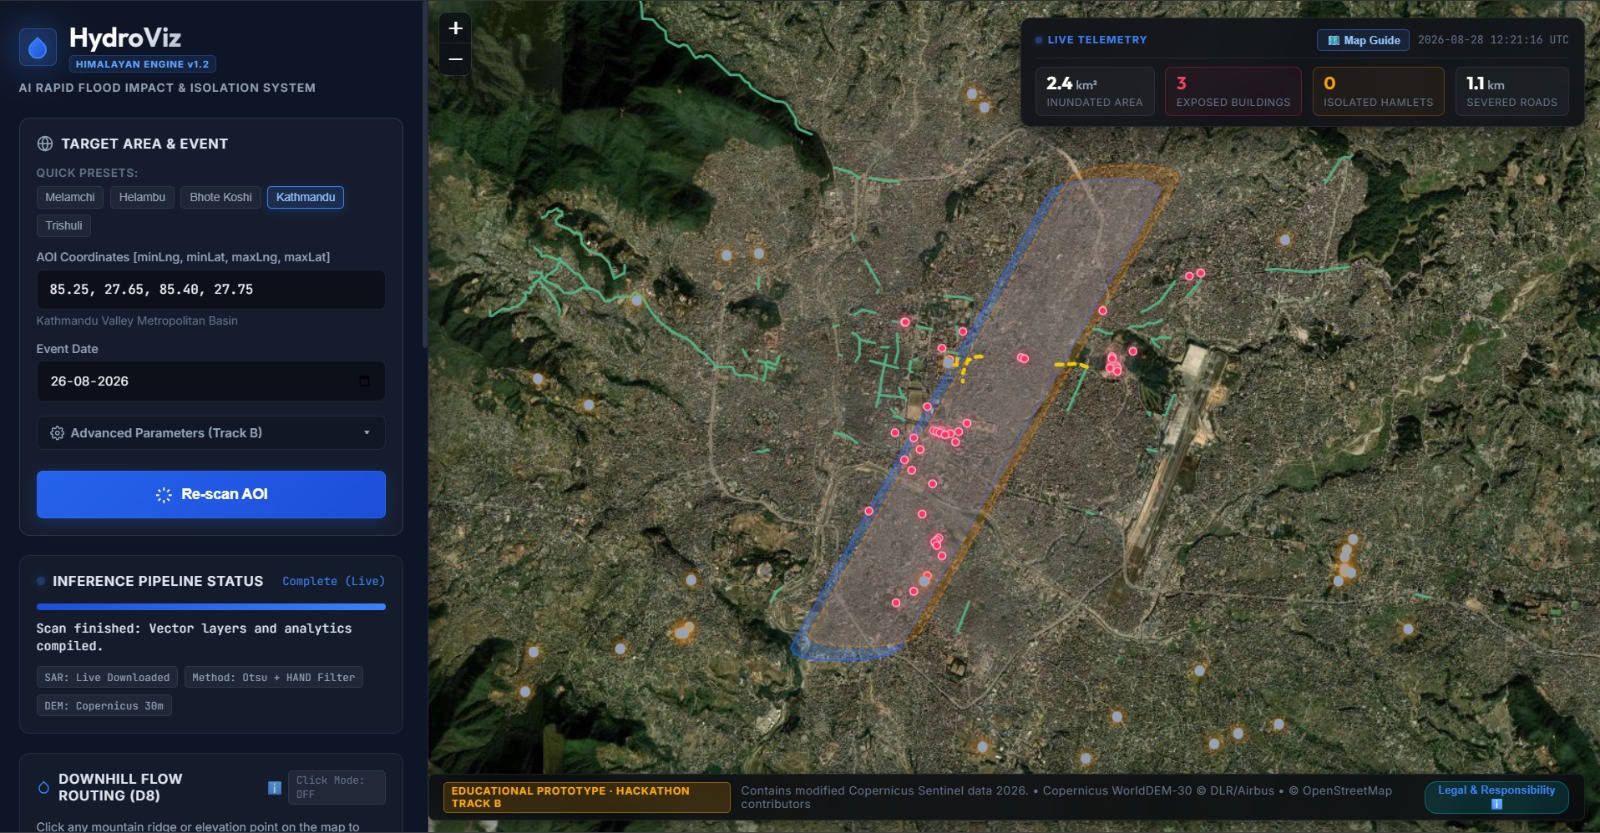
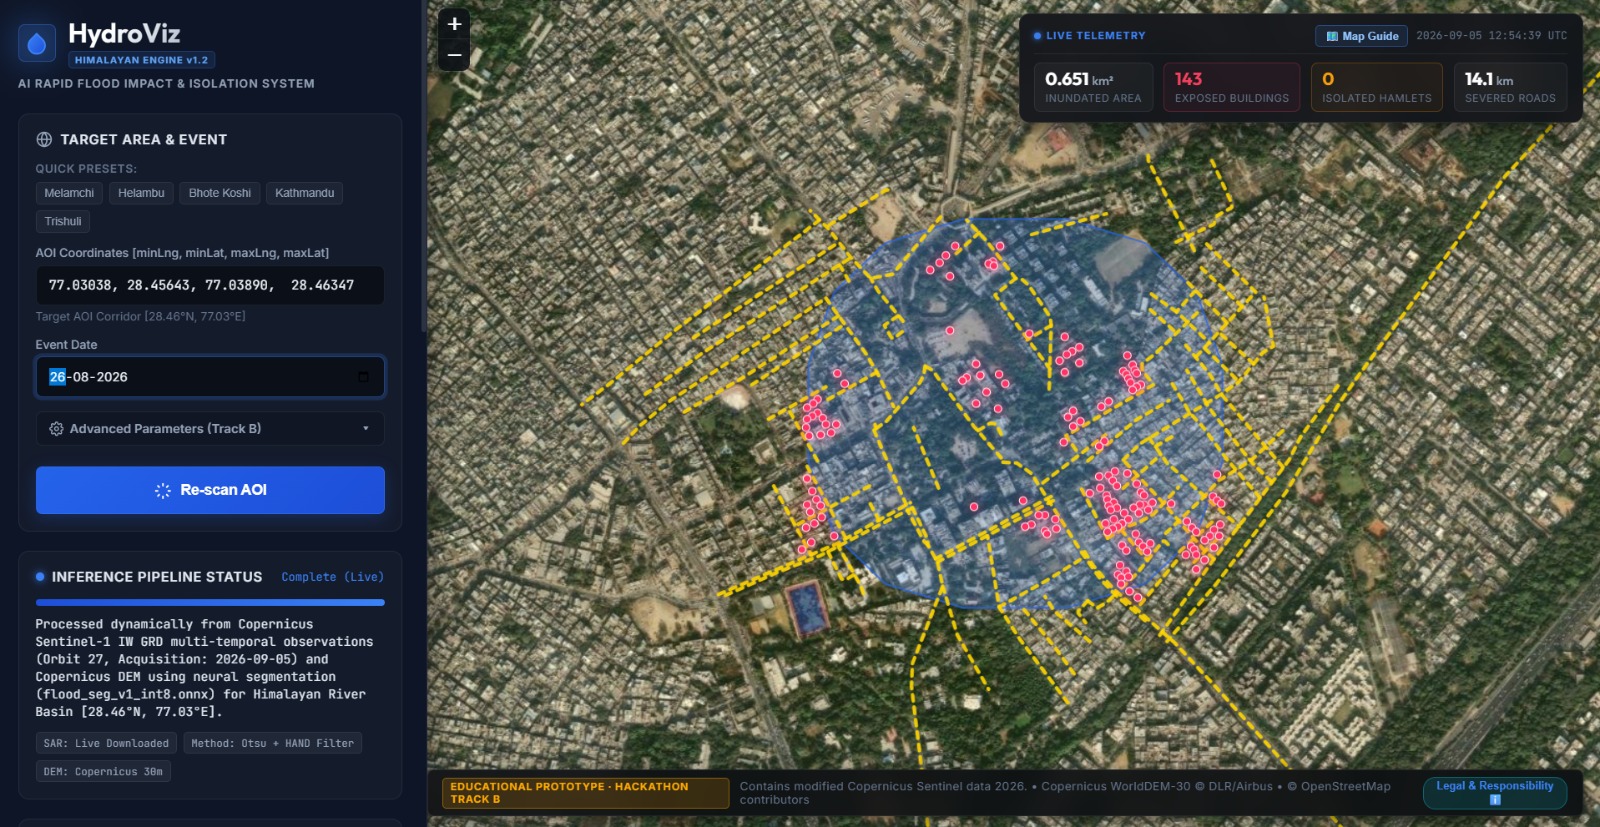
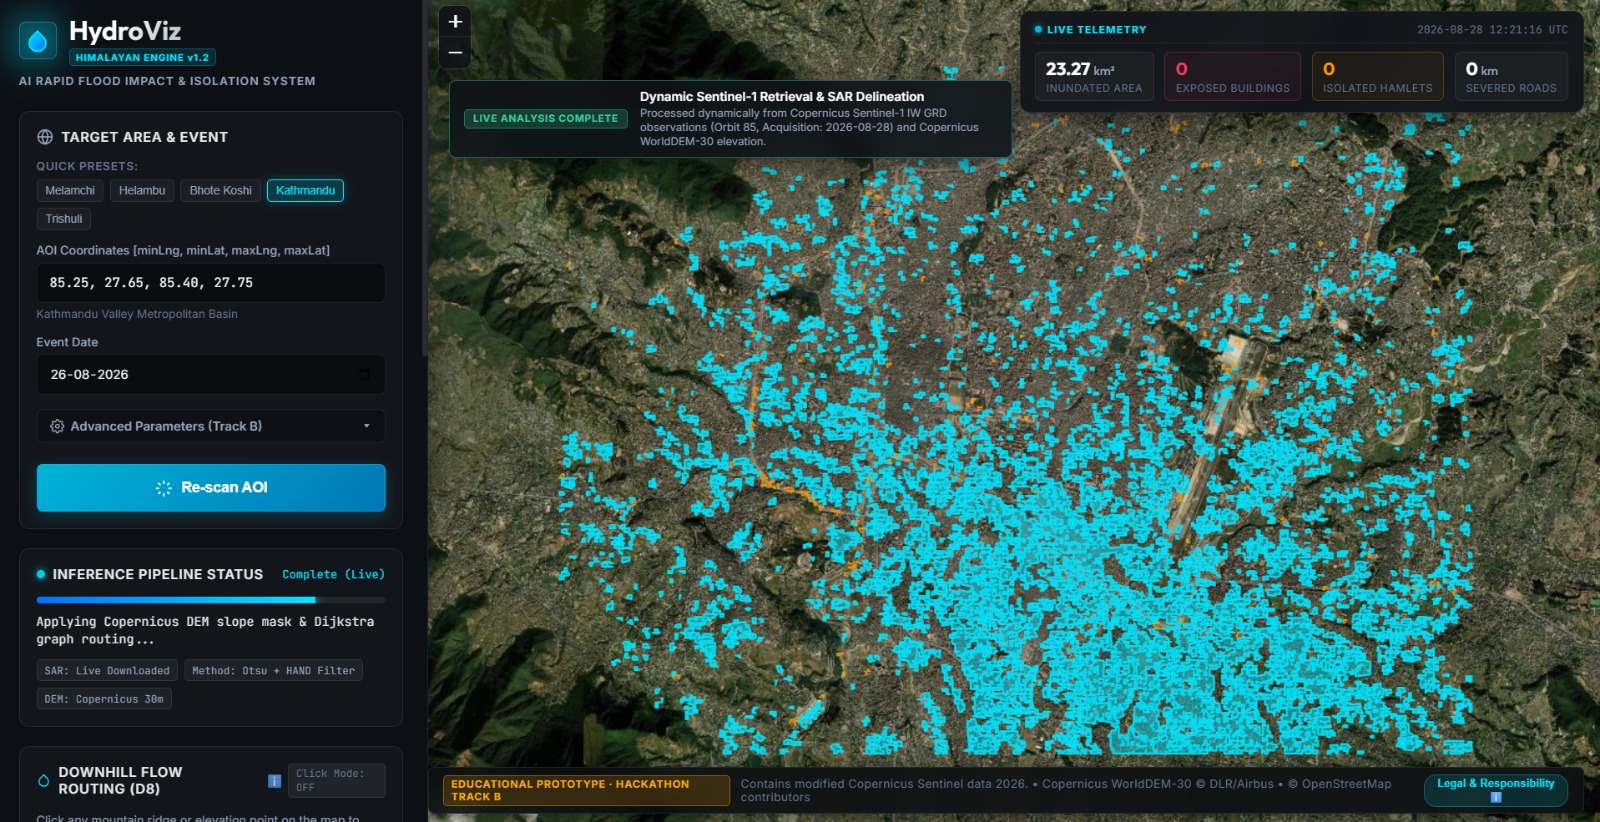
HydroViz is a flood-impact mapping system focused on Himalayan regions. Users can select an area and a flood date to explore flood extent, nearby buildings and roads that may be affected, and settlements that could face connectivity problems.
It combines satellite imagery, elevation data, and infrastructure information in an interactive map. It also includes AI-based flood segmentation and a tool for exploring downstream water-flow paths.
How we built it
I built HydroViz using Python, FastAPI, JavaScript, and geospatial processing tools. It uses Copernicus Sentinel satellite data, Copernicus elevation data, and OpenStreetMap to bring different types of information together.
I also integrated an ONNX-based flood-segmentation model and worked on the data-ingestion pipeline, raster alignment, infrastructure analysis, and interactive dashboard. The goal was to make the entire process accessible through one application rather than requiring users to work with several separate tools.
Challenges we ran into
Getting all the different components to work together was one of the hardest parts. Satellite data can take time to retrieve, large areas can be expensive to process, and even small alignment problems between rasters can affect the final map.
I also had to deal with missing data, processing failures, and making sure the system clearly distinguishes live analysis from demonstration results. These problems took a lot of debugging and taught me that a good-looking map is not enough; the data behind it needs to be reliable too.
Accomplishments that we're proud of
I'm proud of bringing satellite data, AI-based segmentation, terrain analysis, and infrastructure mapping together in one interactive application.
Building HydroViz also gave me experience working with a complete pipeline, from obtaining data and processing it to displaying results on a map. What started as an idea became a full prototype with several connected components and a clear path for further improvement.
What we learned
I learned a lot about geospatial data, satellite imagery, AI integration, and building applications that combine multiple technologies. One of the biggest lessons was that getting a model to run is only one part of the job. The input data, preprocessing, validation, and how results are presented are just as important.
I also learned to approach errors more carefully and to check what the system is actually doing instead of assuming that a successful-looking output is correct.
What's next for HydroViz
I'd like to keep improving HydroViz by strengthening its flood predictions, validating results against independent reference data, and making the live processing pipeline more reliable across different locations and flood events.
I also want to improve the infrastructure-connectivity analysis and make the application easier for others to set up and use. The long-term goal is to make flood-impact information easier to explore and understand, especially for vulnerable mountain communities.
Built With
- copernicus
- css
- data
- dem
- docker
- ecosystem
- fastapi
- geopandas
- html
- javascript
- leaflet.js
- numpy
- onnx
- opencv
- openstreetmap
- python
- rasterio
- runtime
- rust
- sentinel-1
- shapely
- space


Log in or sign up for Devpost to join the conversation.