-
-
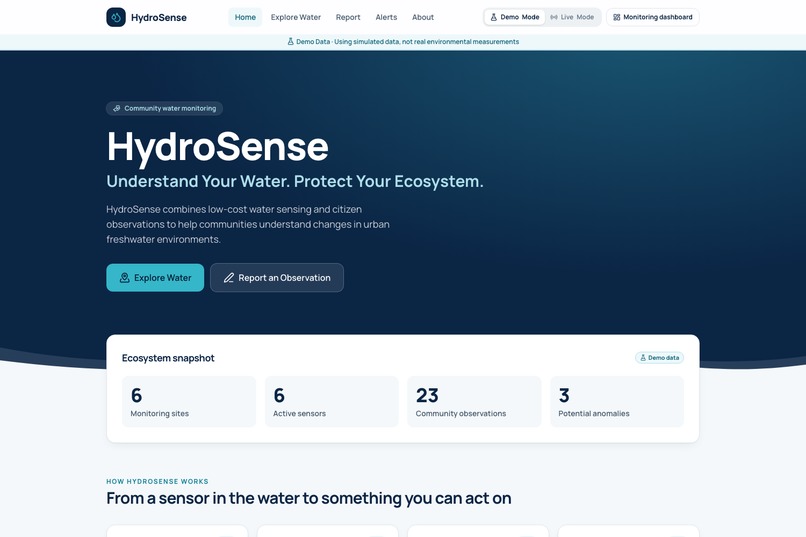
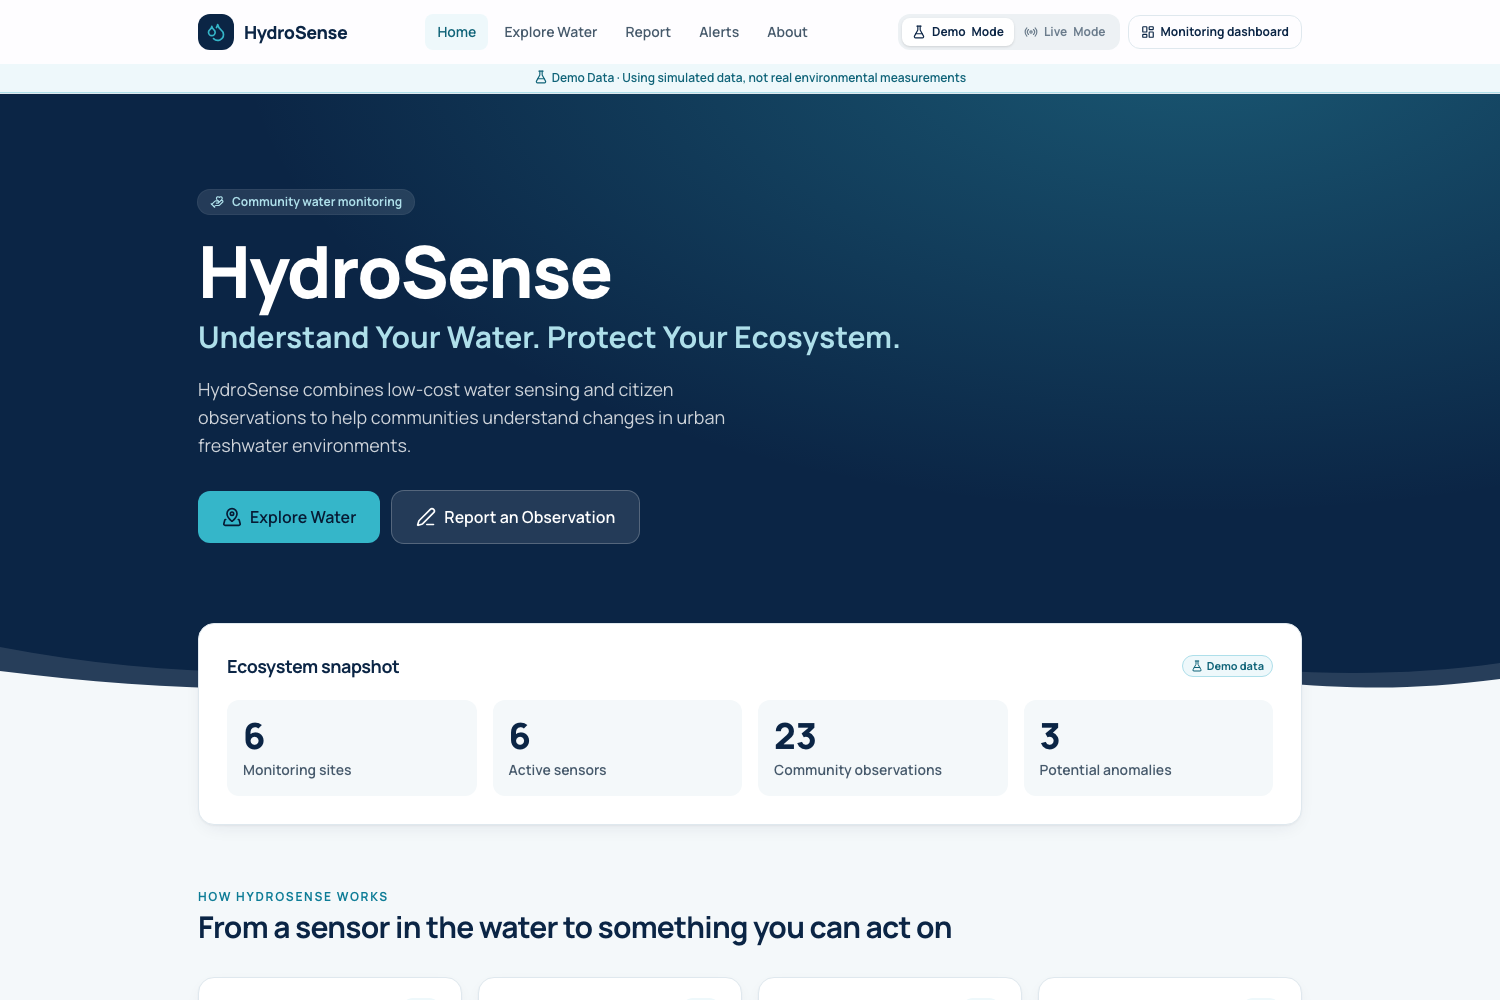
Website HomePage
-
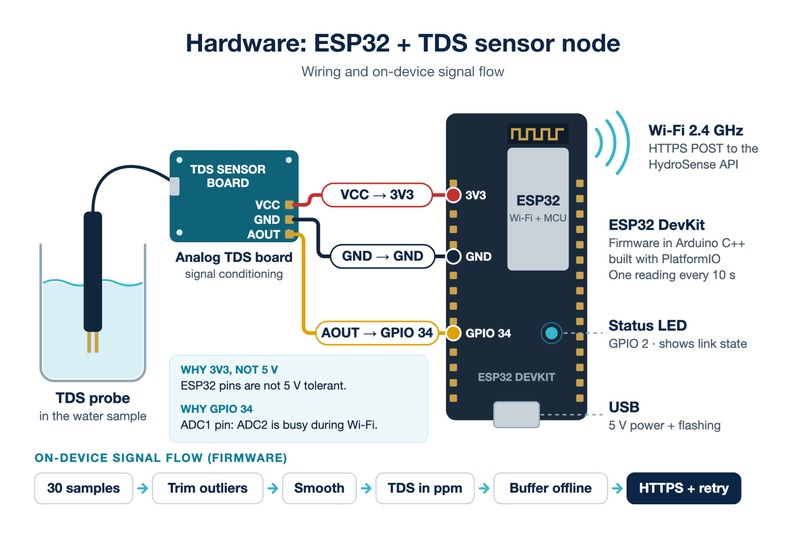
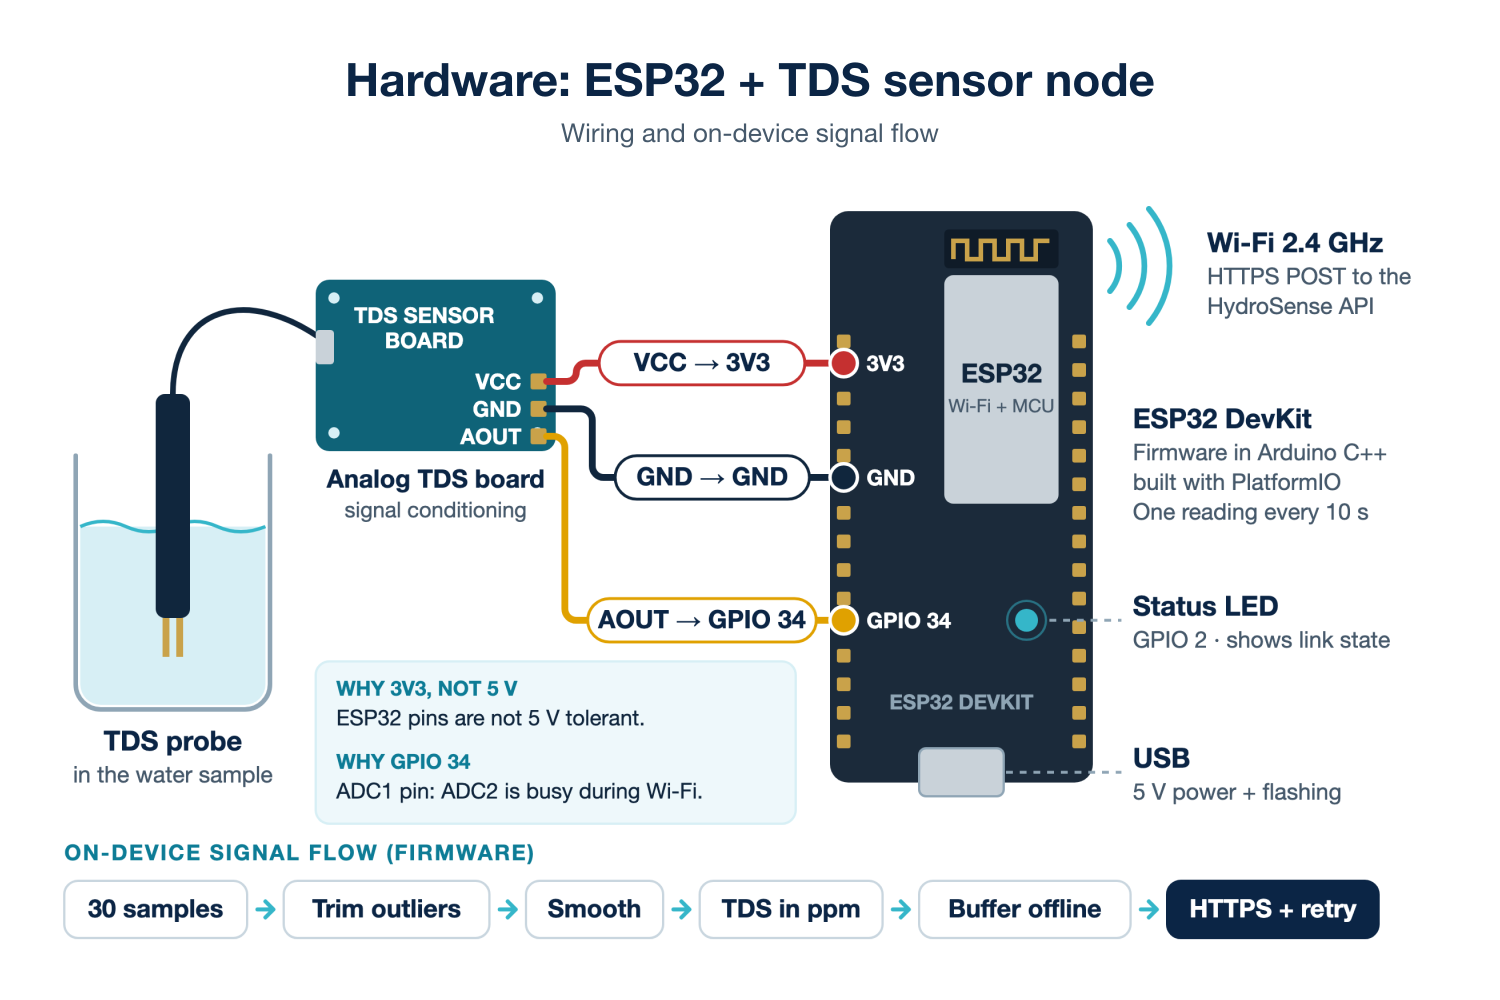
Hardware Diagram
-
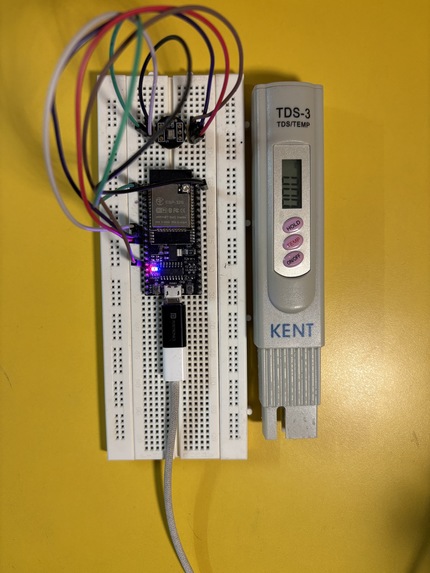
Hardware_Components
-
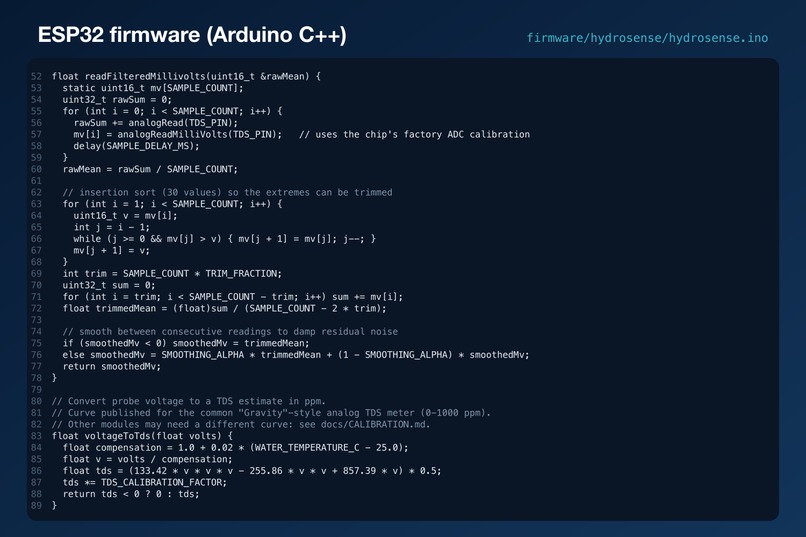
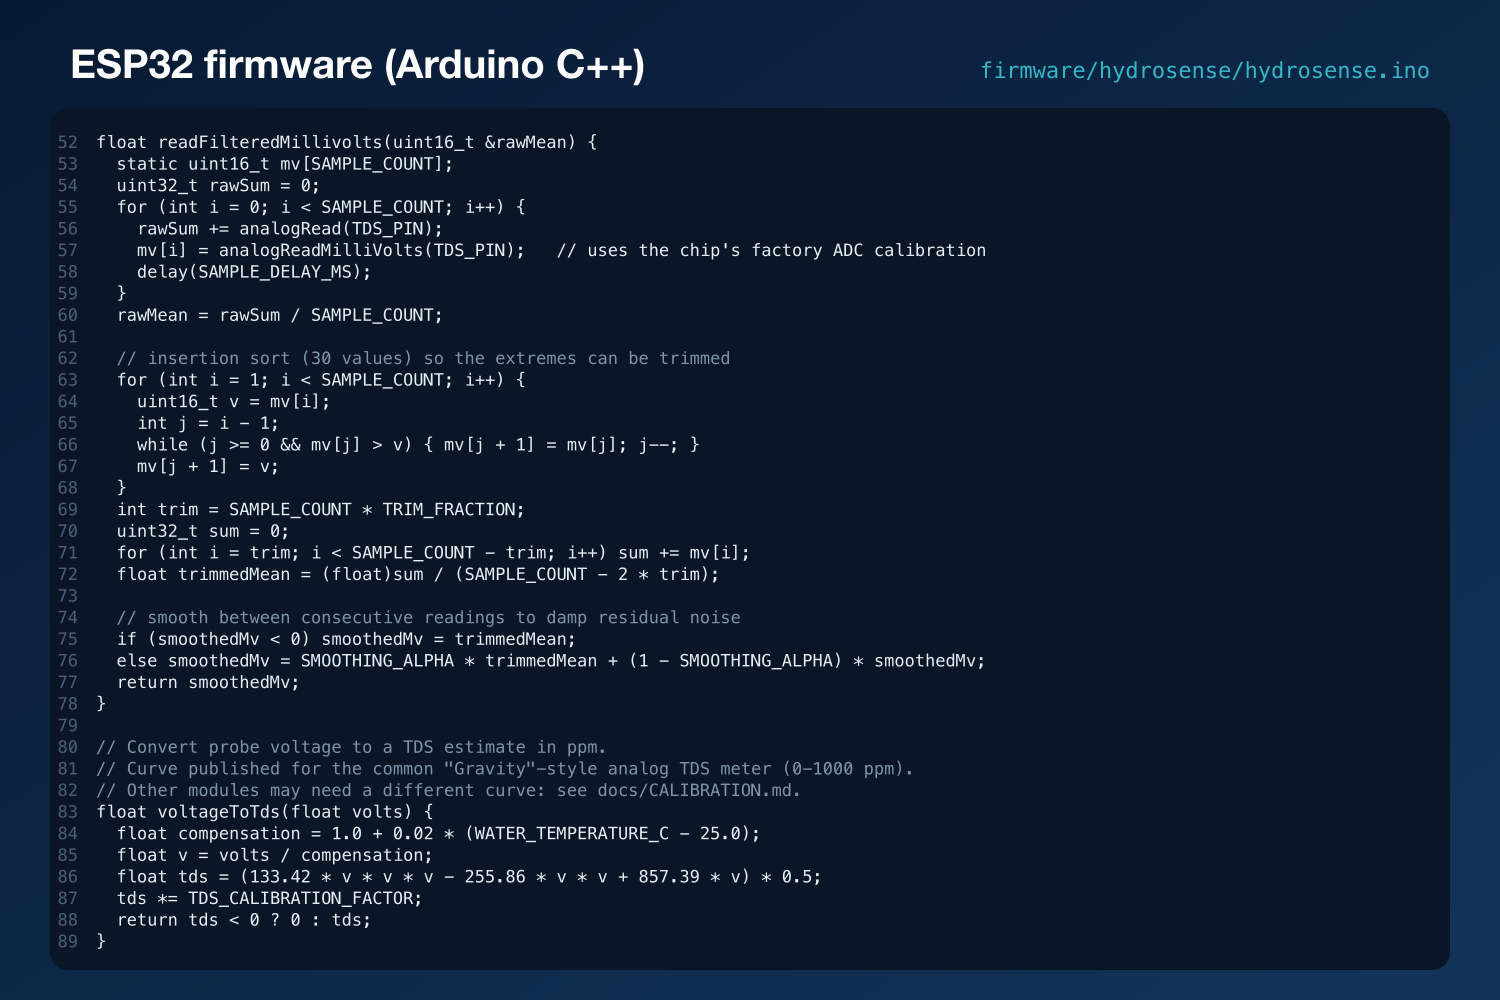
ESP32 firmware
-
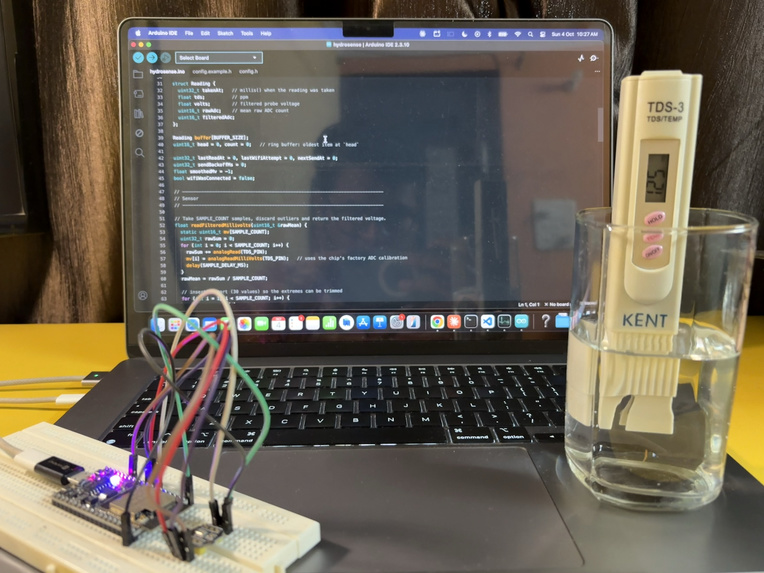
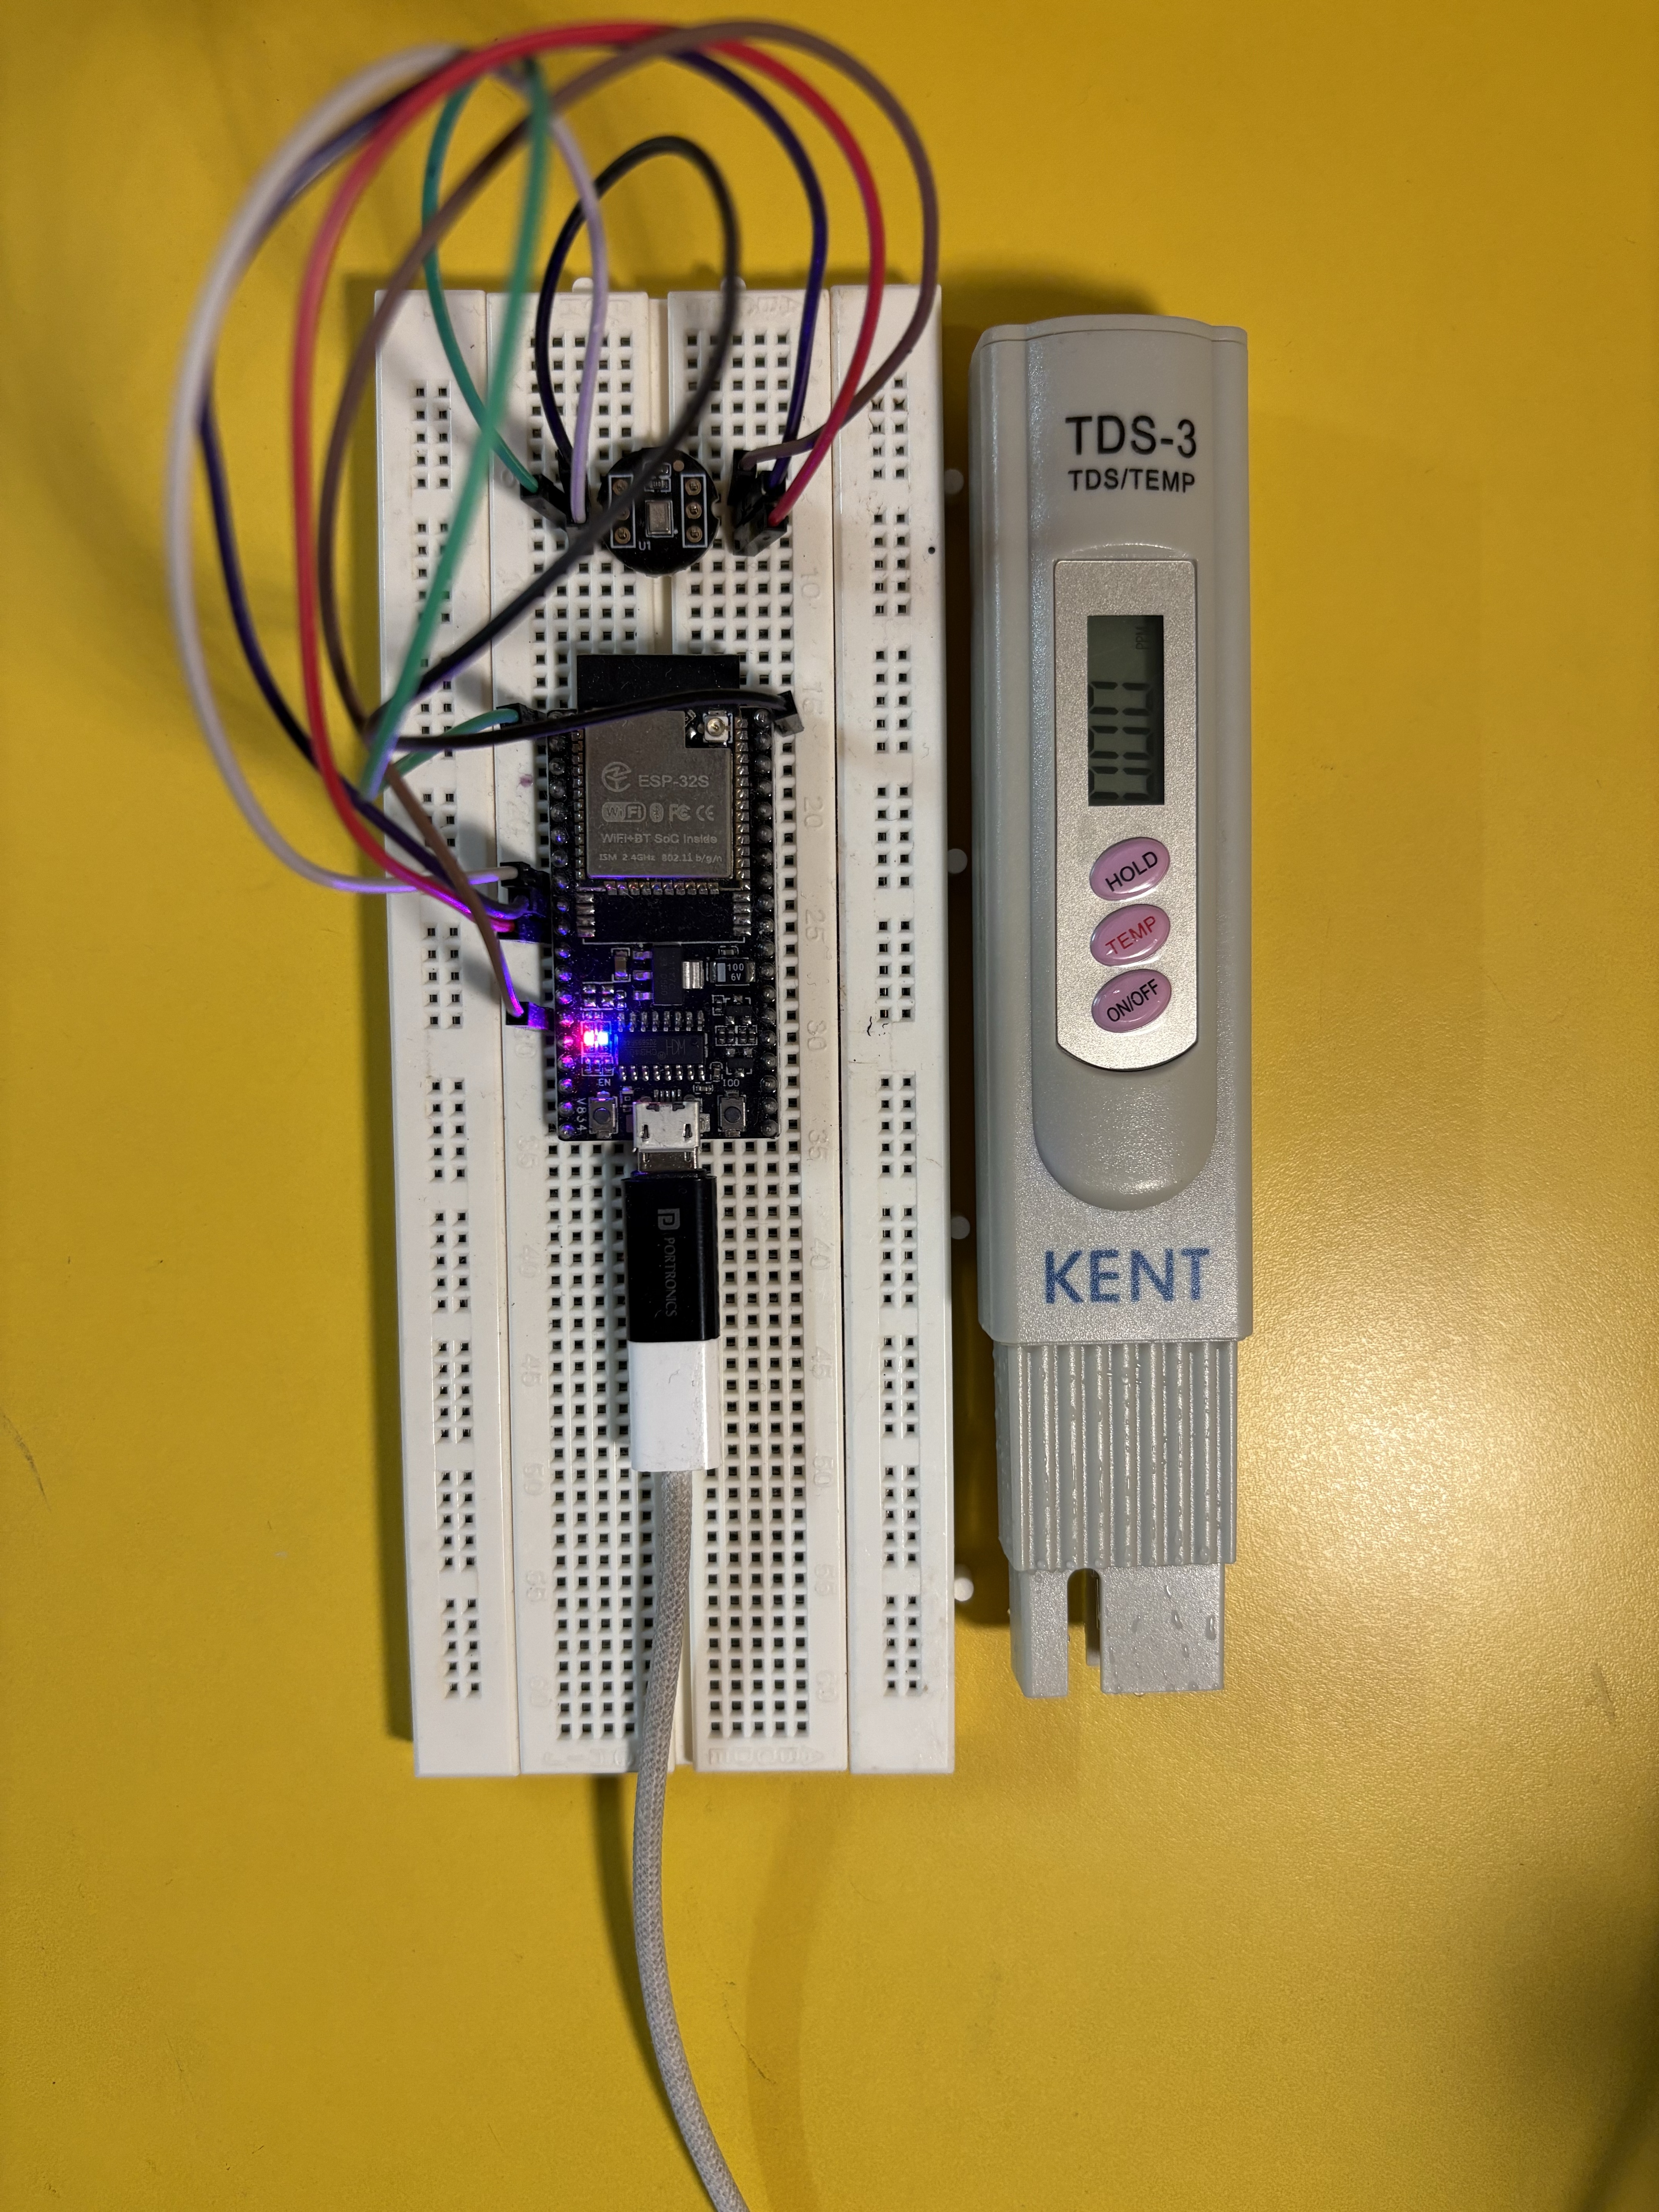
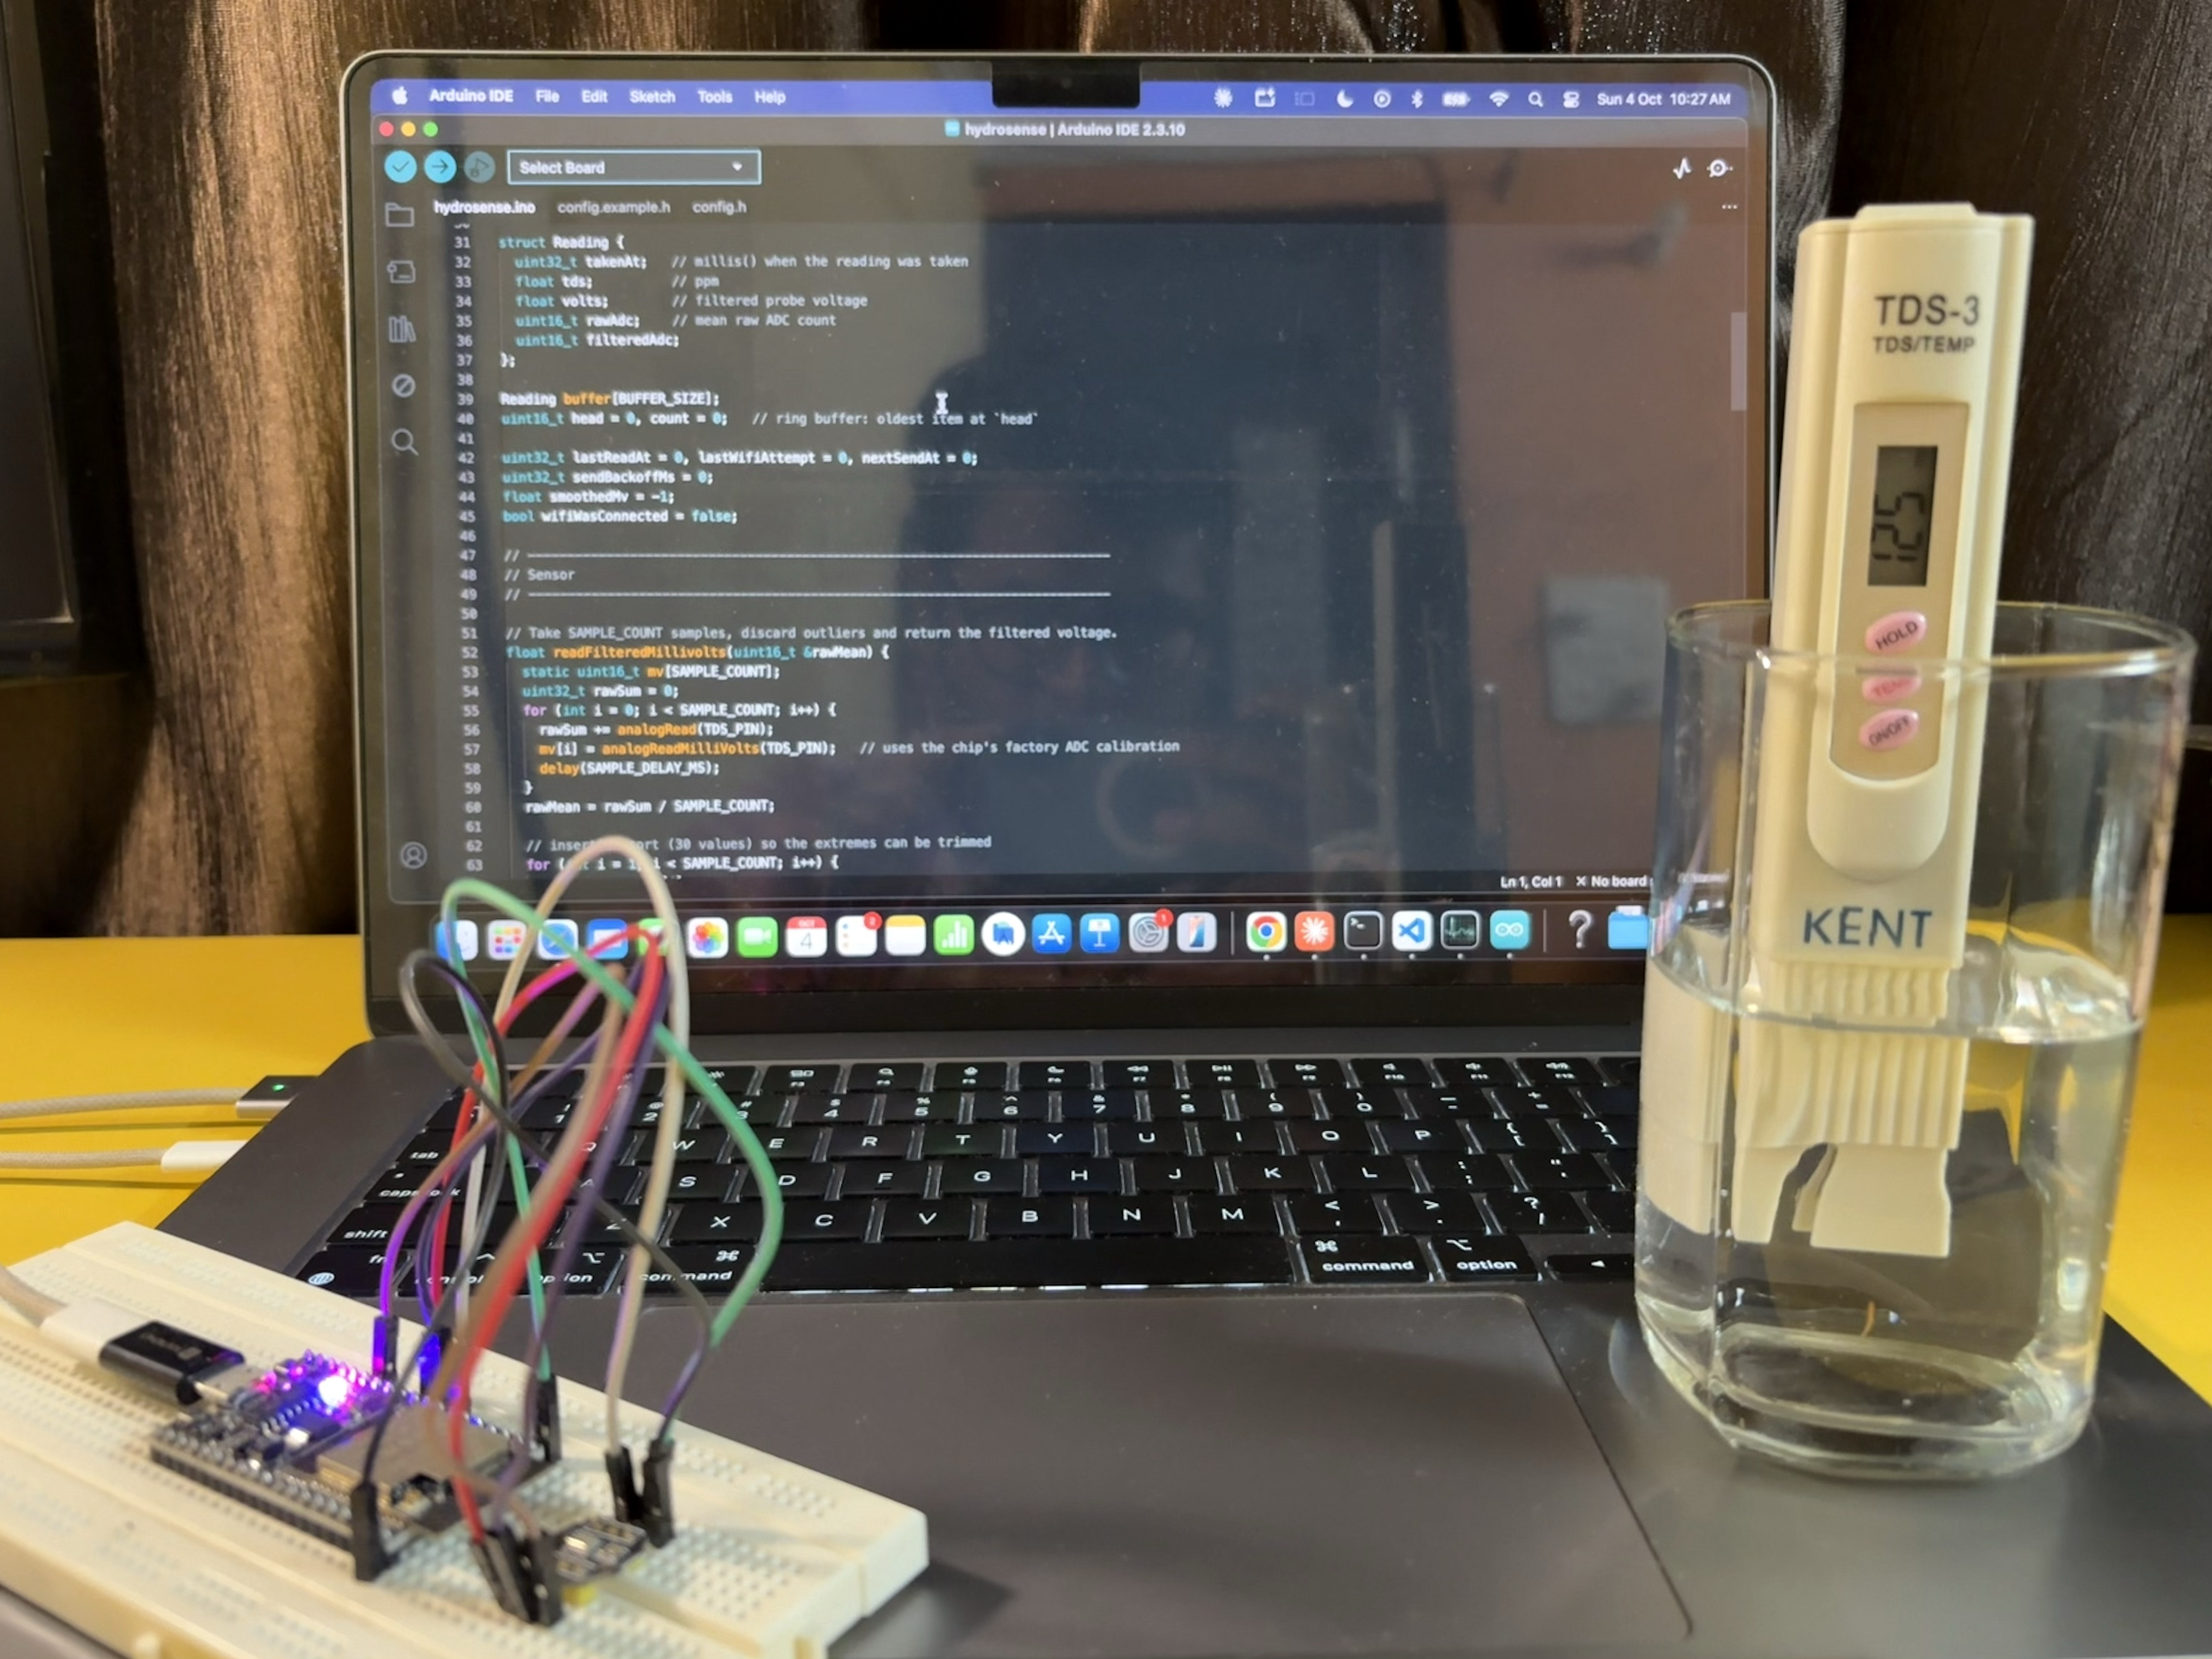
Integrated_Hardware
-
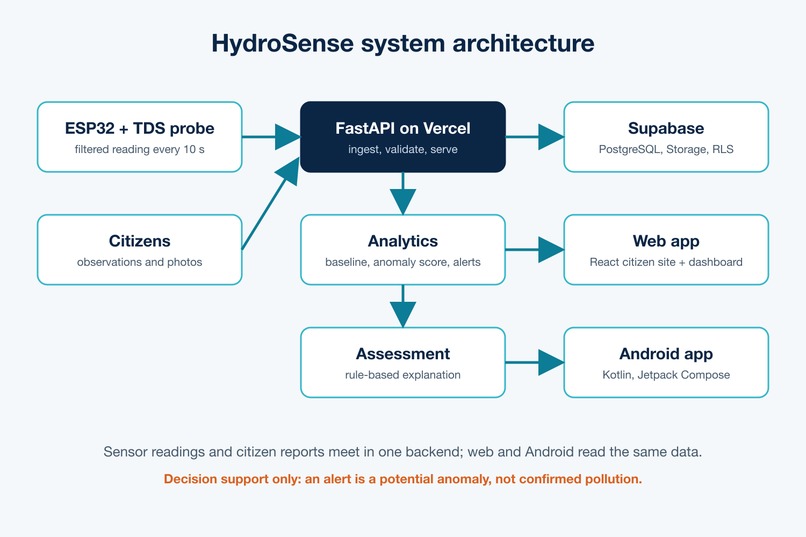
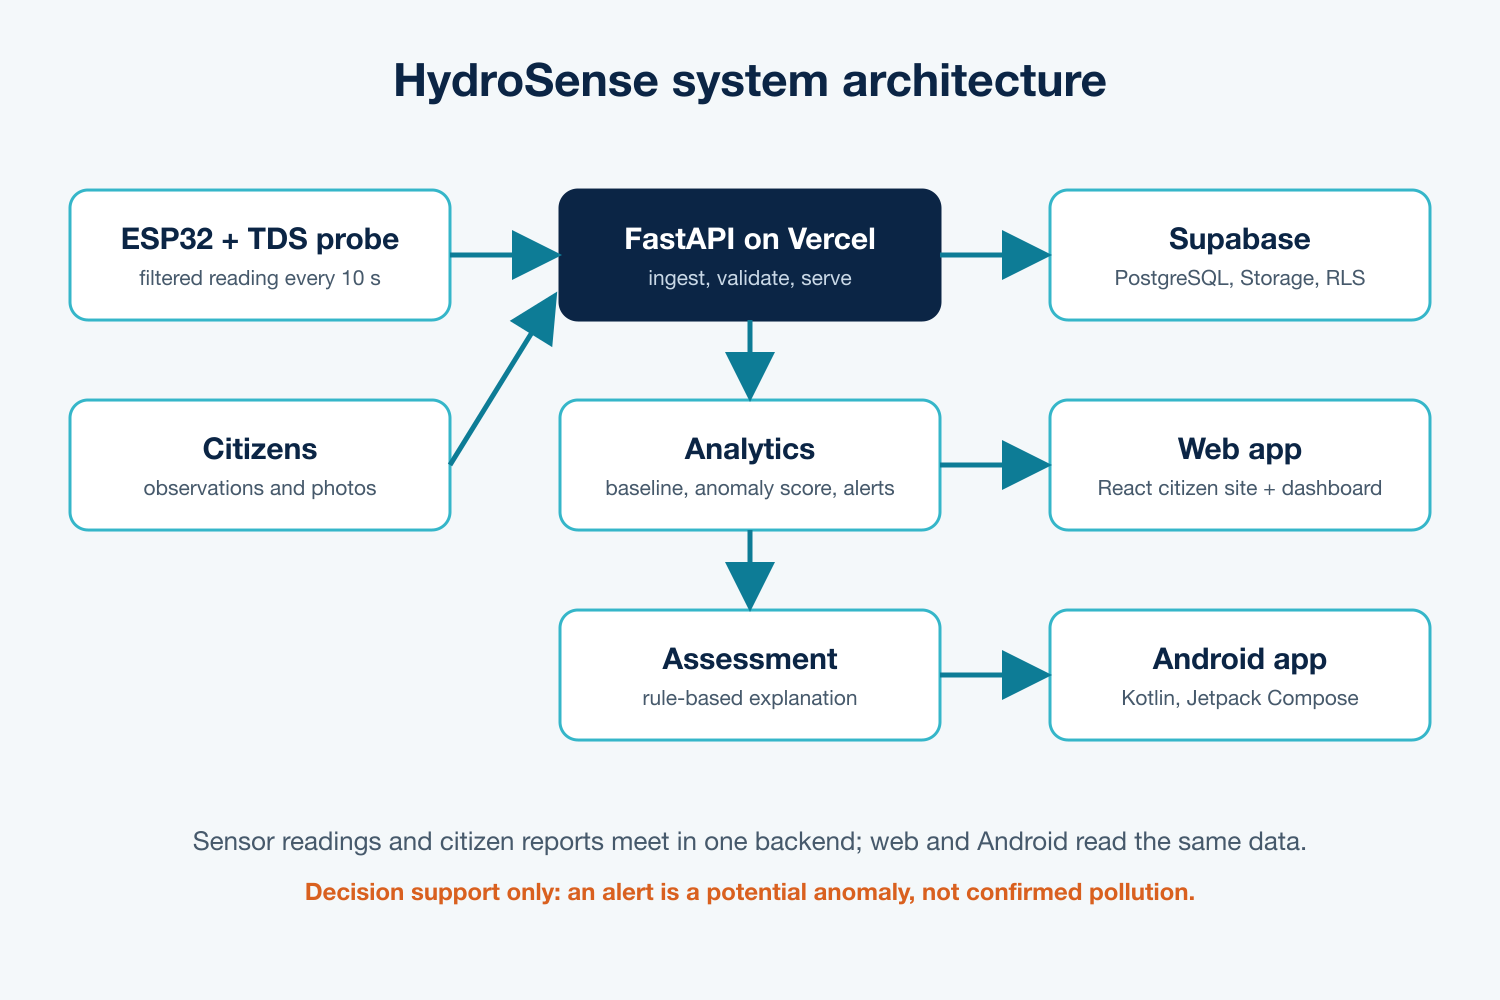
System Architecture
-
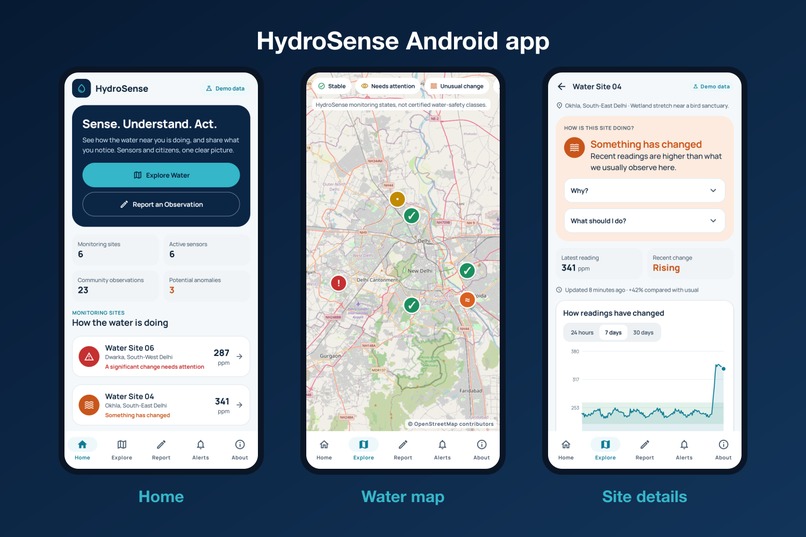
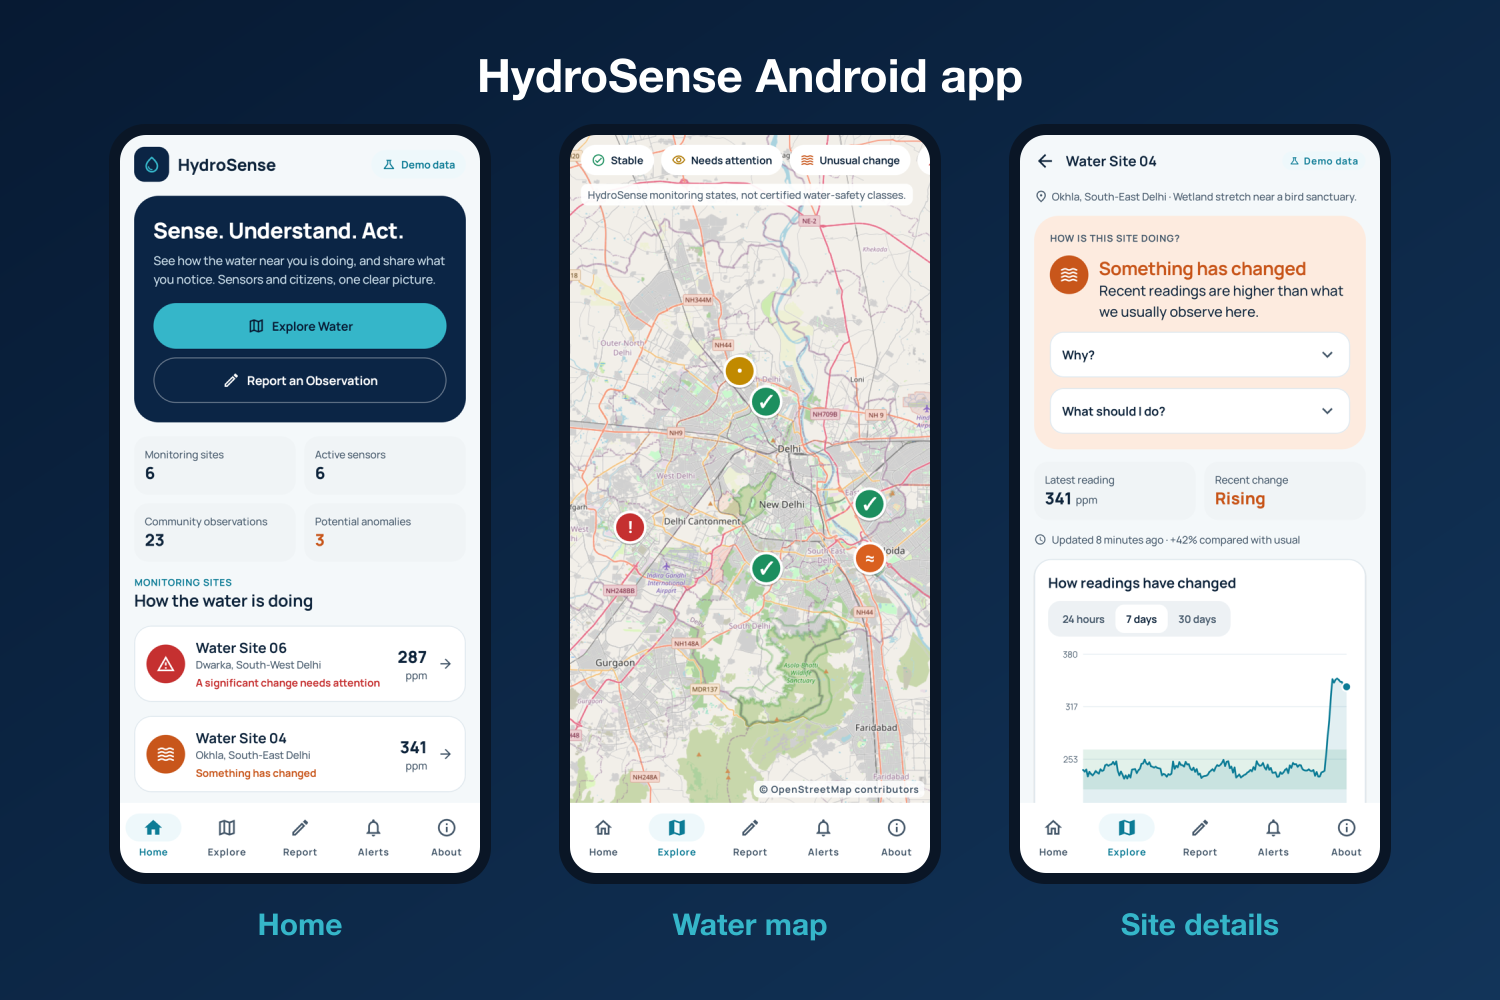
Android Screens 1 - Homepage, Map and Site Details
-
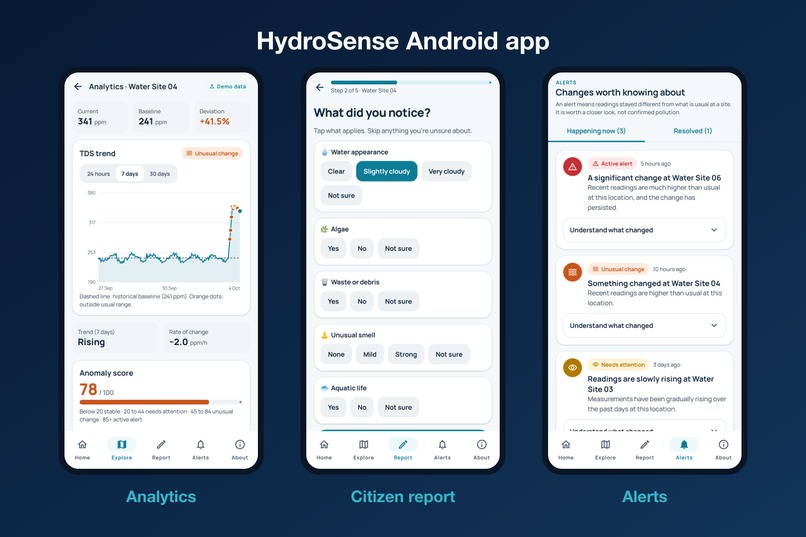
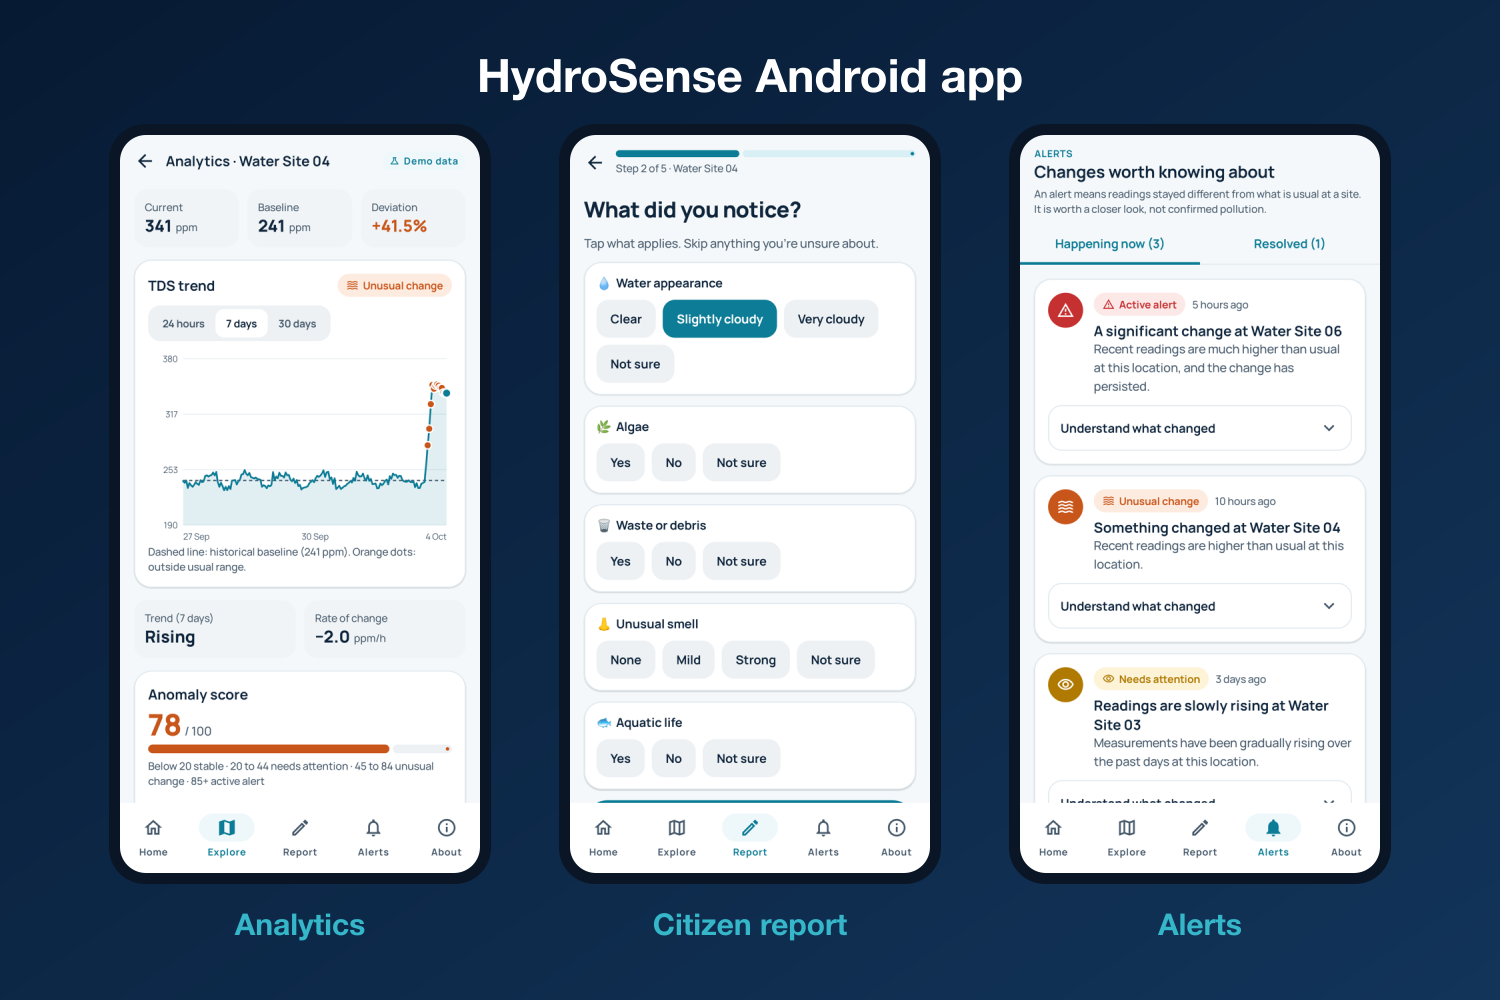
Android Screens 2 - Analytics, Citizen Reports and Alerts
-
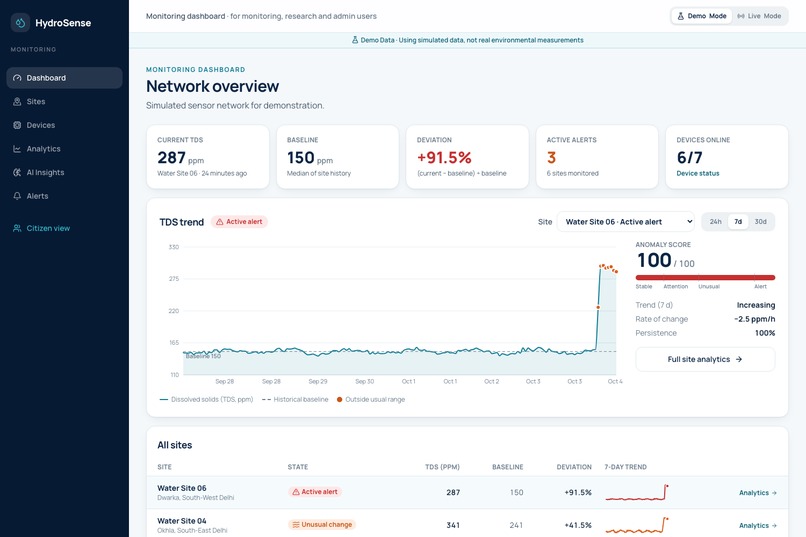
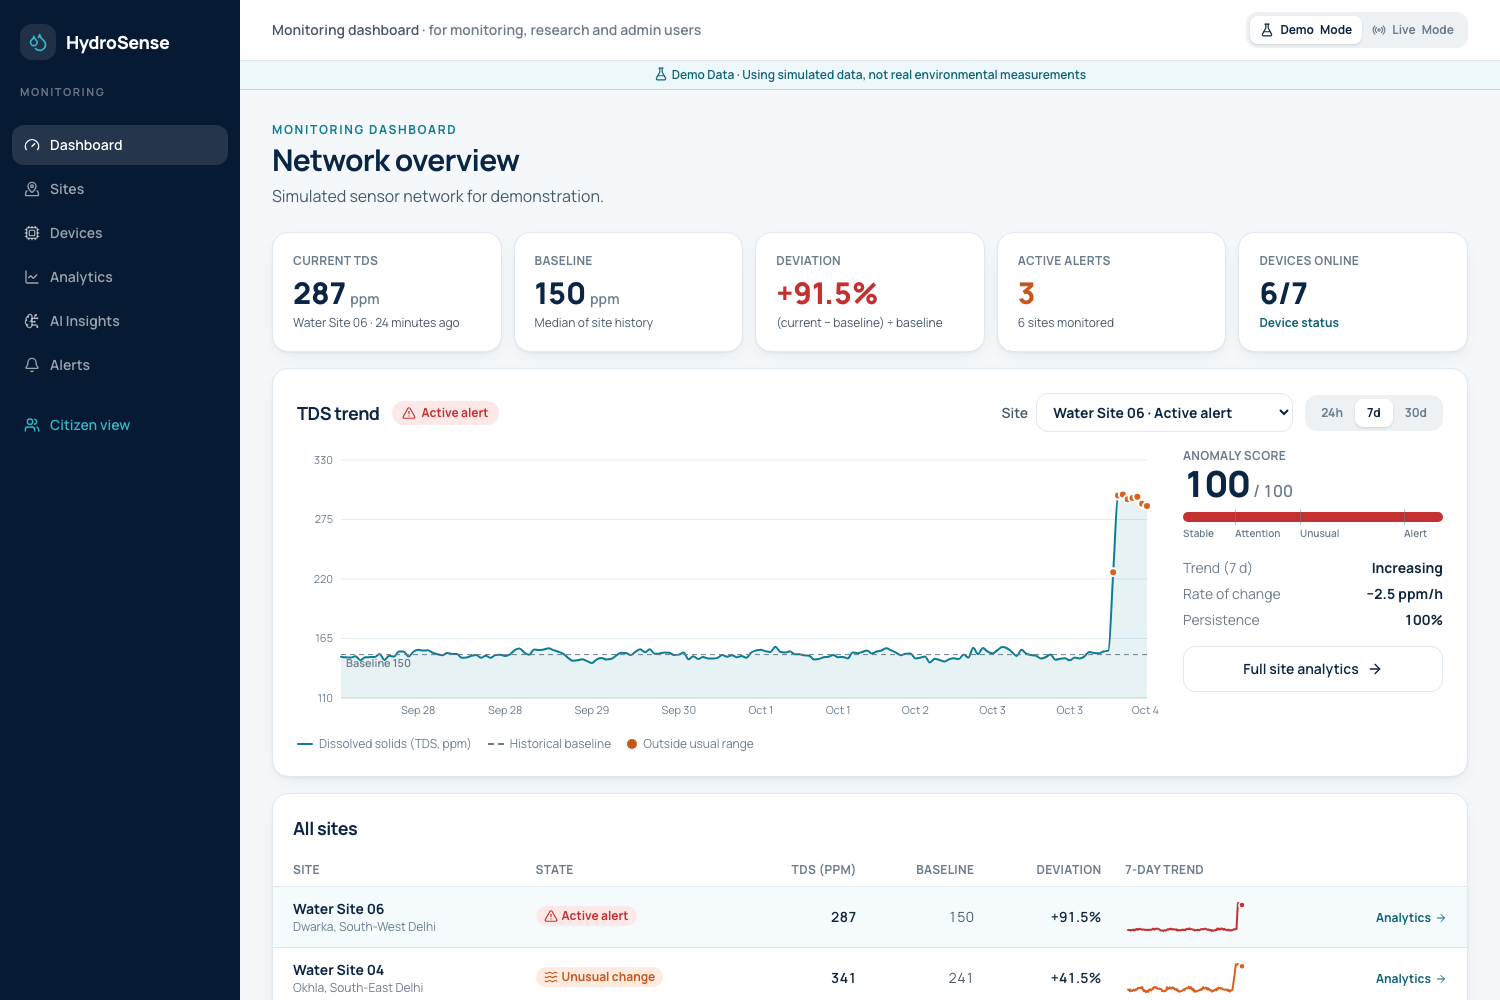
Dashboard
-
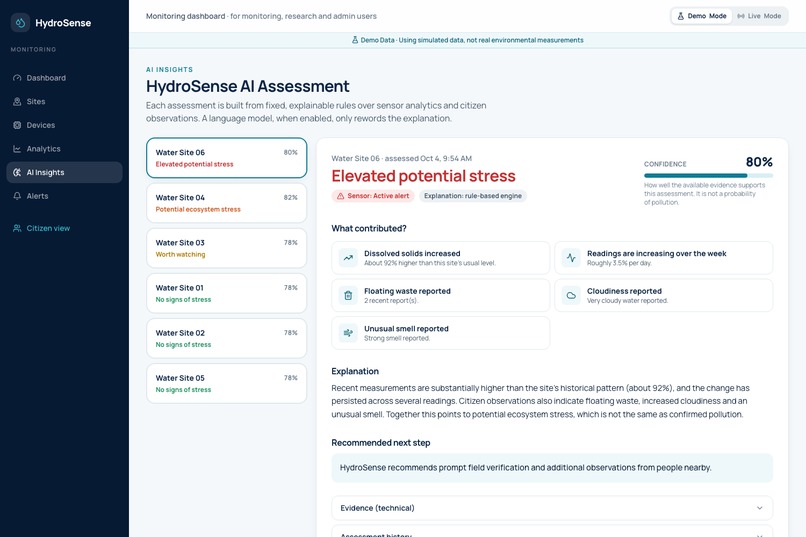
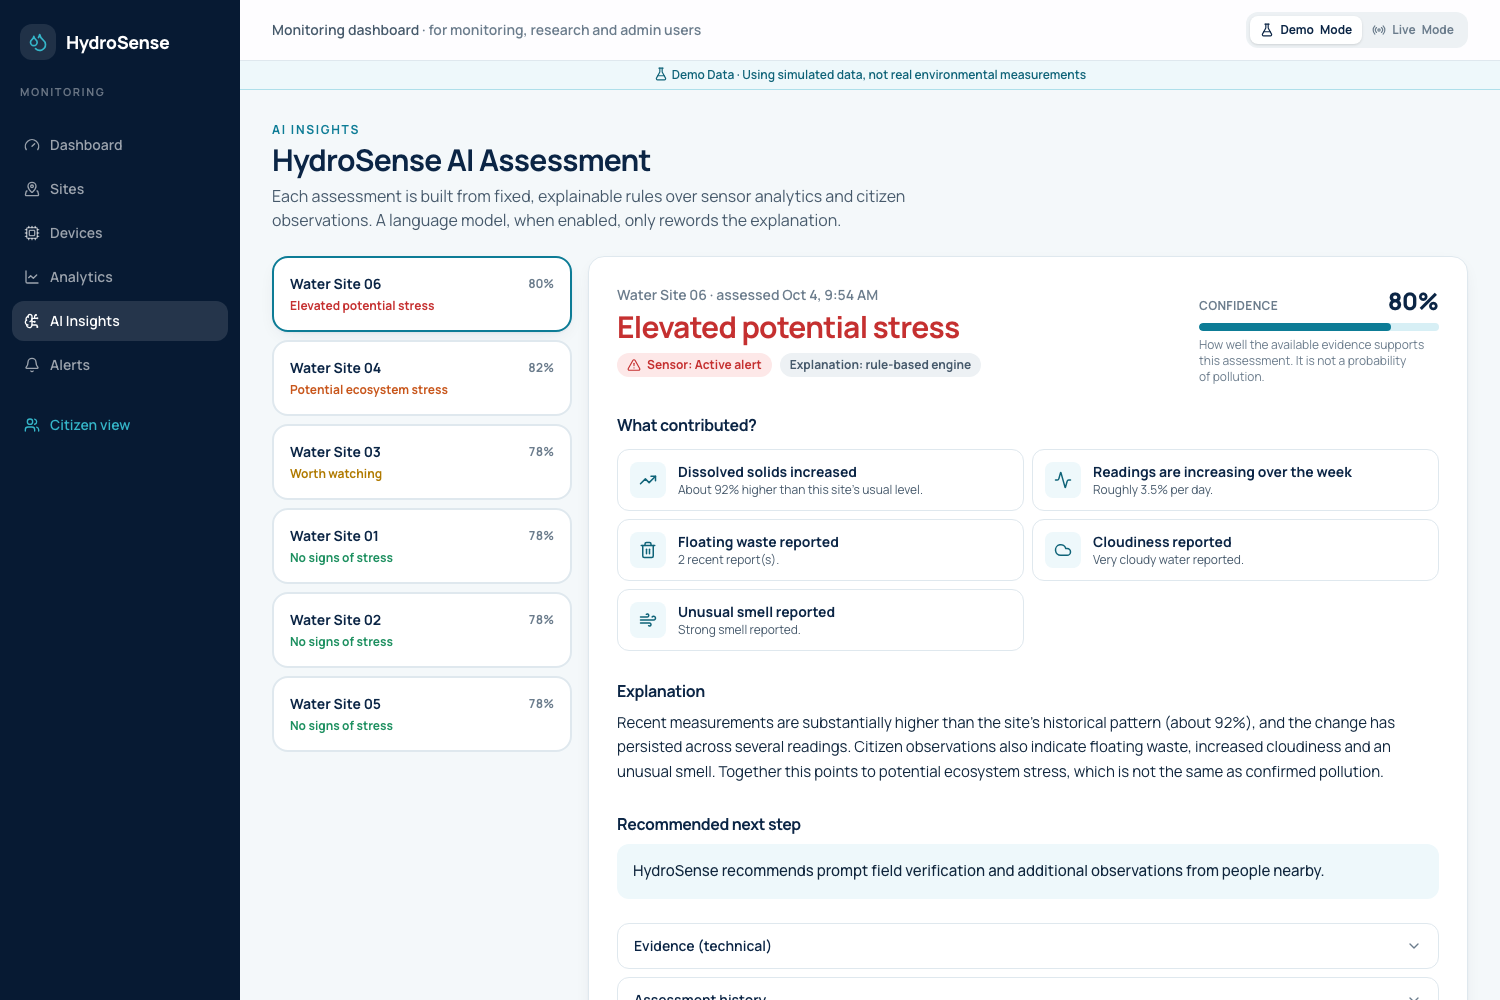
AI Assessment Insights
-
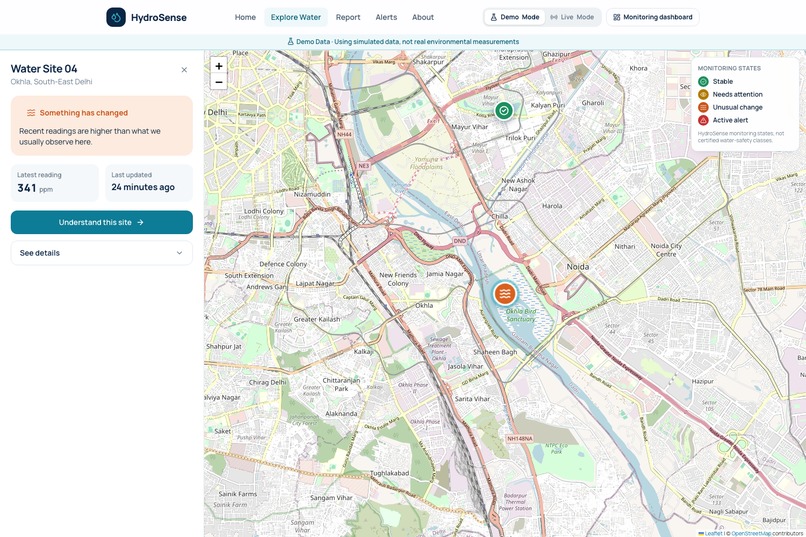
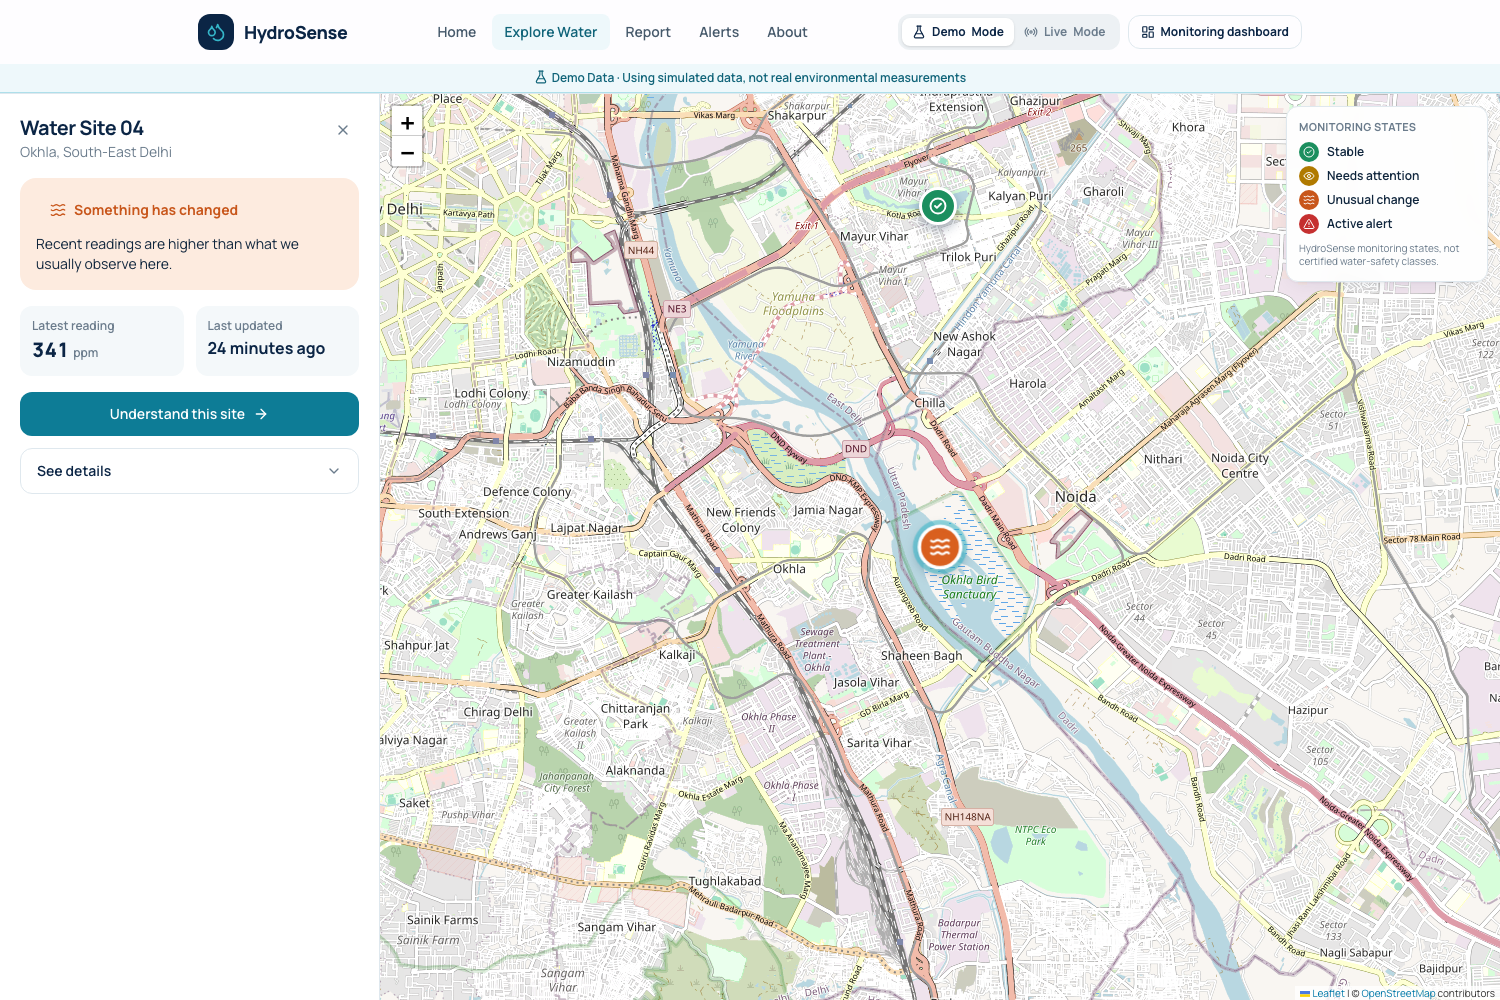
Website Explore Map
-
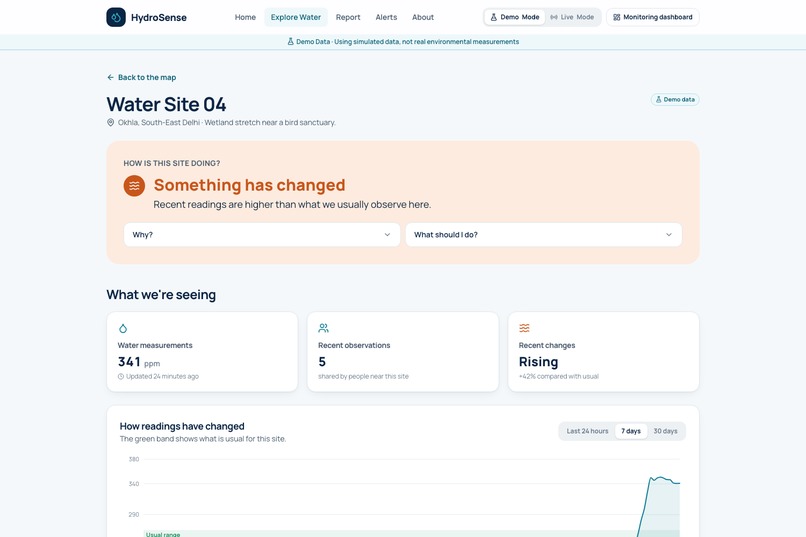
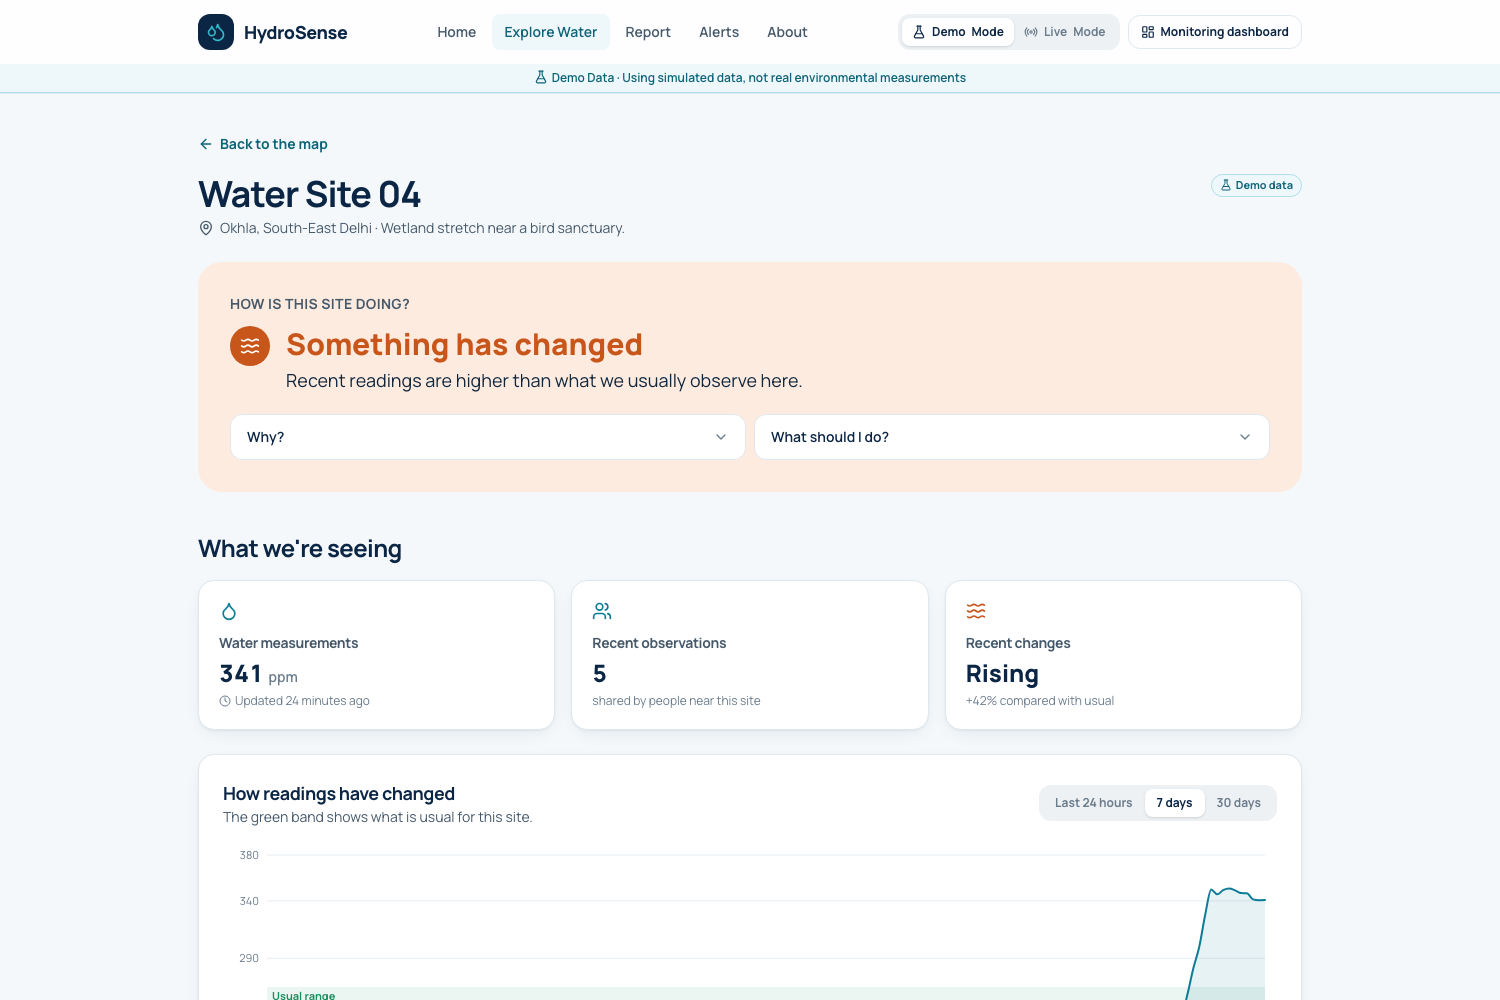
Web Details
-
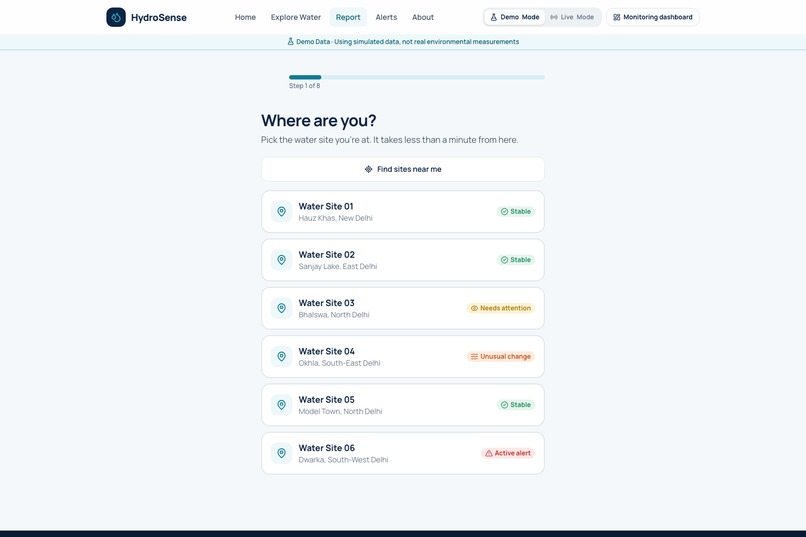
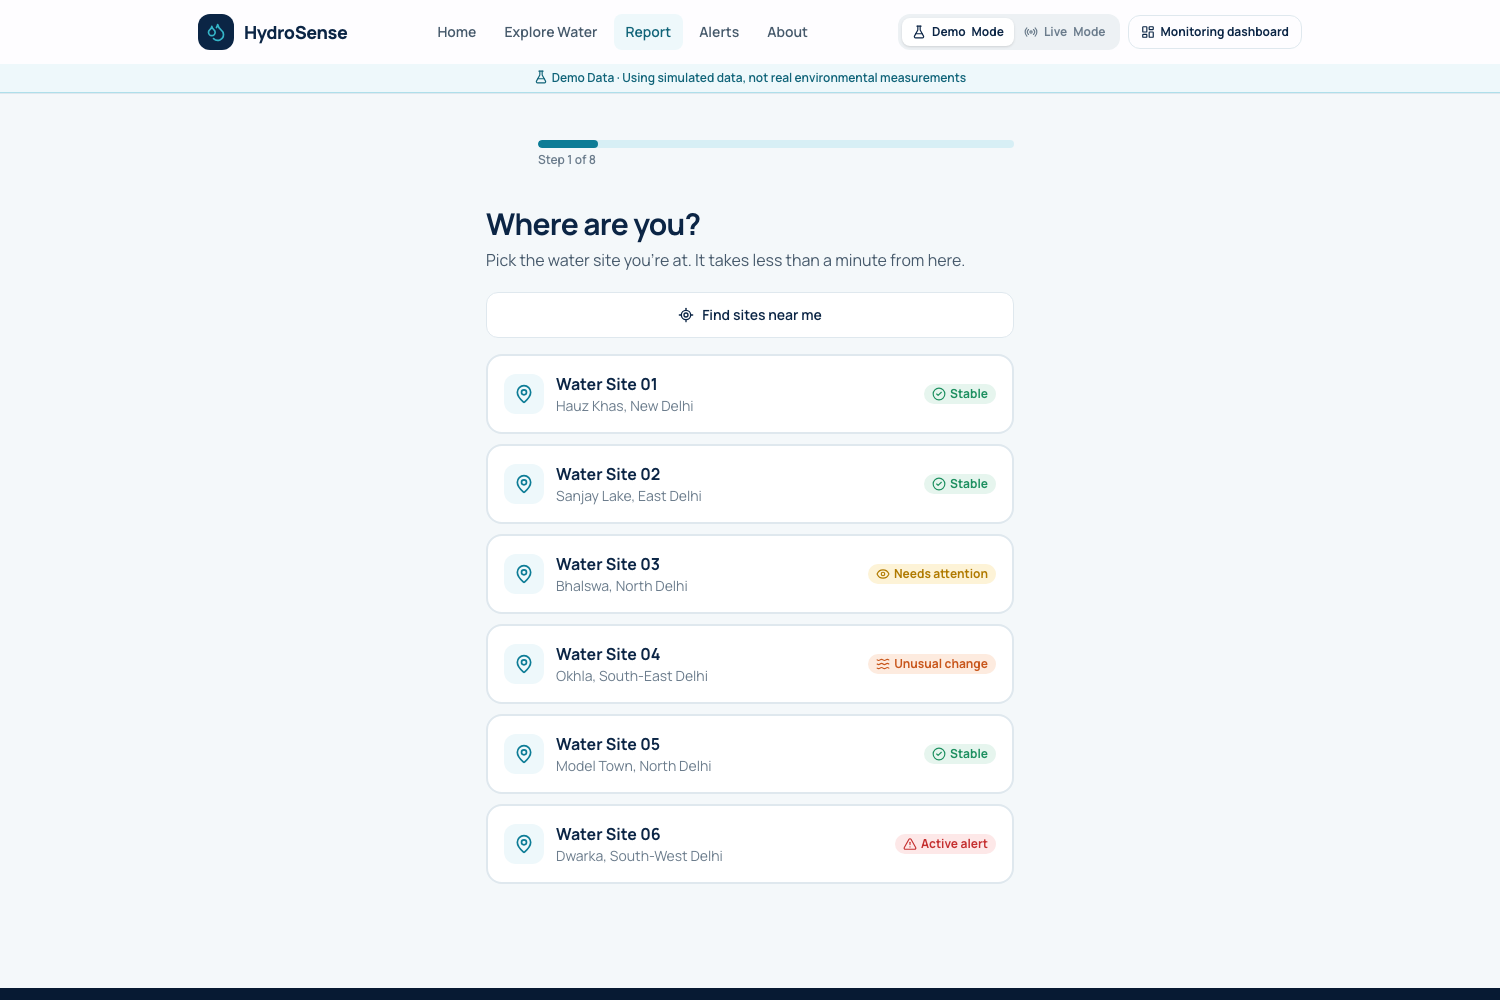
WaterSite Report
-
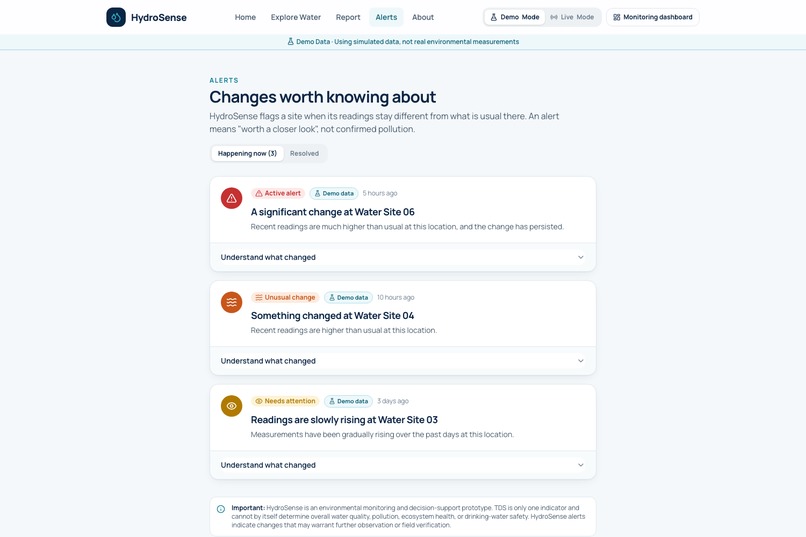
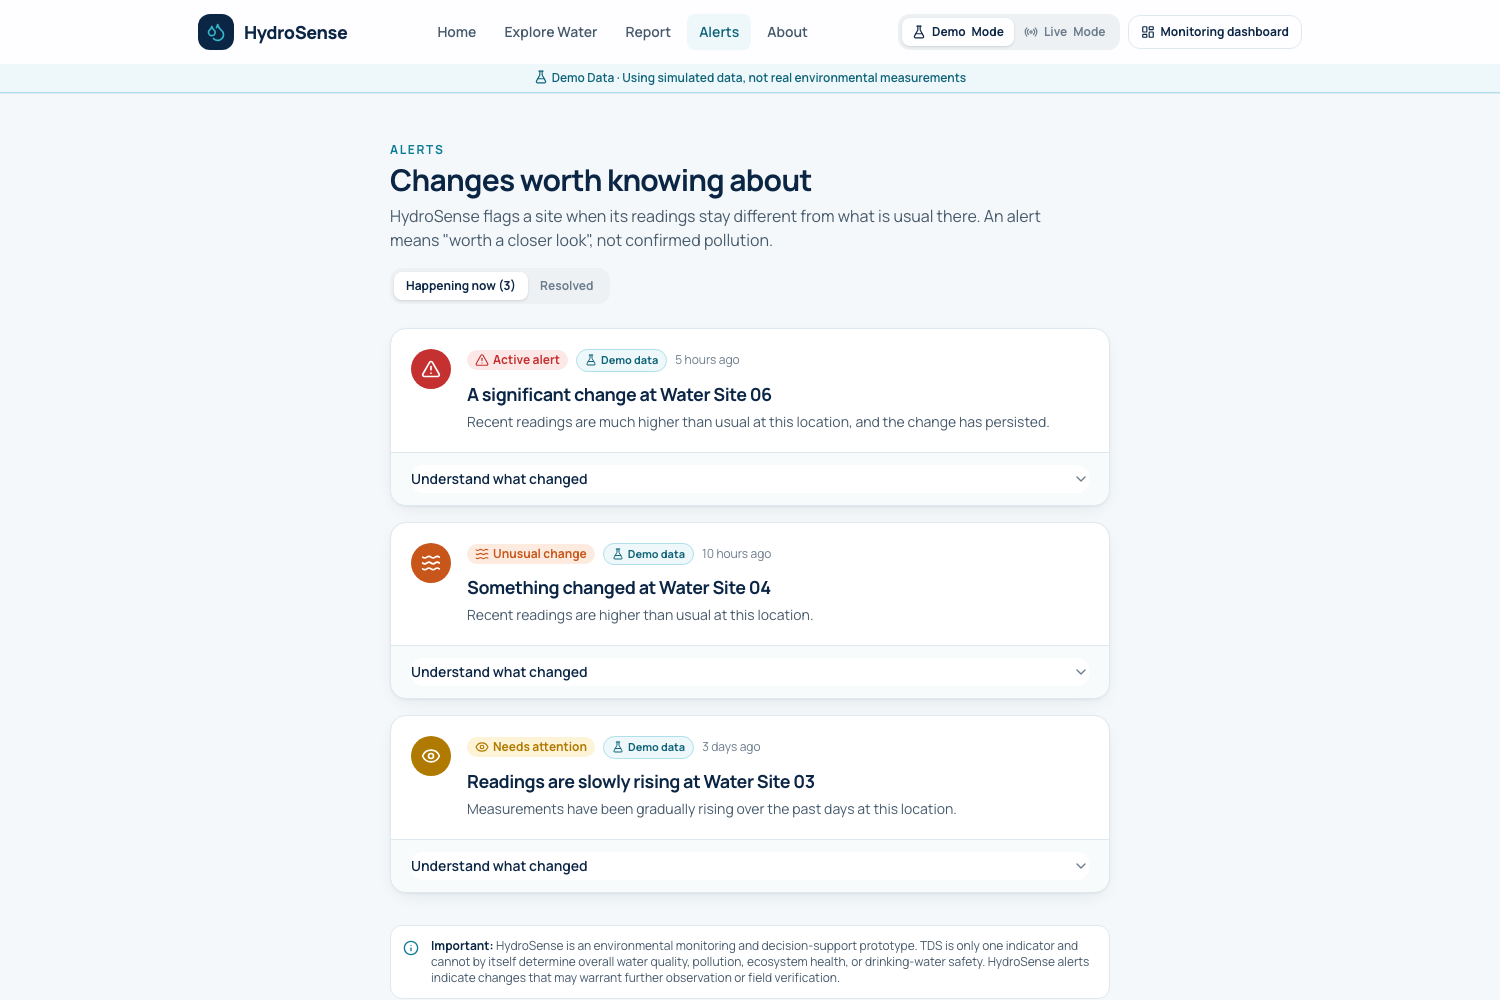
Alerts
-
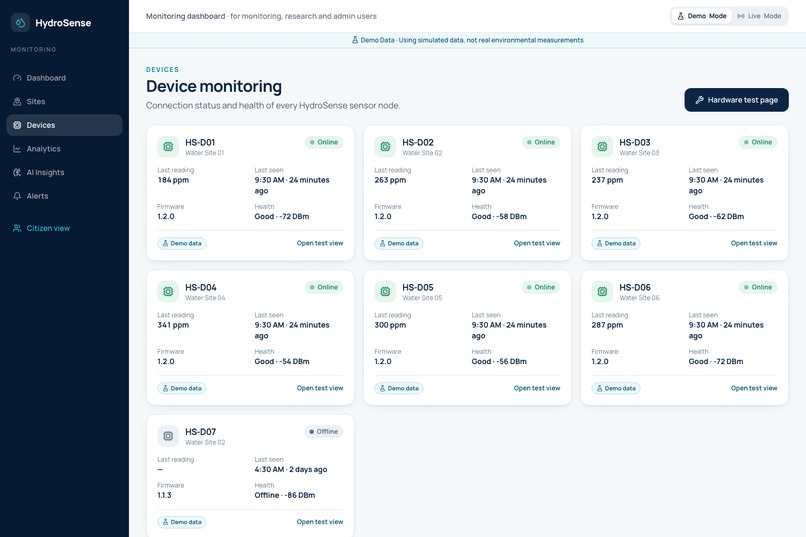
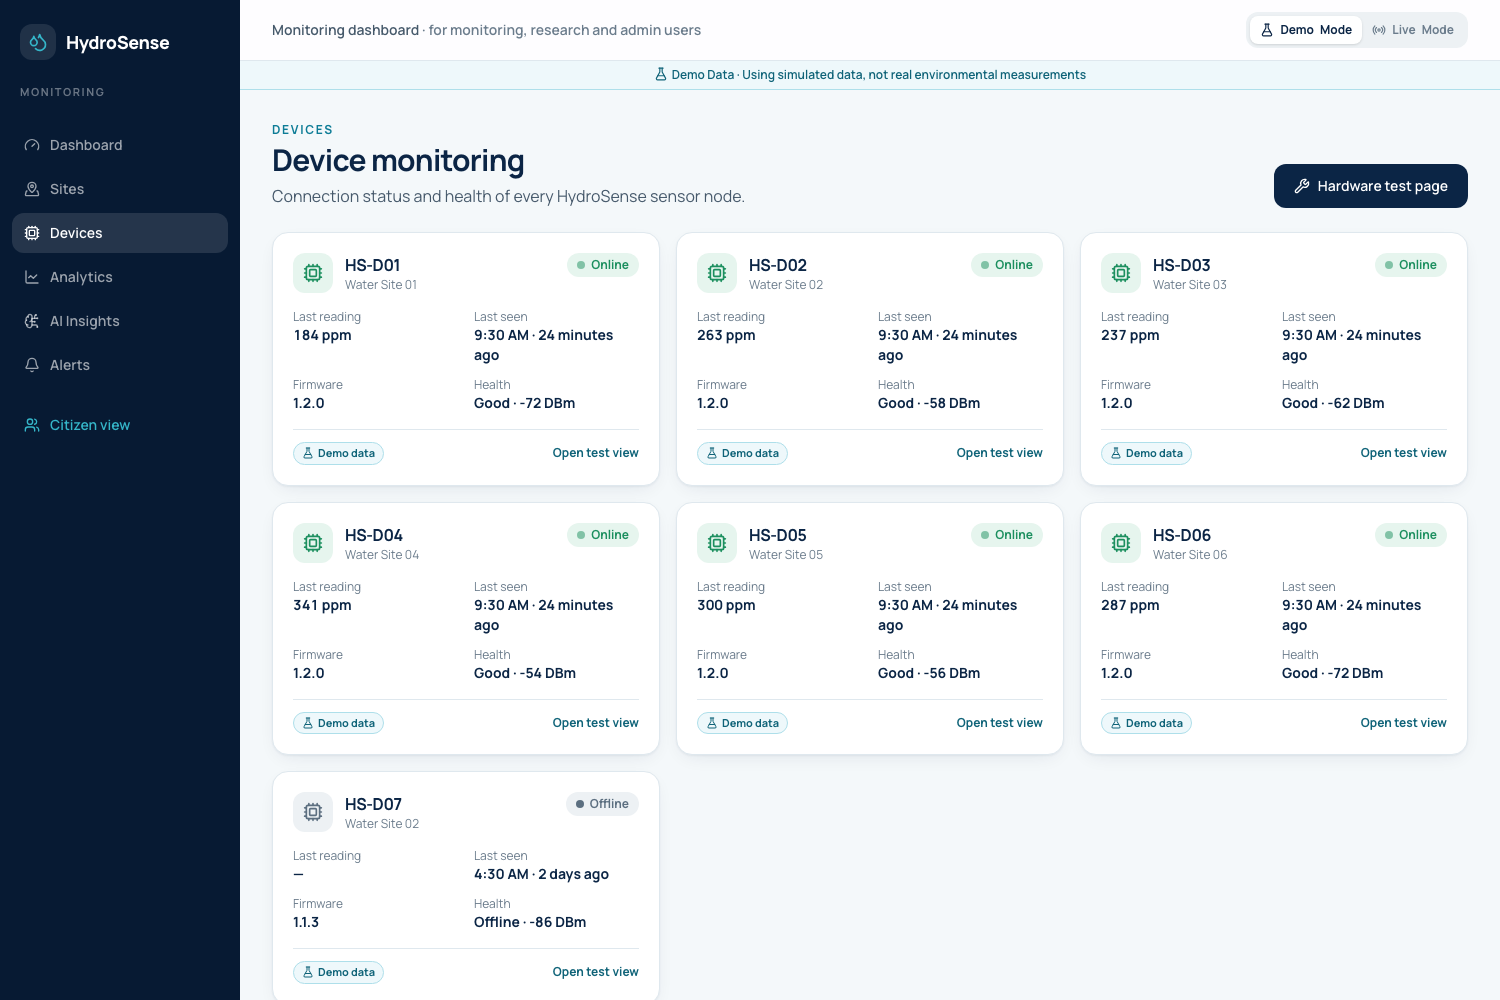
Device Monitoring
Inspiration
Urban lakes and ponds change quickly, but they are usually checked only by occasional manual samples. Between visits, nobody sees what is happening. Meanwhile the people who walk past these places every day notice things, such as cloudy water, algae, a strange smell, and have no simple way to share them or to understand what a sensor reading means.
We wanted to connect those two signals: a low-cost sensor that never stops measuring, and citizens who can say what they see.
What it does
HydroSense is a citizen-powered freshwater monitoring platform. Sense. Understand. Act.
- Sense: an ESP32 with a TDS probe sends a filtered reading every 10 seconds over Wi-Fi.
- Understand: each site is compared with its own history. Sustained changes are scored, explained in plain language, and combined with citizen observations.
- Act: citizens and monitoring teams see alerts with the evidence behind them and a recommended next step.
It runs as a web app (citizen site plus a monitoring dashboard) and a native Android app, both on the same backend and data. Citizens can report water clarity, algae, waste, odour and aquatic life with an optional photo, with no account needed.
Try it: https://hydrosense-beta.vercel.app
How we built it
- Firmware (ESP32, Arduino C++): 30 ADC samples per reading on GPIO34, the extreme 20% trimmed, exponential smoothing, conversion to ppm, a 120-reading offline buffer, and HTTPS upload with retry.
- Backend (Python, FastAPI on Vercel): ingestion, analytics, alerting and assessment.
- Data (Supabase): PostgreSQL and Storage with Row Level Security. The public can read; all writes go through the API.
- Web (React, TypeScript, Vite, Tailwind, Leaflet, Recharts): citizen pages and a monitoring dashboard.
- Android (Kotlin, Jetpack Compose, Material 3): map, site pages, analytics, reporting with photo, alerts, offline cache and a queue for reports made offline.
The analytics are deliberately simple and transparent. The baseline \(b\) is the median of a site's own history, and the spread uses the median absolute deviation:
$$ s = \max\big(1.4826 \cdot \mathrm{MAD},\; 0.03\,b,\; 3\big) $$
For a current reading \(x\):
$$ d = \frac{x - b}{b} \times 100\% \qquad z = \frac{x - b}{s} $$
The anomaly score (0 to 100) is a weighted sum of four parts:
$$ \text{score} = 55\,M + 15\,S + 20\,P + 10\,D $$
where \(M\) is the size of the deviation, \(S\) its statistical significance, \(P\) persistence (the share of recent evaluation points that agree) and \(D\) how fast it is changing. A single noisy reading can never raise an alert: at least half of the recent points must agree.
The assessment is produced by a rule-based engine from the sensor analytics and recent citizen observations. An optional language model can reword the explanation, but it cannot change the result.
Challenges we ran into
- Alerts that flapped. A slow upward drift kept opening and closing alerts. We added hysteresis so a drift alert stays open until readings are clearly back near the baseline.
- A production deadlock. Parallel database queries shared one thread pool and froze on a small serverless instance. Separate pools per nesting level fixed it, plus a retry wrapper for dropped connections.
- ESP32 analog pins and Wi-Fi. ADC2 pins are unusable while Wi-Fi is on, so the probe had to move to an ADC1 pin (GPIO34), powered from 3V3 to stay within what the board tolerates.
- Android details. A photo decode bug rejected valid images, and the chart's drag gesture blocked page scrolling until we limited it to horizontal drags.
- Being honest about the science. Writing every label and alert so it says "potential anomaly" and never "polluted" or "safe" took real care.
Accomplishments that we're proud of
- A full path from probe to phone: firmware, API, database, analytics, web and Android, deployed and working together.
- Alerts that show their own evidence and score breakdown instead of a black-box verdict.
- A reporting flow that takes under a minute and needs no account.
- Demo data that is generated by replaying simulated readings through the real analytics engine, and is labelled everywhere.
What we learned
- Comparing a site with its own history is far more useful than one fixed threshold for every site.
- Requiring persistence matters more than any clever statistic for avoiding false alarms.
- Plain language is a design problem: "higher than what we usually observe here" communicates better than a z-score.
- Serverless backends need care with concurrency and connection reuse.
What's next for HydroSense
- Add pH, turbidity and temperature sensing.
- Validate the thresholds against reference instruments in the field.
- Grow from one node to a community network of sites and reporters.
Important: HydroSense is a monitoring and decision-support prototype. TDS is one indicator and cannot by itself show that water is polluted or safe.
Built With
- android
- arduino
- c++
- esp32
- fastapi
- iot
- jetpack-compose
- kotlin
- leaflet.js
- material-design
- openstreetmap
- platformio
- postgresql
- python
- react
- recharts
- supabase
- tailwindcss
- typescript
- vercel
- vite


Log in or sign up for Devpost to join the conversation.