What inspired us
On 26 August 2026, the Bhote Koshi–Trishuli flood tore through a narrow Himalayan valley in Nepal. Roads, bridges and homes were buried under debris. In the first hours after a disaster like this, rescue teams ask three questions:
Where did it flood? What was damaged? Who is cut off?
Official damage maps often take days, and monsoon clouds hide the valley from normal satellite cameras. We wanted to see whether free satellite data and a small AI model could answer those questions within about an hour, for anyone with a laptop.
We called it HimRaksha: Him (हिम, snow/Himalaya) + Raksha (रक्षा, protection).
How we built it
Give HimRaksha an area and a flood date, and it runs this pipeline:
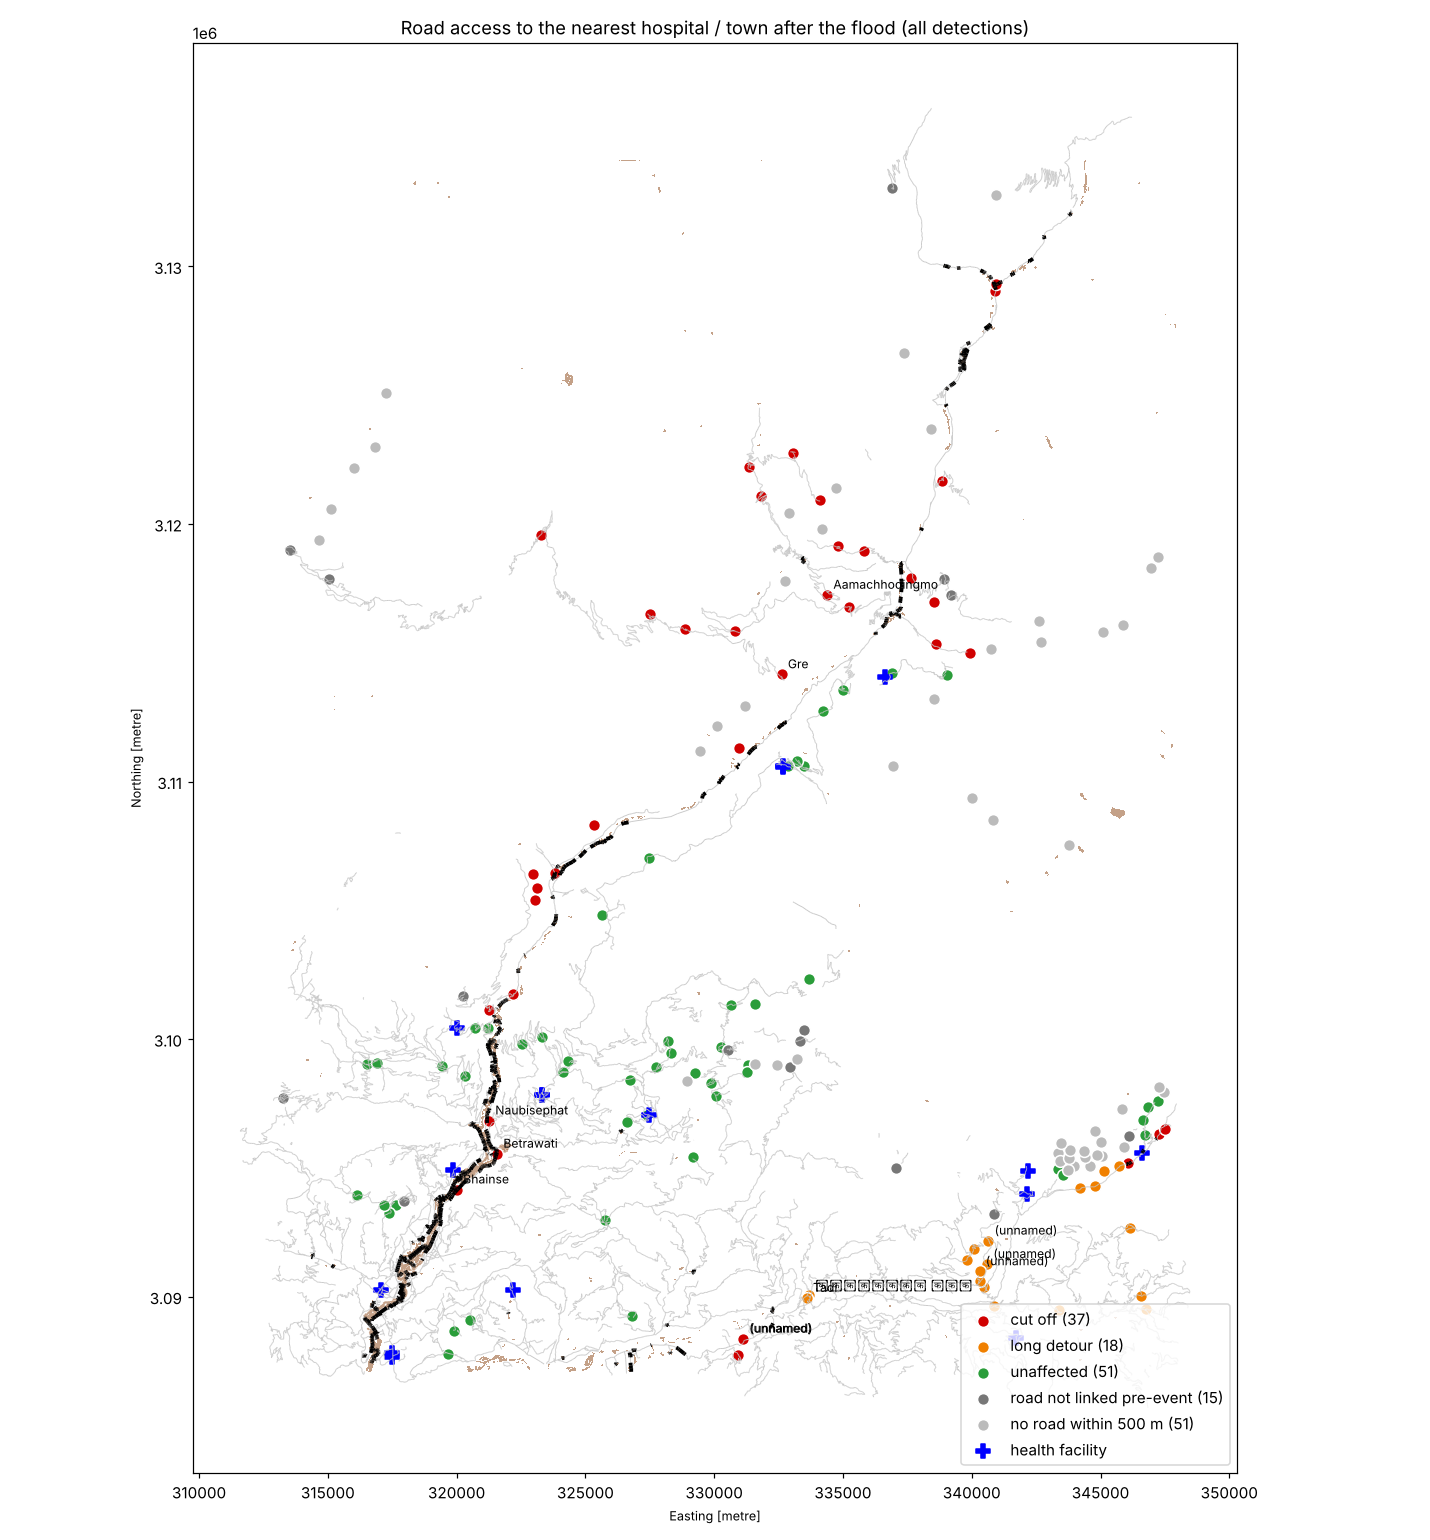
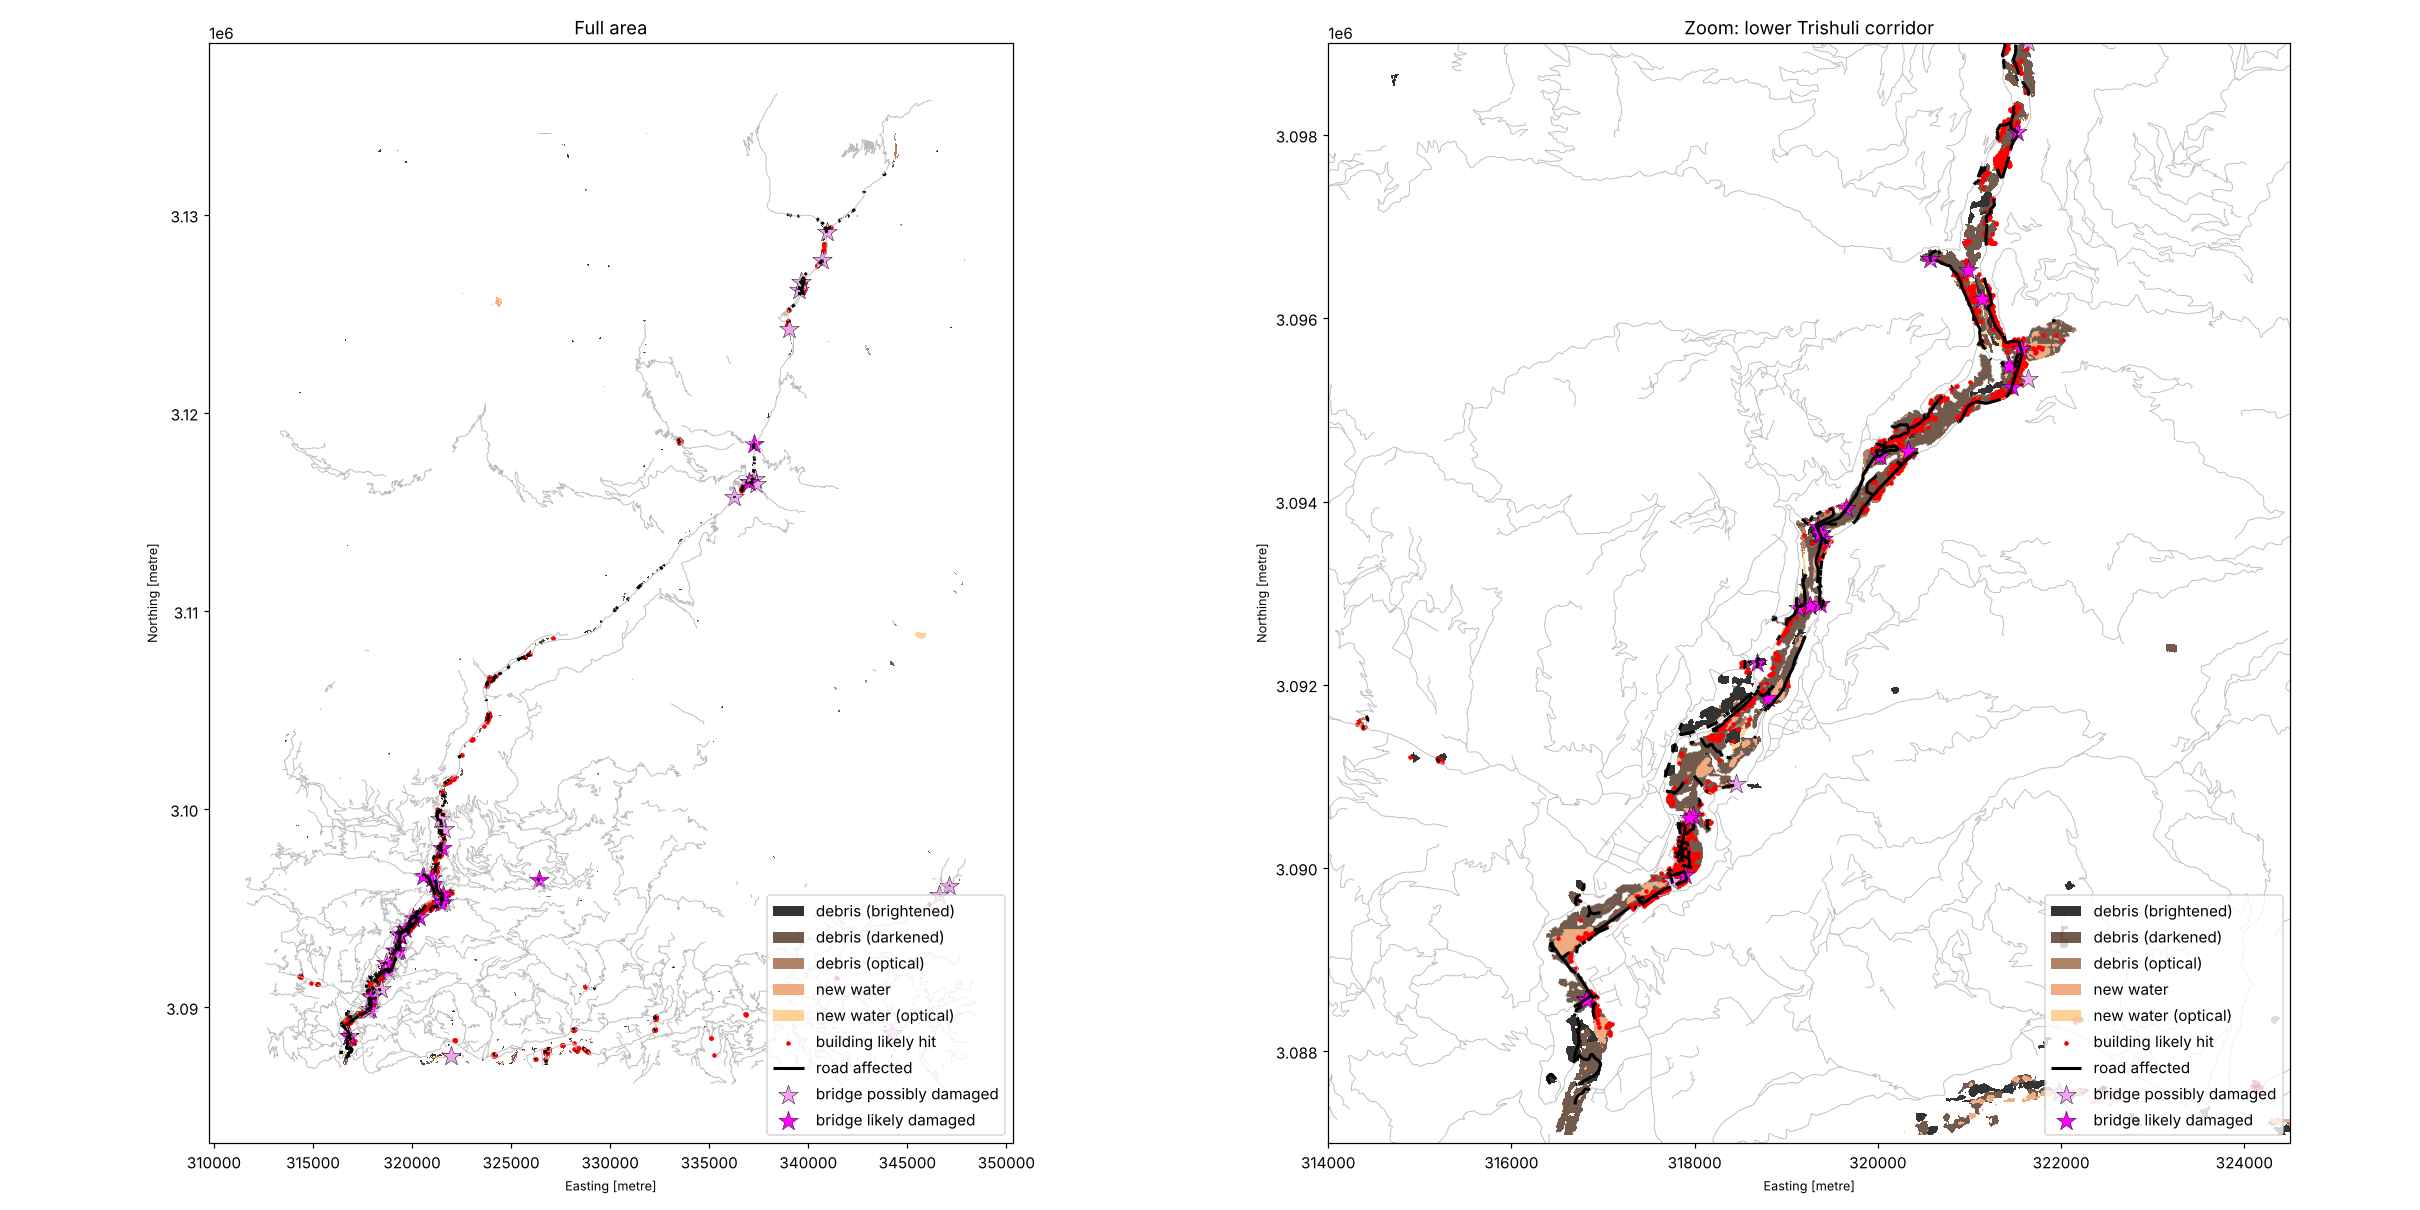
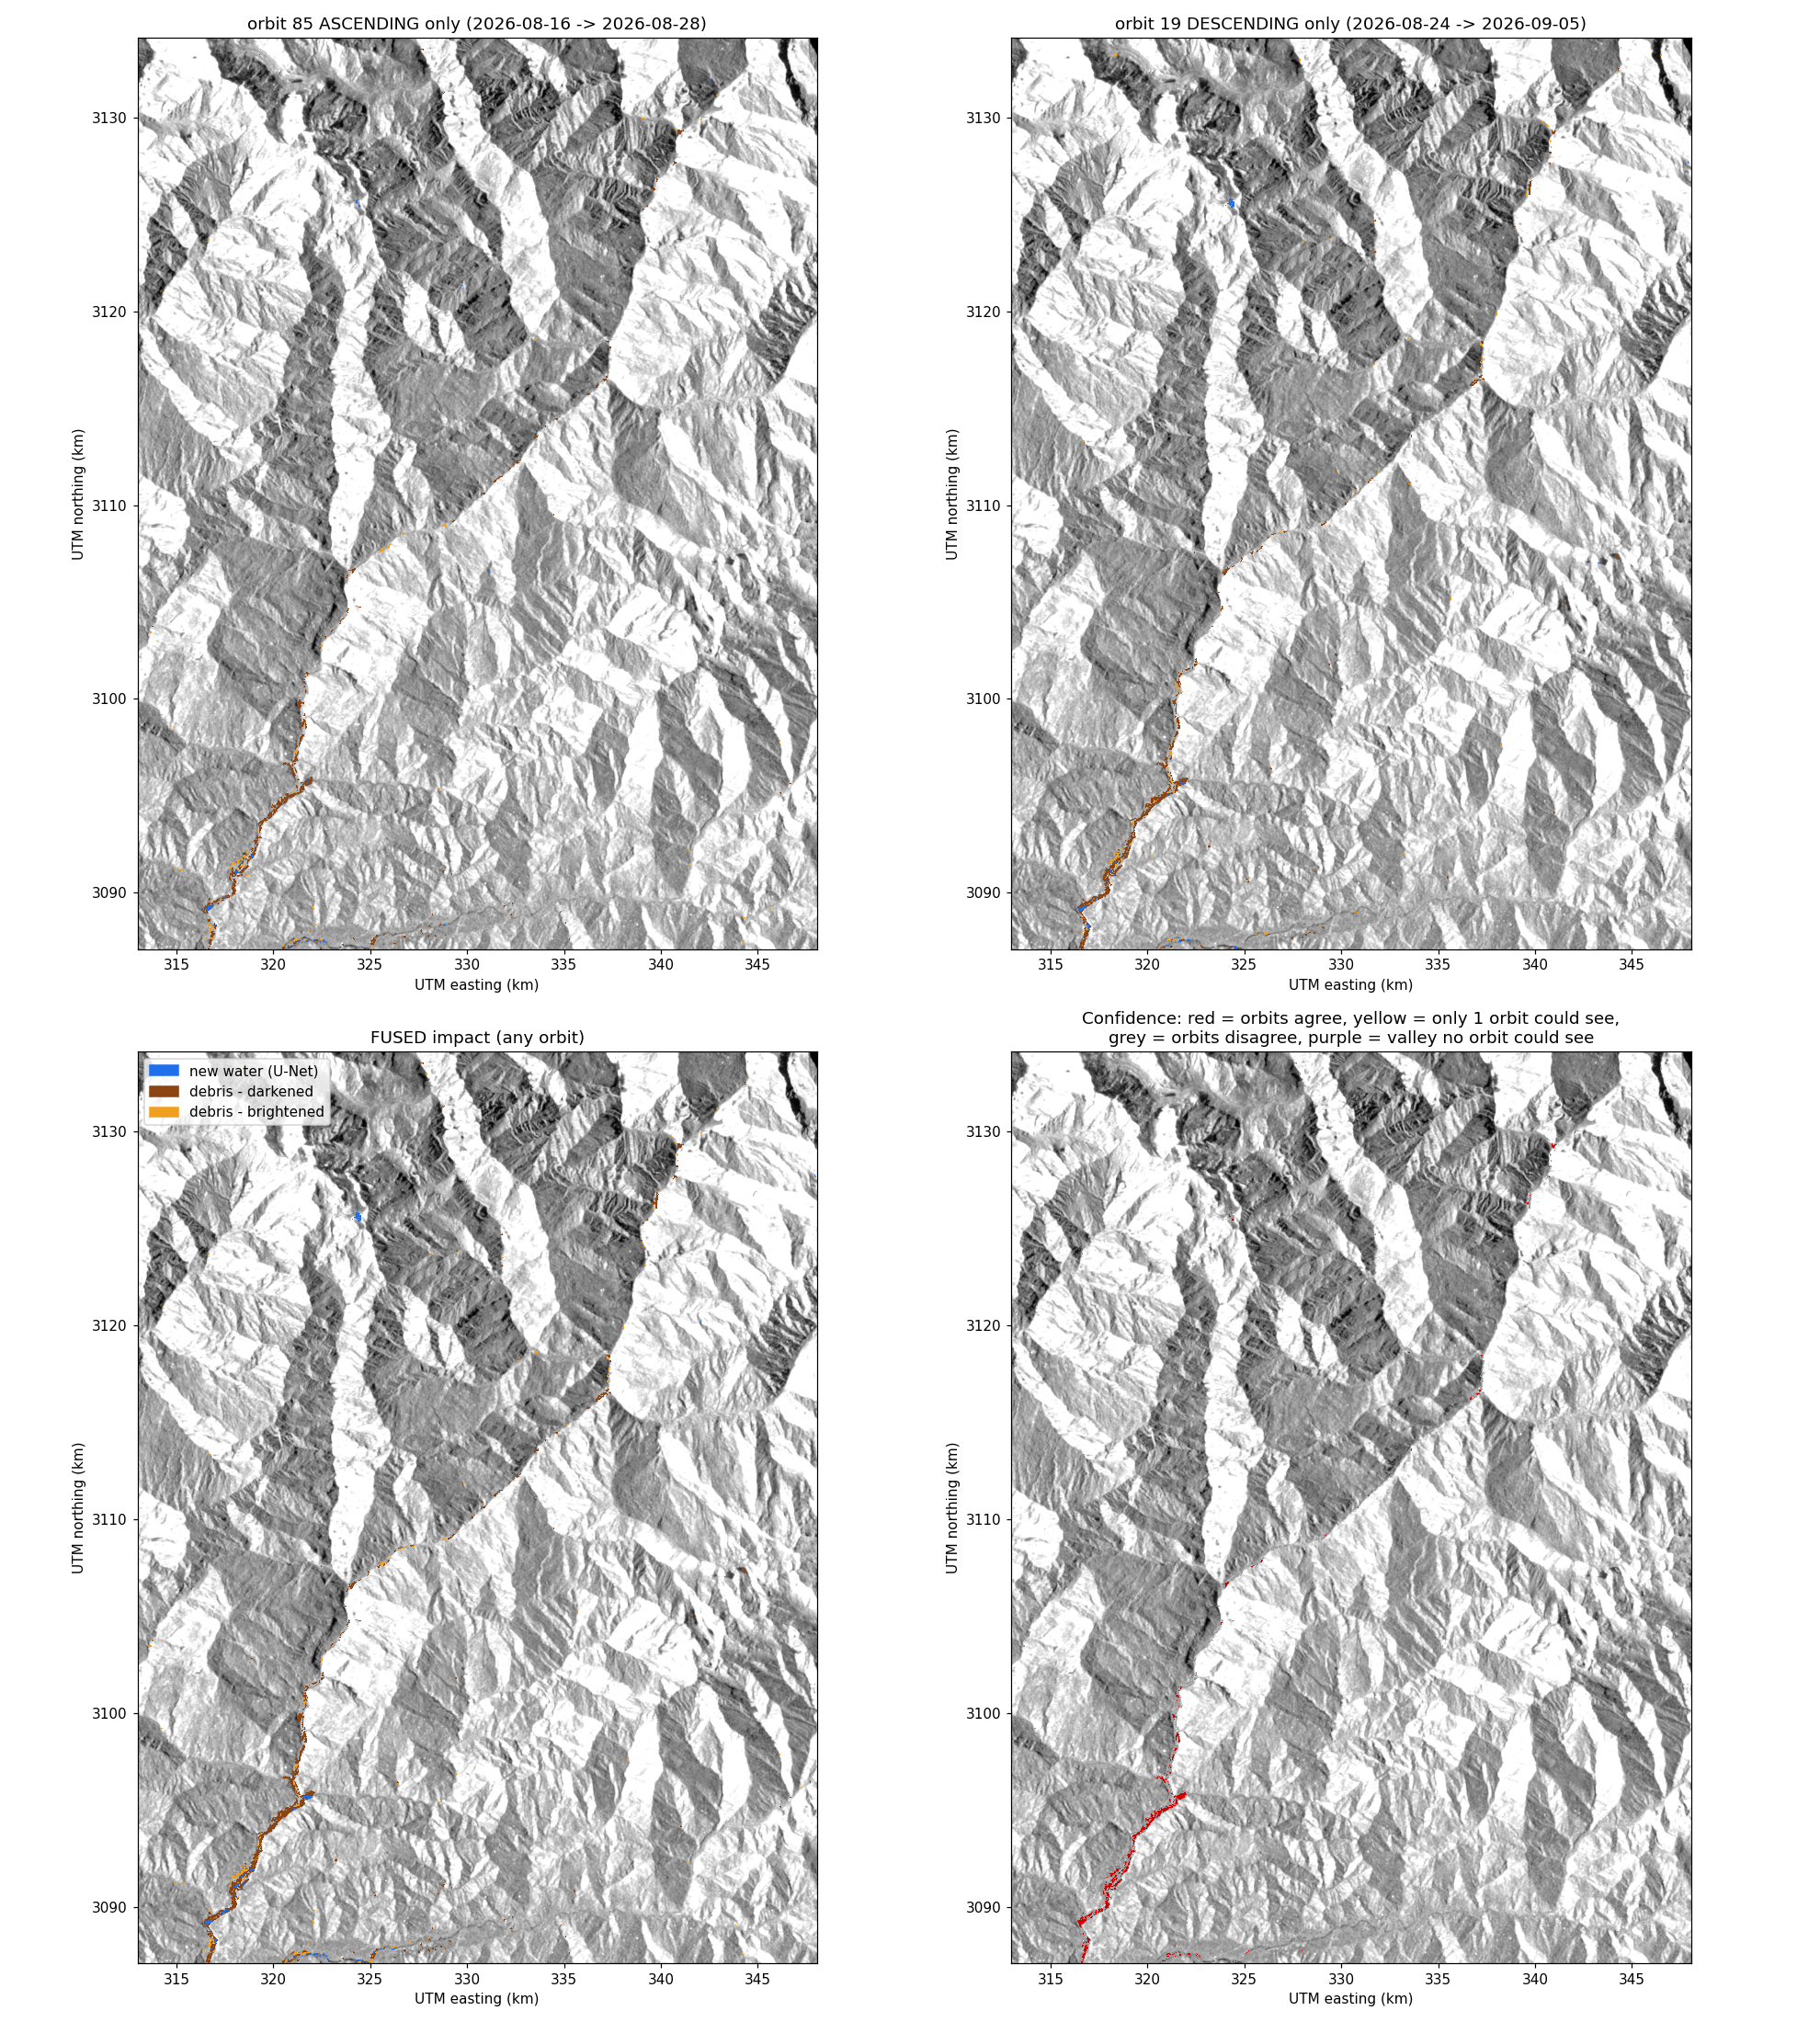
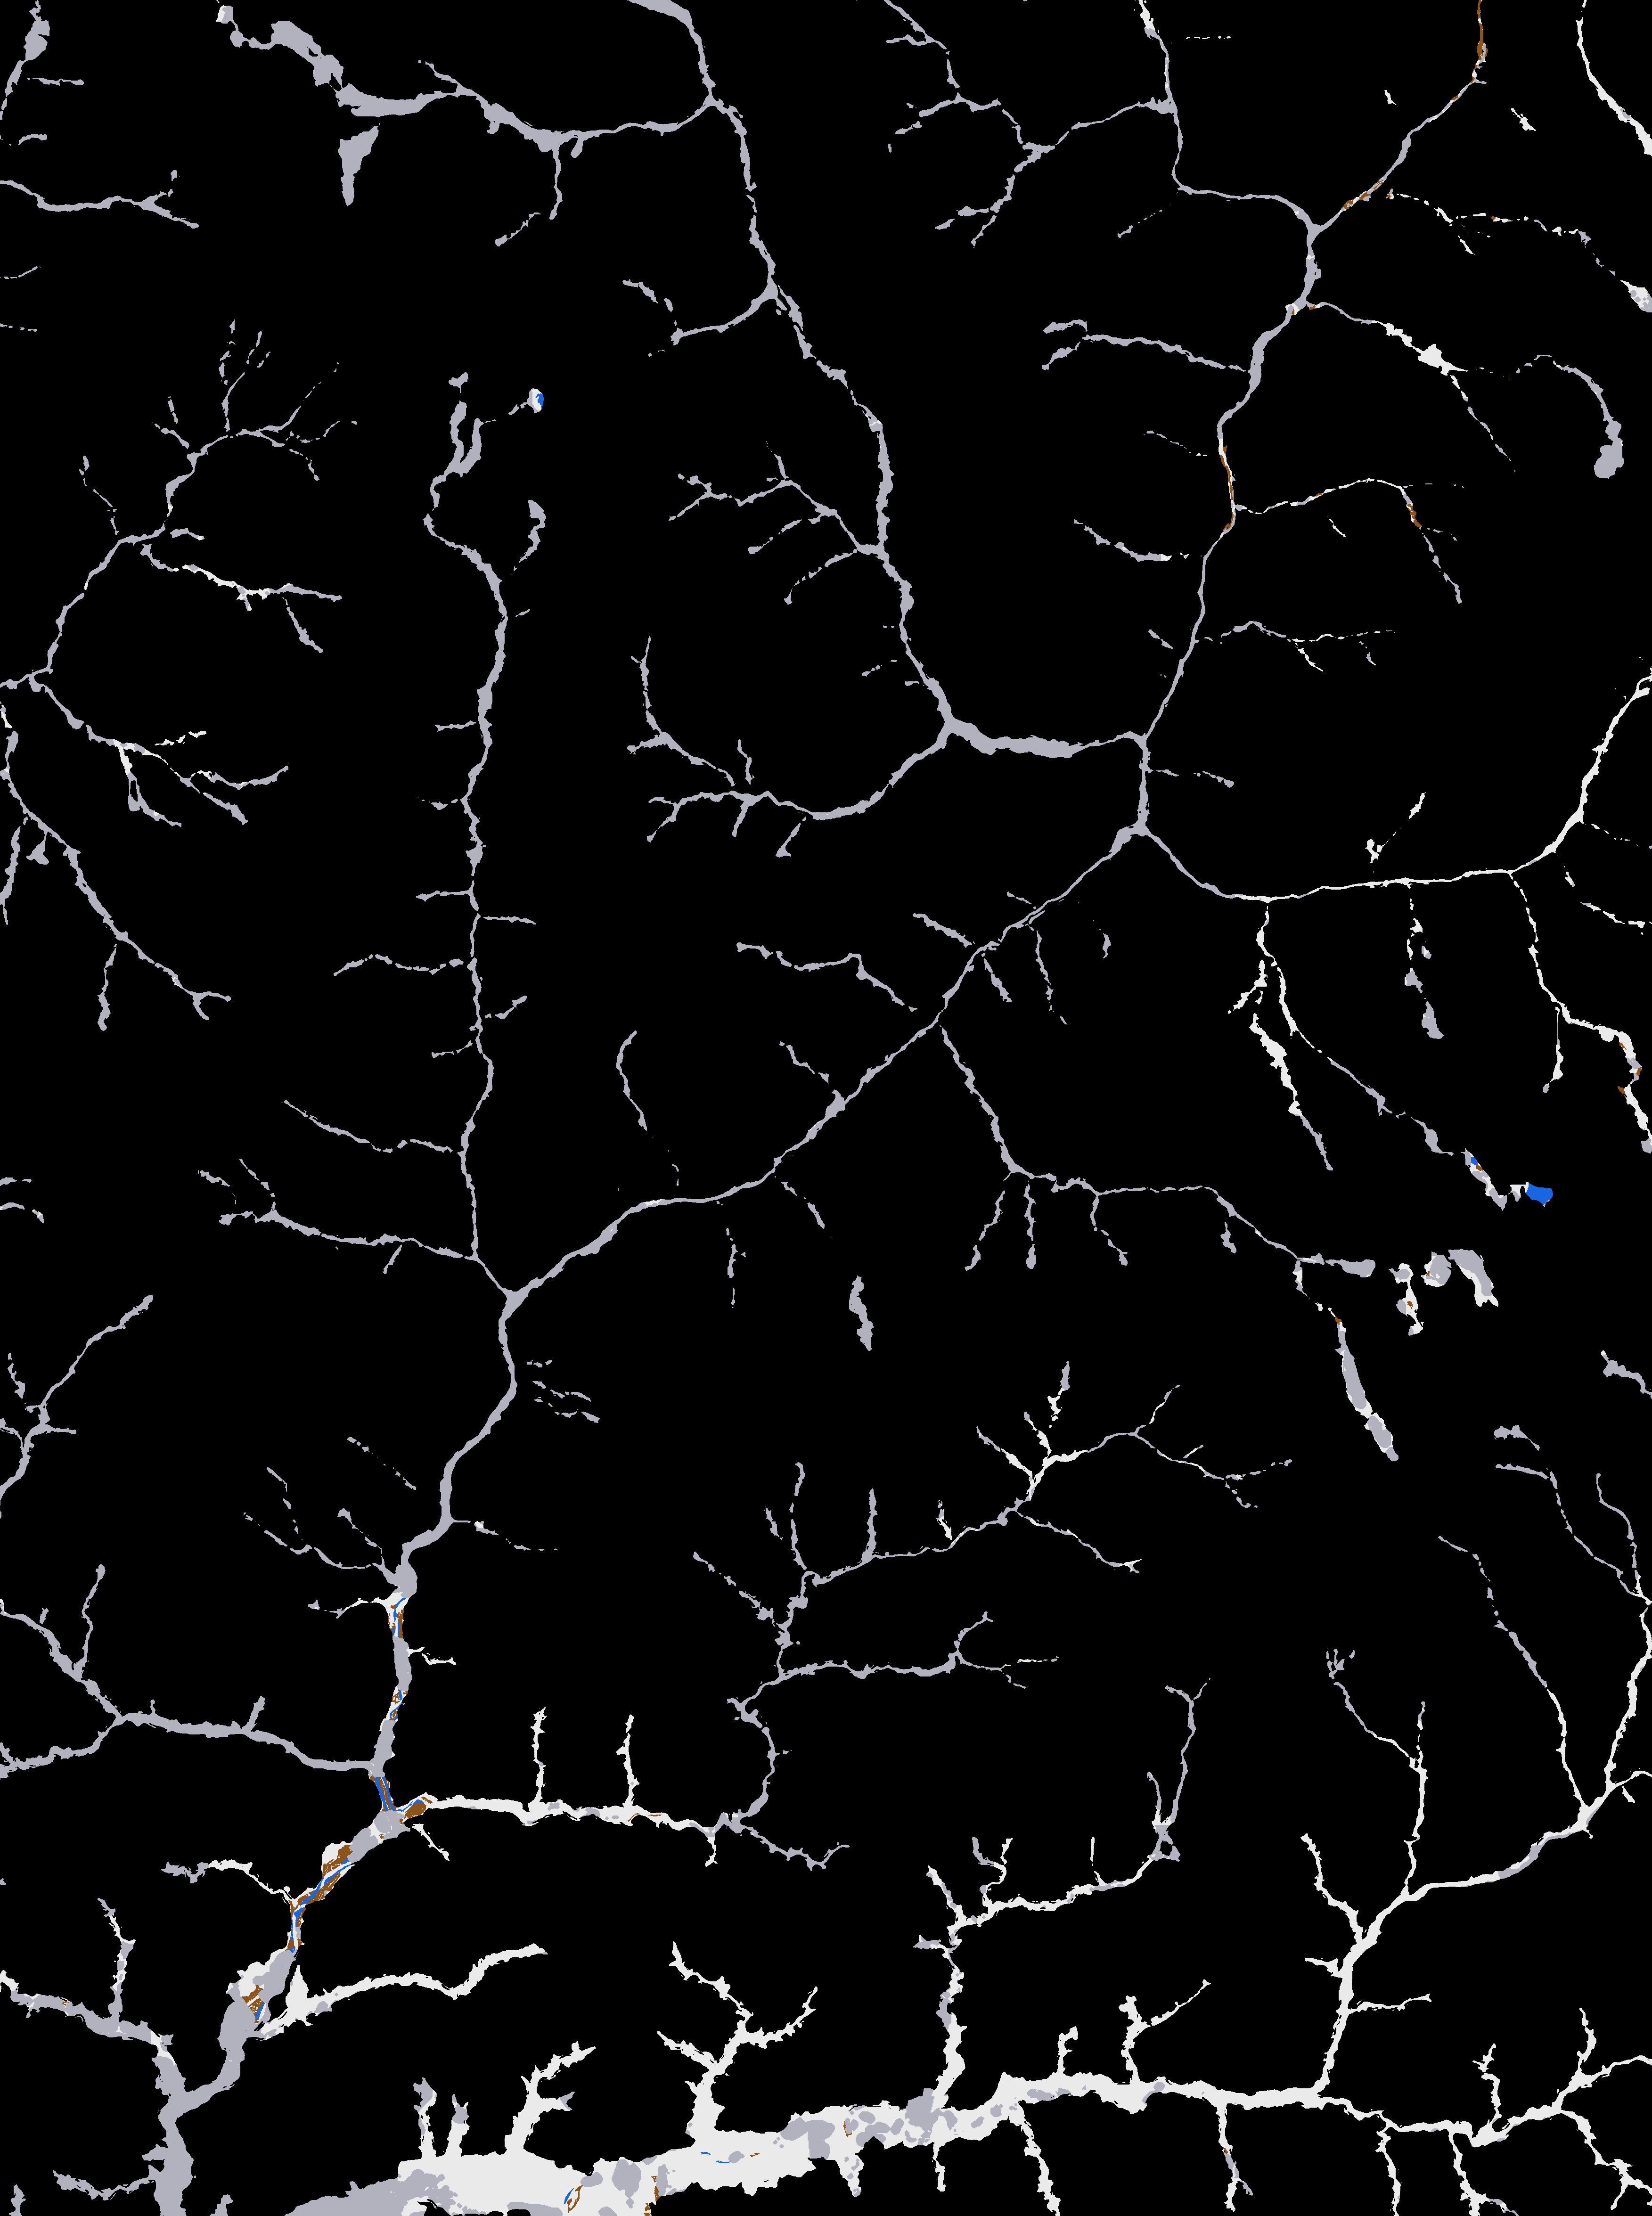
Raw radar processing. It downloads raw Sentinel-1 GRD images before and after the flood, from two orbits, and processes them with ESA SNAP: orbit correction, noise removal, calibration and terrain correction. Valley mask. From the Copernicus DEM, it keeps only ground less than 50 m above the river with a slope under 30°. Water can’t sit on cliffs, so this cuts out false alarms. AI flood model. A U-Net (ResNet-34) we trained on 19,071 Kuro Siwo chips finds new flood water. On 7 flood events it never saw, it scores F1 0.82, against 0.59 for a threshold baseline. We exported it to ONNX so it runs anywhere. Debris detection. Radar change detection uses a threshold that adapts to each scene. The two orbits only vote where they can actually see the ground. Sentinel-2 fusion. Where the sky is clear, optical images confirm the radar or add new detections. Damage. Pre-flood OpenStreetMap from the ohsome API shows which buildings, roads and bridges were hit. Bridges are graded likely or possibly damaged. Who is cut off. It builds a road graph and uses Dijkstra routing to send every village to the nearest health facility or town. Each one is marked cut off, long detour or reachable, with a footpath check and a repair priority list. Bonus, flood path. Click any point upstream and it traces where water flows downhill on the DEM, along with which villages are on that path. Dashboard. An offline Leaflet dashboard shows Map, Satellite and Terrain views, a critical-areas tour, a “confident only” switch and a one-page situation report.
Results for Trishuli
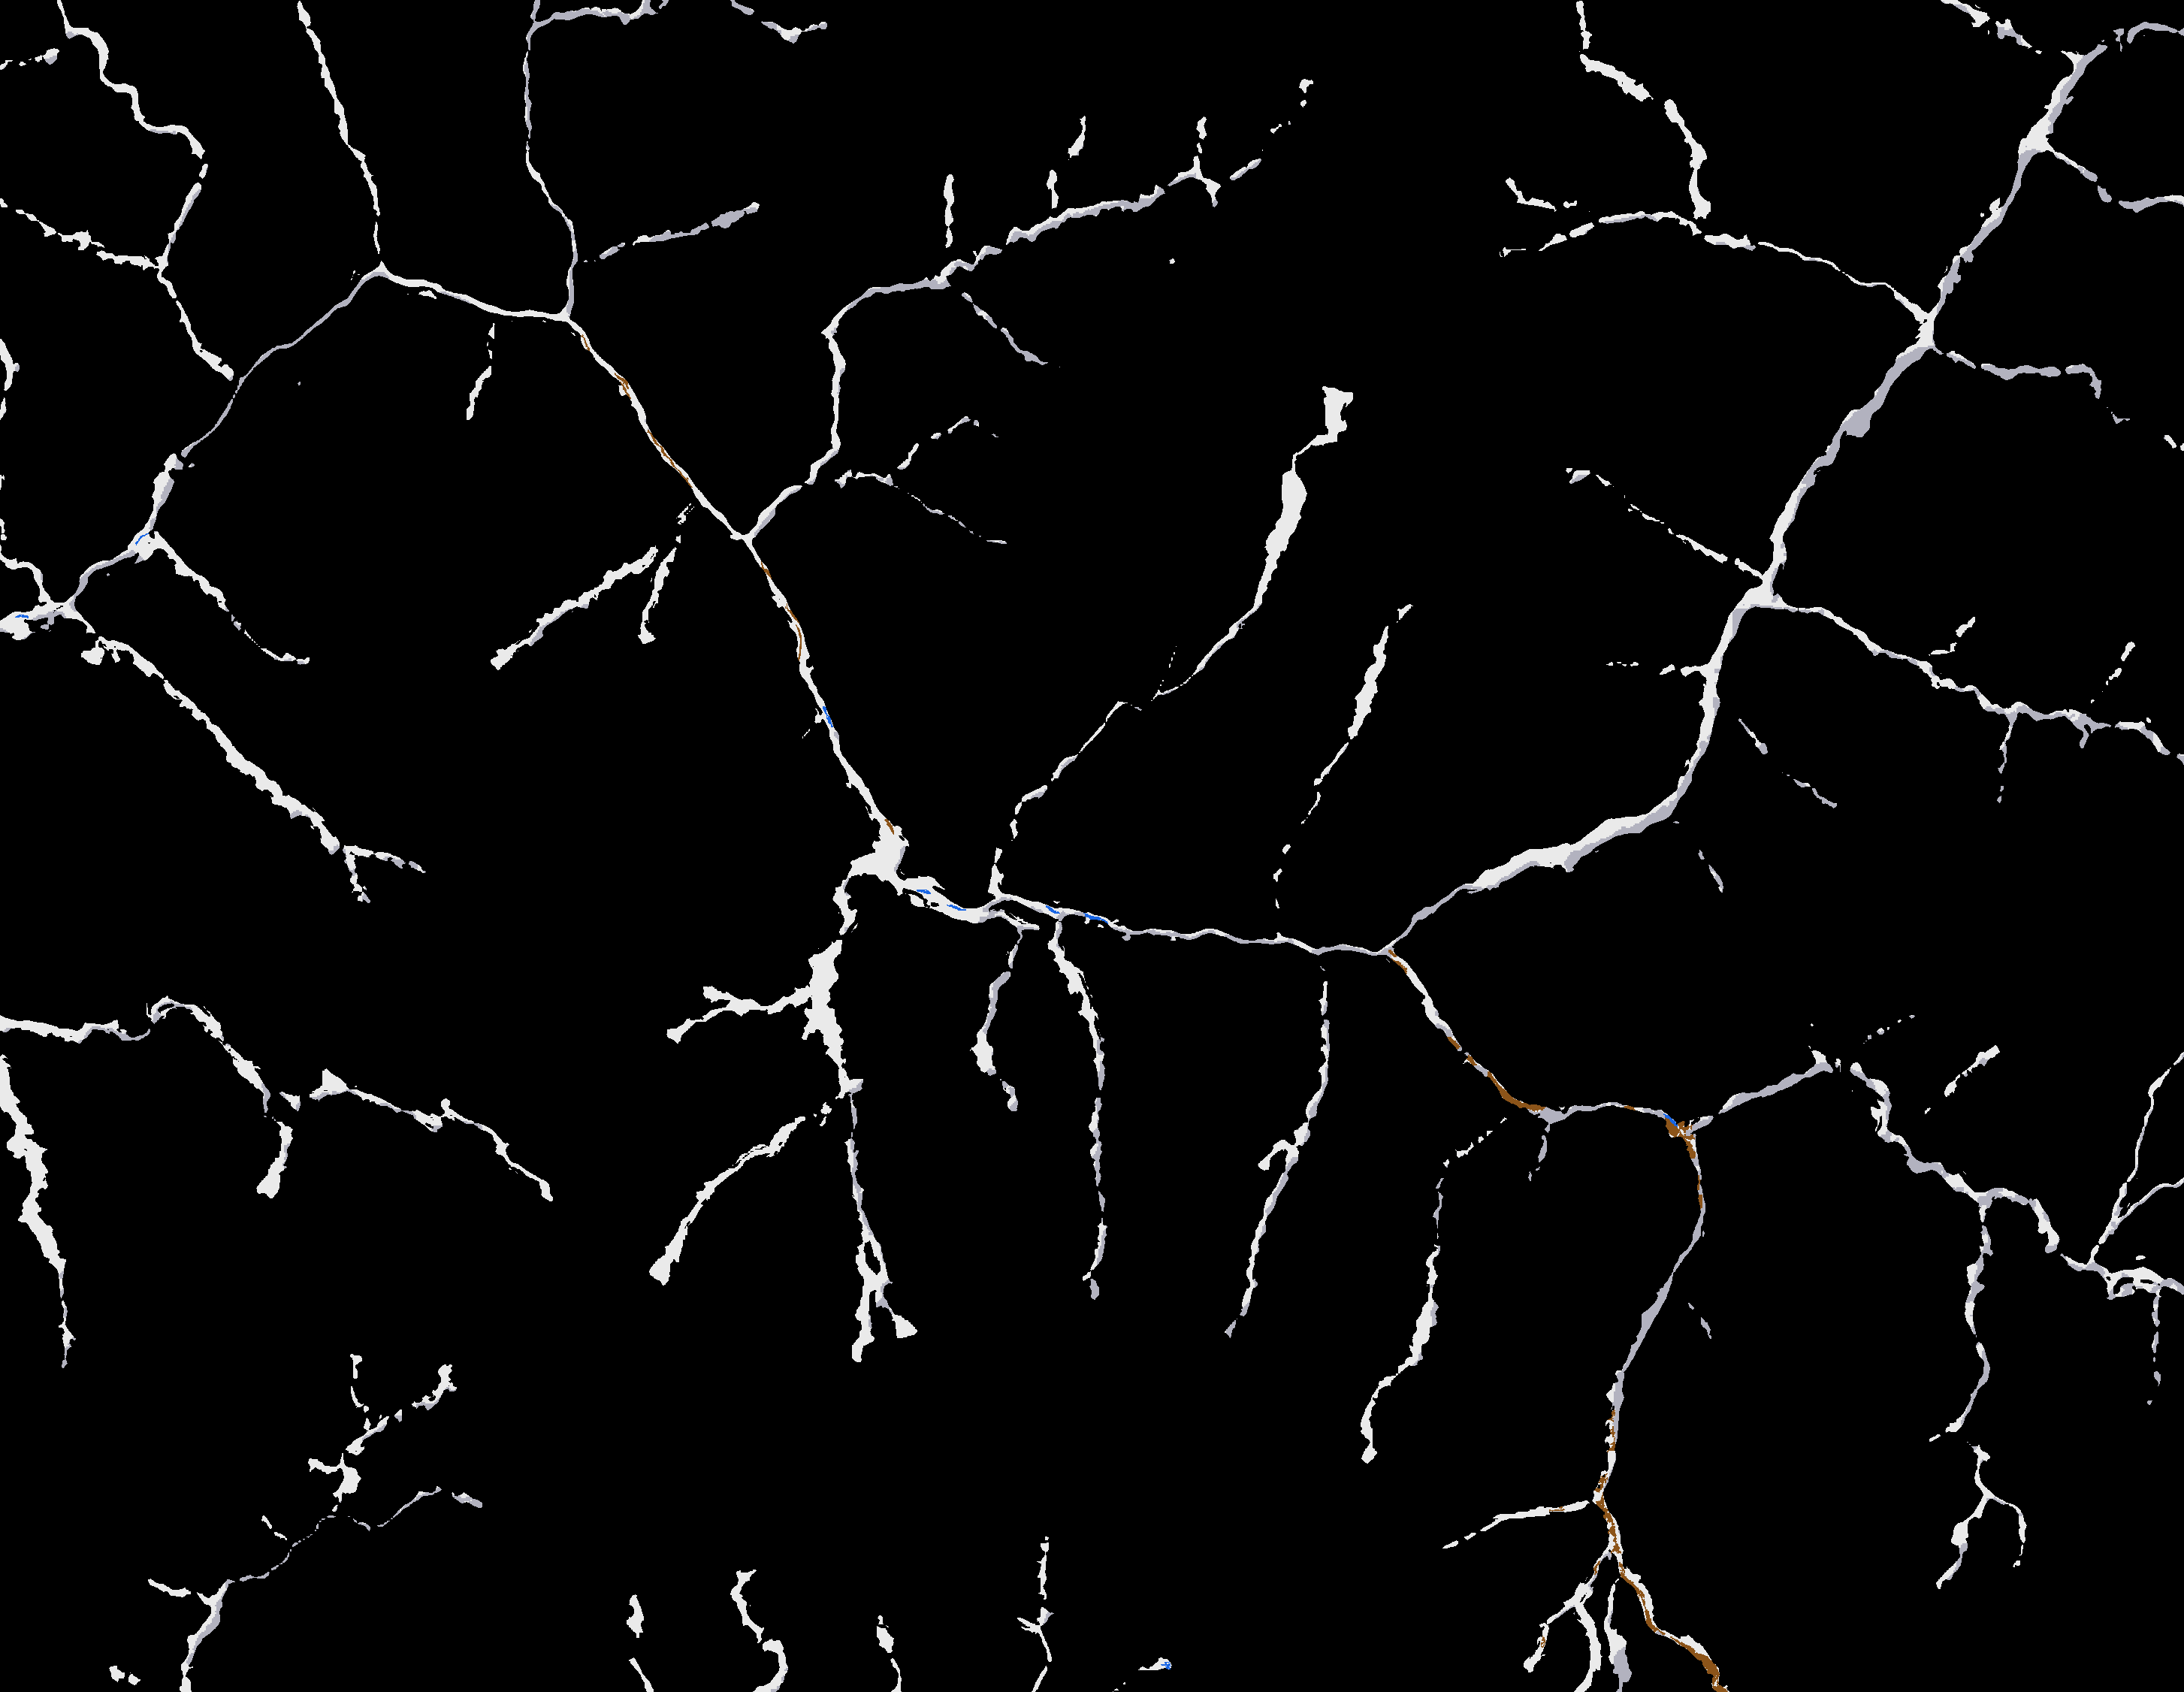
7.68 km² impacted 2,263 buildings and 43 km of road hit 27 bridges likely damaged 37 of 172 settlements cut off
Checked against Copernicus EMS EMSR927 (never used as an input):
Area precision 0.92 Buildings: precision 0.93, recall 0.81 Roads: precision 0.92, recall 0.70
We then ran the same notebook, unchanged, on the 2021 Chamoli disaster in India: a different country, year and type of flood.
Challenges we faced Monsoon clouds. Only 40% of the valley was clear in Sentinel-2. Radar had to be our backbone, with optical as a bonus. Steep gorges. Radar shadow and layover hide steep slopes. We had to work out which orbit sees each pixel, and we still miss debris in the narrowest gorges. Debris isn’t water. Our U-Net finds water well, but most of the damage was mud and rock. We combined it with change detection instead of forcing one tool to do everything. An API shut down mid-project. ohsome API v1 extraction started returning HTTP 403, so we switched to v2 with the same pre-flood snapshot date. Raw radar on free Colab. Processing full Sentinel-1 scenes meant working within memory, time and rate limits, so we added caching and retries everywhere. Staying honest. Flood maps can look impressive but mislead. We added confidence levels, grey hatching where there’s no clear image, and open reporting of our misses. What we learned How to process raw SAR data from scratch, and why terrain matters so much in the mountains. An AI model is one part of a working system. Masks, fusion and validation mattered just as much as the network. Checking against an independent reference changes your design. For example, the JRC water mask lowered our scores, so we left it out. Rescuers don’t need prettier maps. They need ranked, actionable lists: who is cut off, and what to fix first. Teamwork under pressure: splitting the pipeline, the model, the dashboard and the report between two people, and merging it all through Git.
What’s next Better coverage in gorges using more orbits and slope-aware debris detection. Testing on more Himalayan events and on Sen1Floods11. A one-click cloud run, so a district officer can use it without opening a notebook.
Built With
- copernicus-dem
- esa-snap
- geopandas
- google-colab
- javascript
- leaflet.js
- networkx
- ohsome
- onnx
- openstreetmap
- python
- pytorch
- rasterio
- sentinel-1
- sentinel-2


Log in or sign up for Devpost to join the conversation.