-
-
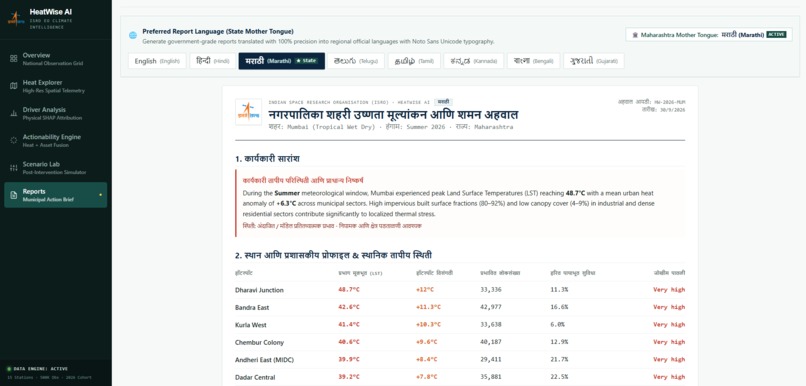
Reports
-
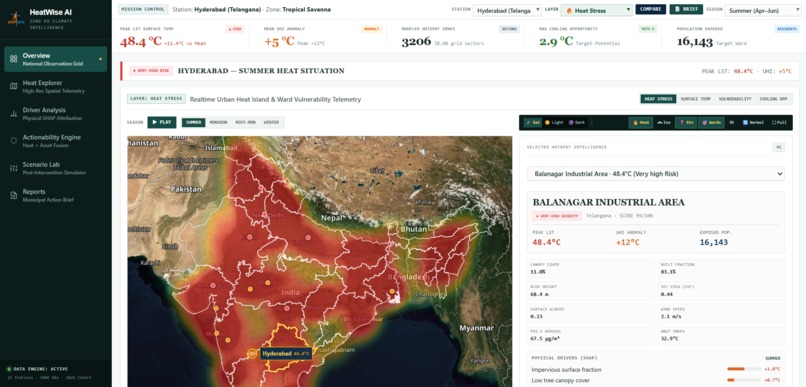
Monitoring
-
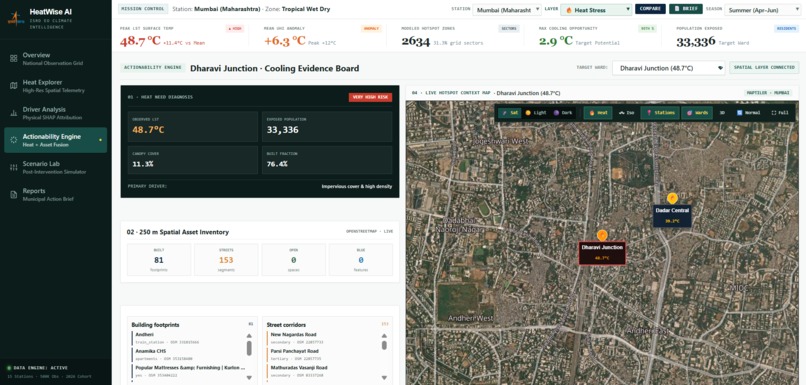
Comparsion and solution
HeatWise AI
Physics-guided geospatial intelligence for urban heat mitigation
HeatWise AI transforms urban heat observations into explainable, location-specific and monitorable cooling actions.
Inspiration
Urban heat is not distributed equally.
Two neighbourhoods in the same city can experience significantly different temperatures because of vegetation, impervious surfaces, building density, surface albedo, wind, humidity, pollution and population concentration.
Most thermal dashboards can show where high temperatures occur. However, municipal authorities must also answer:
- Why is this location overheating?
- Which people and infrastructure are exposed?
- Which cooling strategy is appropriate for this location?
- What improvement does the model predict?
- How can we verify whether an implemented intervention worked?
We built HeatWise AI to connect hotspot detection, driver analysis, cooling-strategy comparison, spatial feasibility, implementation monitoring and municipal reporting in one platform.
Where is the heat? Why is it happening? What can be implemented? How will the result be verified?
What It Does
HeatWise AI provides an end-to-end decision-support workflow for urban heat management.
| Stage | HeatWise AI capability | Decision supported |
|---|---|---|
| Observe | City, season and hotspot-level thermal views | Locate areas requiring attention |
| Predict | Land-surface temperature regression | Estimate local thermal intensity |
| Classify | Hotspot probability and risk classification | Prioritise high-risk locations |
| Diagnose | Explainable environmental driver analysis | Understand likely causes |
| Compare | Baseline, no-action and intervention scenarios | Evaluate cooling alternatives |
| Screen | Buildings, roads, parks and water assets | Assess spatial feasibility |
| Monitor | Before-and-after and matched-control records | Measure implementation outcomes |
| Report | Location-specific municipal action briefs | Communicate decisions and evidence |
Core Features
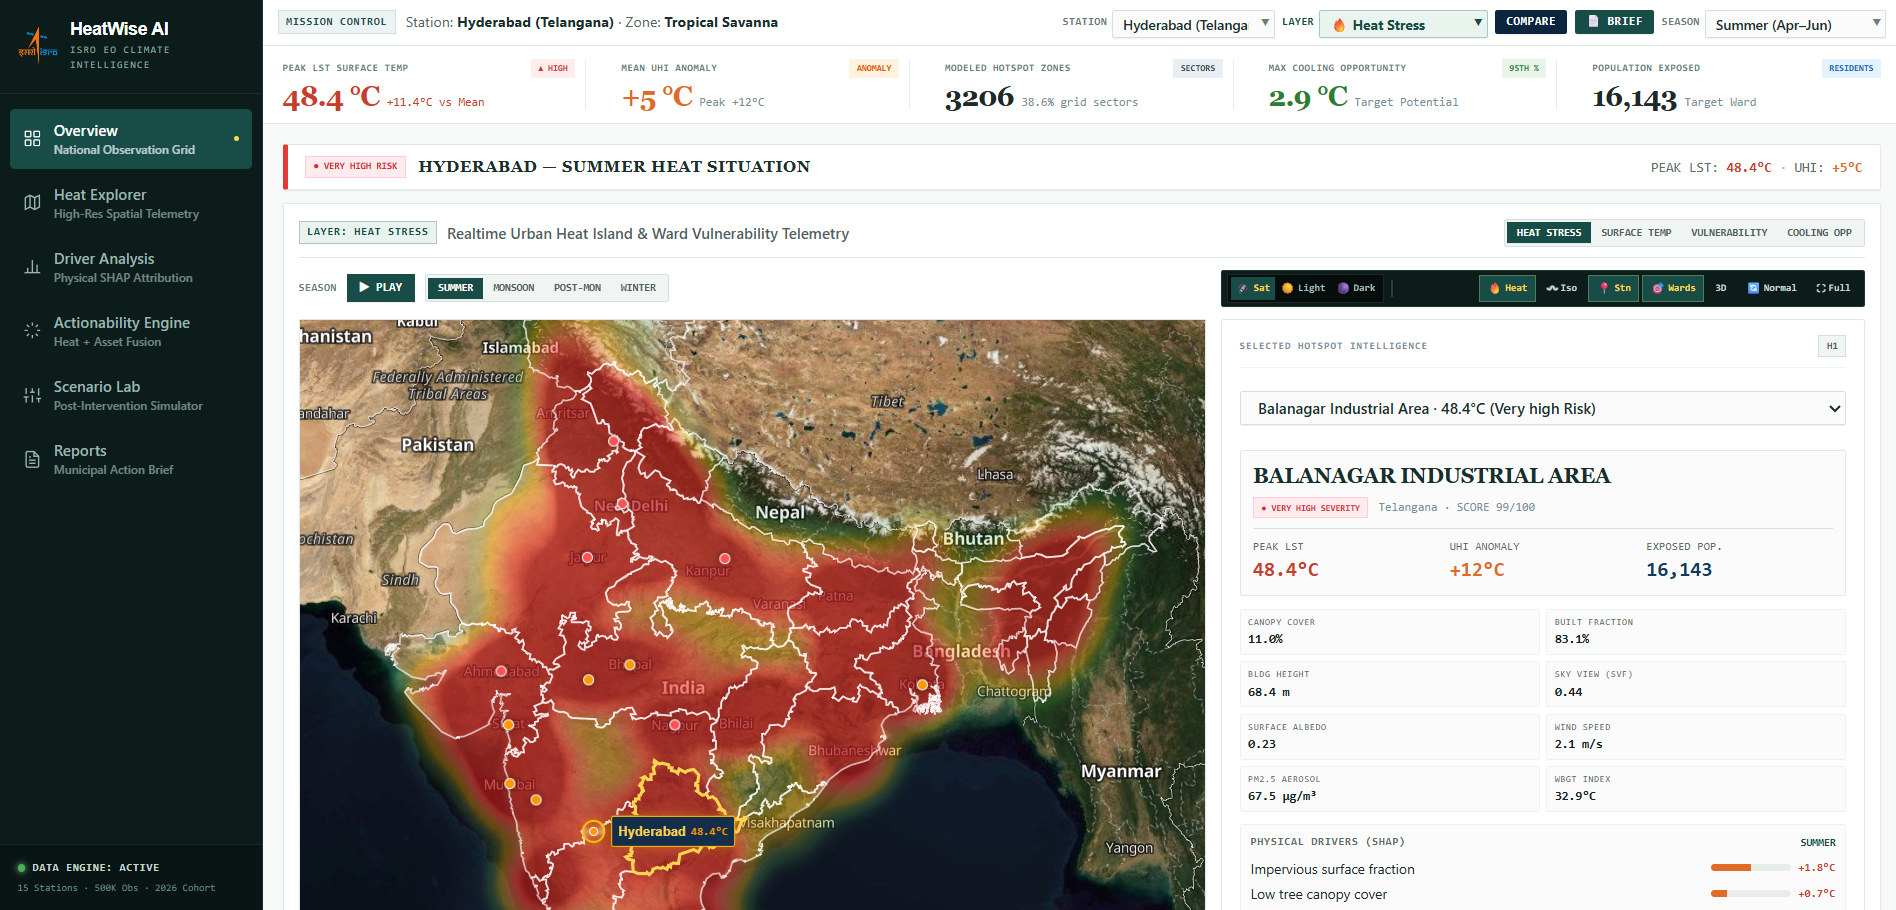
National Observation Grid
The main dashboard provides a national overview of supported Indian cities, including:
- City and model-area selection
- Seasonal exploration
- Peak land-surface temperature
- Mean Urban Heat Island anomaly
- Modelled hotspot sectors
- Population exposure
- Cooling opportunity indicators
- Interactive thermal mapping
Heat Explorer
The Heat Explorer allows users to select a city and hotspot, inspect local thermal intensity, view risk classification, compare seasonal conditions and explore surrounding spatial context.
Driver Analysis
The Driver Analysis module explains which features most influenced the model for the selected location.
Potential heat drivers include:
- Vegetation and canopy cover
- Impervious surface fraction
- Surface albedo
- Building density and urban form
- Wind and atmospheric conditions
- Seasonal variables
- Pollution and aerosol context
- Population exposure
Feature importance is presented as a model association, not automatic proof of causation.
Scenario Lab
The Scenario Lab allows users to combine and compare cooling strategies such as:
- Tree and green-cover expansion
- Cool-roof coatings
- Shade and green infrastructure
- Permeable or reflective pavement
The system compares:
- Baseline modelled temperature
- Target-date no-action temperature
- Intervention scenario temperature
- Cooling relative to no action
- Hotspot-risk transition
- Physical feature assumptions
Scenario results are modelled counterfactuals, not measured post-implementation outcomes.
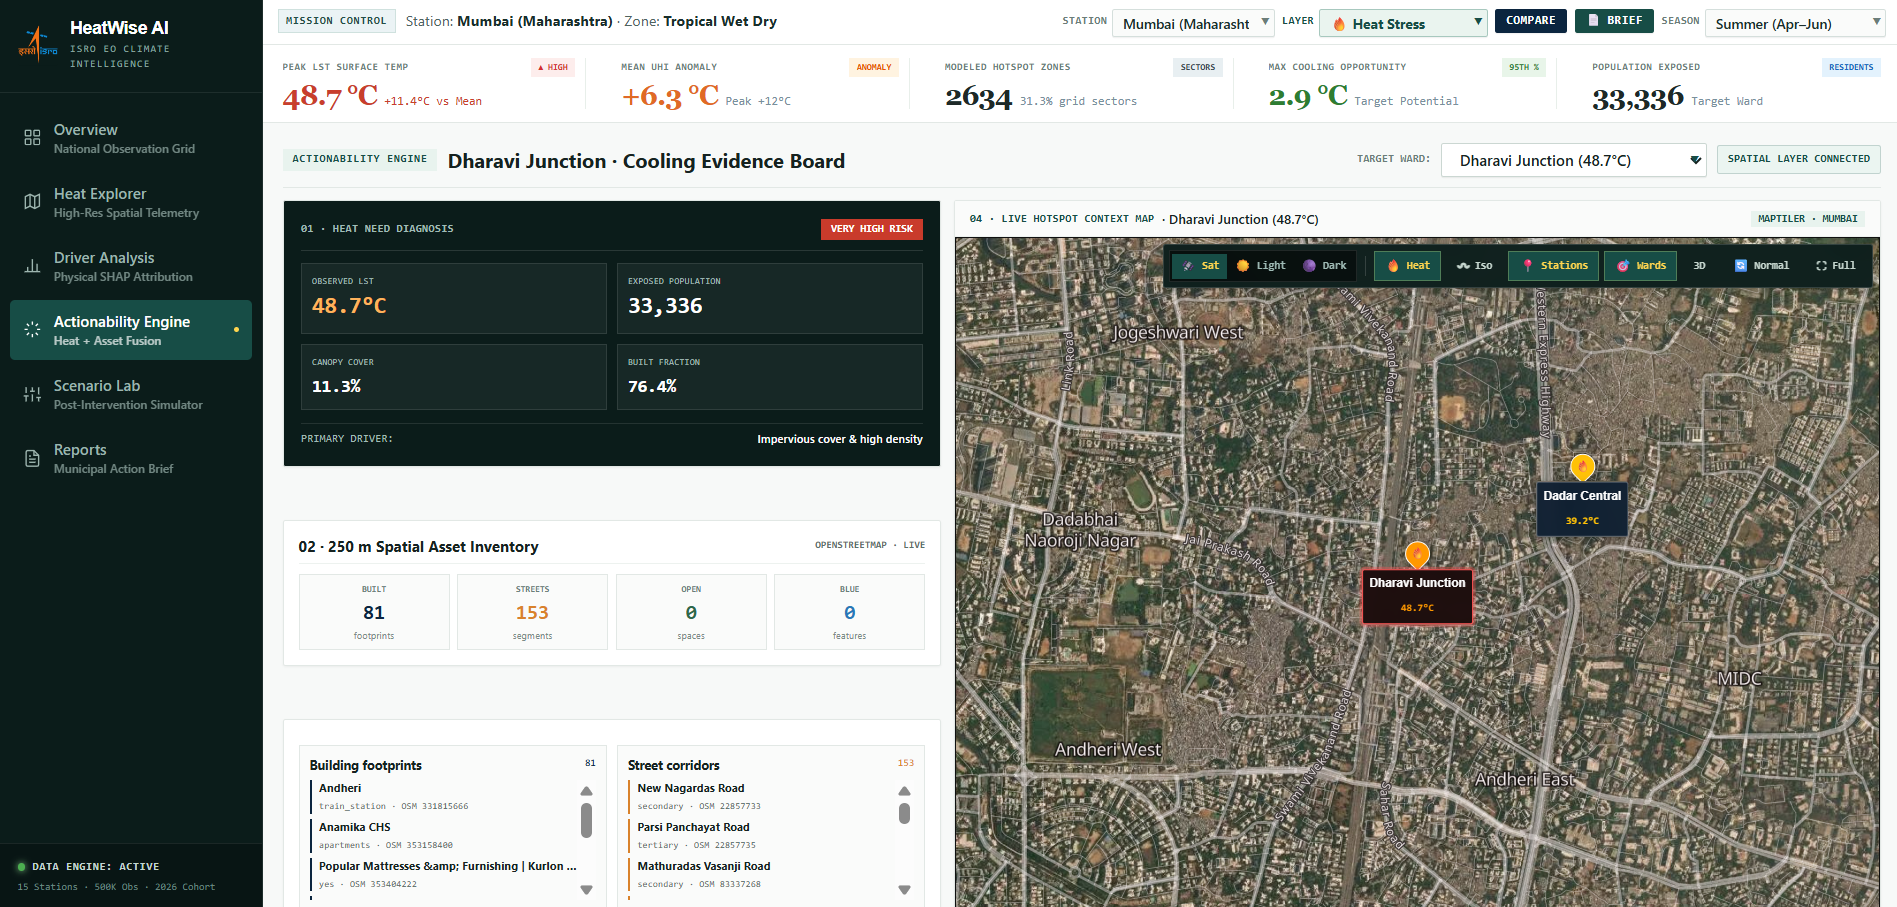
Actionability Engine
The Actionability Engine connects hotspot intelligence with nearby OpenStreetMap assets, including:
- Building footprints
- Named street corridors
- Parks and open spaces
- Waterways and water bodies
- Other available mapped infrastructure
This provides local context before authorities conduct engineering and field feasibility surveys.
Implementation Monitoring
Municipal users can record:
- Treated-location temperature before implementation
- Treated-location temperature after implementation
- Matched-control temperature before implementation
- Matched-control temperature after implementation
- Intervention type and coverage
- Observation date and project status
The adjusted change can be estimated using a difference-in-differences comparison:
$$
\Delta_{\text{adjusted}}
(T_{\text{treated,after}}-T_{\text{treated,before}})
(T_{\text{control,after}}-T_{\text{control,before}}) $$
This controls for broader temperature changes affecting both locations. It is more defensible than a simple before-and-after comparison, although it does not prove causality by itself.
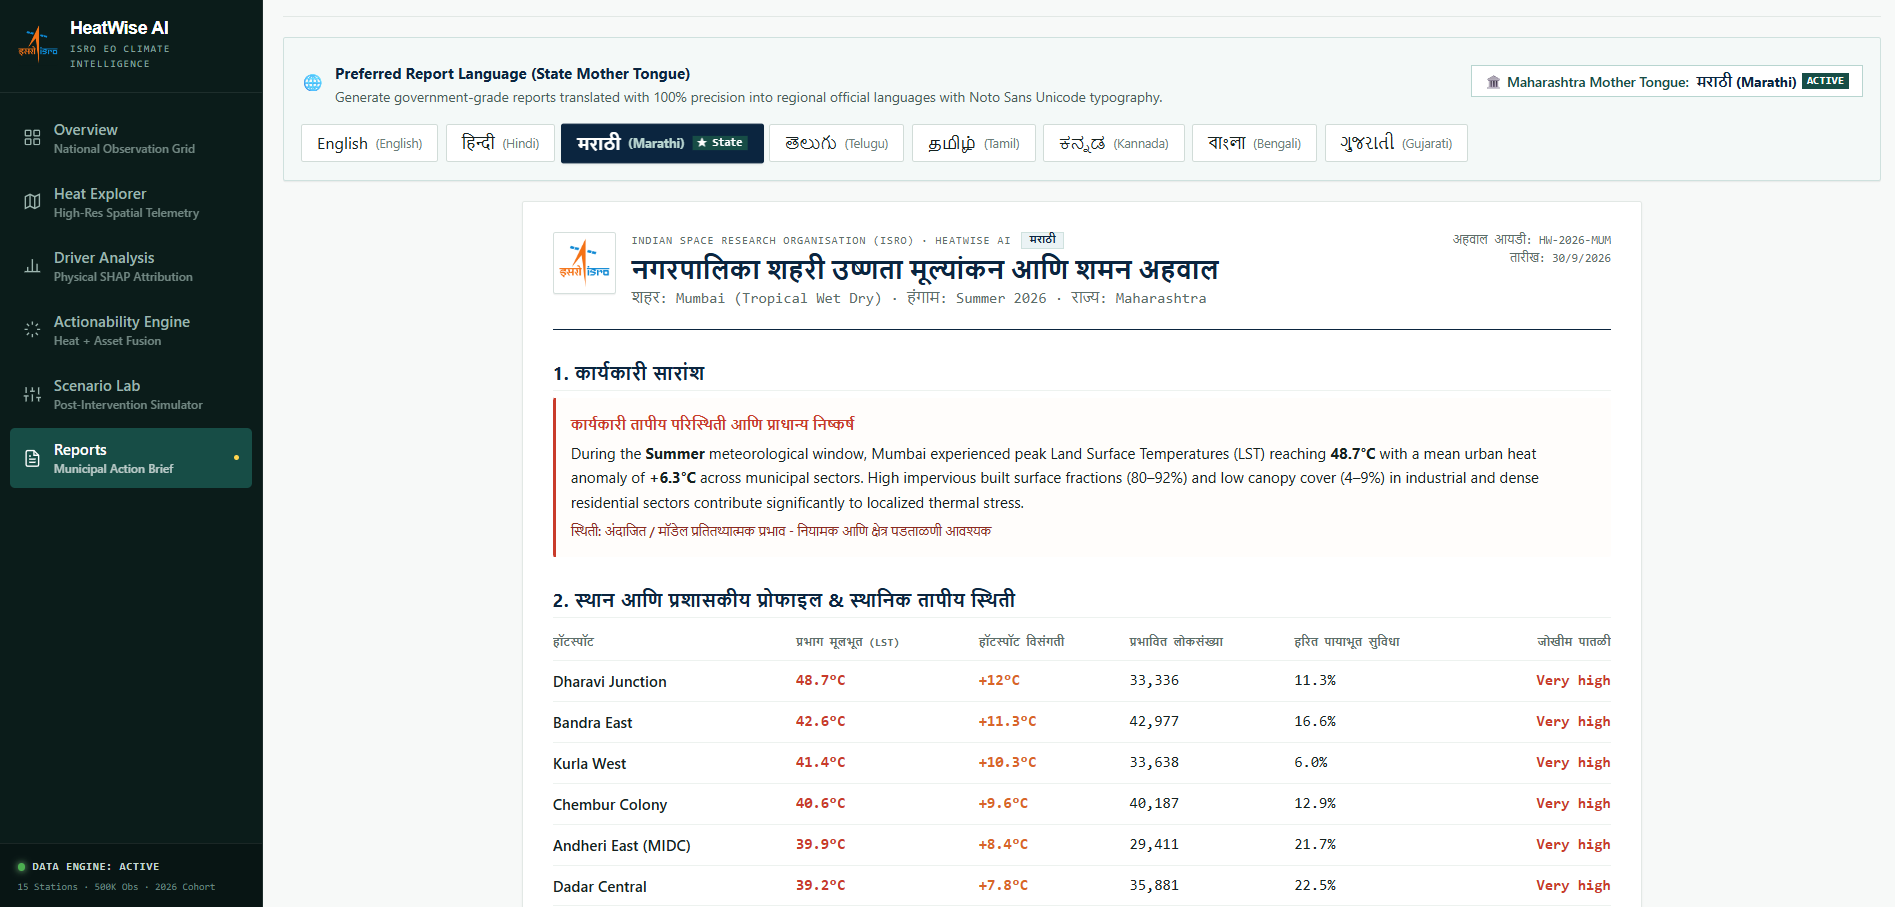
Municipal Reports
The platform creates a location-specific action brief containing:
- Temperature and hotspot-risk summary
- Population exposure
- Key heat drivers
- Environmental parameters
- Proposed cooling portfolio
- Spatial asset context
- Monitoring requirements
- Model assumptions and limitations
Contextual AI Copilot
The AI assistant receives the currently selected city, hotspot, season and model context.
It is designed to:
- Answer only the requested question
- Provide concise, location-aware responses
- Explain model outputs in understandable language
- Avoid inventing unavailable observations
- Separate predictions from verified facts
- Format technical content clearly
How We Built It
HeatWise AI combines geospatial data, machine learning, physics-guided reasoning and an interactive web application.
Model 1: XGBoost LST Regressor
The regression model estimates land-surface temperature using environmental, spatial and seasonal inputs.
Example inputs include:
- Vegetation indices
- Canopy-cover fraction
- Impervious-surface fraction
- Surface albedo
- Land-use and land-cover information
- Building and urban-form indicators
- Air temperature
- Relative humidity
- Wind speed
- Pollution or aerosol context
- Seasonal encodings
- Location-specific features
The output is a predicted land-surface temperature in degrees Celsius.
XGBoost was selected because it performs strongly on structured tabular data, captures nonlinear relationships, models interactions between environmental variables and provides efficient inference.
Model 2: XGBoost Hotspot Classifier
The classification model uses environmental features and modelled temperature to produce:
- Hotspot probability
- Binary hotspot decision
- Operational risk category
The decision threshold is selected according to the required trade-off between precision and recall instead of automatically using a threshold of 0.5.
Model Performance
Temperature regression
| Metric | Result |
|---|---|
| Mean Absolute Error | 0.98°C |
| Root Mean Squared Error | 1.23°C |
| Coefficient of Determination | 0.977 |
Hotspot classification
| Metric | Result |
|---|---|
| Accuracy | 93.07% |
| Precision | 79.95% |
| Recall | 41.06% |
| F1 score | 54.25% |
| ROC-AUC | 95.16% |
| PR-AUC | 73.07% |
| Decision threshold | 95.25% |
The high decision threshold prioritises precision and reduces false hotspot alerts. This produces a recall trade-off that must be considered when using the model for screening.
These metrics apply to the held-out evaluation distribution and do not guarantee identical performance across every city, season or sensor.
Physics-Guided Reasoning
The model design follows the urban surface-energy balance:
$$ R_n = H + LE + G $$
Where:
- $R_n$ is net radiation
- $H$ is sensible heat transferred to the atmosphere
- $LE$ is latent heat associated with evapotranspiration
- $G$ is ground and surface heat storage
This provides the physical interpretation behind the model features:
- Vegetation can increase latent cooling through evapotranspiration.
- Reflective surfaces can reduce absorbed solar radiation.
- Concrete and asphalt can increase heat storage.
- Wind and urban geometry can affect ventilation.
- Moisture availability affects the balance between sensible and latent heat.
Physics guides feature selection, scenario constraints and interpretation. It does not replace real physical measurements or independent validation.
Experimental PINN Cross-Check
We also developed an experimental Physics-Informed Neural Network as a secondary temperature cross-check.
The PINN includes a physics loss that penalises predictions inconsistent with a partial surface-energy balance.
The PINN is not used as the operational hotspot classifier. XGBoost remains the primary model because it performs better on the available structured dataset and supports efficient, explainable inference.
Data Strategy
| Data category | Candidate sources | Purpose |
|---|---|---|
| Thermal observations | Landsat 8/9, ECOSTRESS and MODIS | LST targets and temporal validation |
| Vegetation and land cover | Sentinel-2 and Landsat | NDVI, canopy and surface-cover features |
| Meteorological conditions | ERA5 and local stations | Air temperature, humidity and wind |
| Air quality | CPCB observations | Pollution and aerosol context |
| Urban morphology | OpenStreetMap and GHSL | Buildings, roads and built-up structure |
| Population | Census or validated gridded datasets | Exposure and prioritisation |
For operational use, observations must be aligned by geographic location, acquisition time, coordinate system, spatial resolution, quality flags, sensor characteristics and seasonal context.
Technology Stack
| Layer | Technologies |
|---|---|
| Frontend | Next.js, React and TypeScript |
| Styling | Tailwind CSS |
| Mapping | MapTiler, MapLibre and OpenStreetMap |
| Machine learning | XGBoost regression and classification |
| Physics cross-check | Experimental PINN |
| Explainability | Feature importance and driver analysis |
| AI assistant | Groq-powered contextual assistant |
| Automation | n8n webhook integration |
| Reporting | Browser-generated municipal reports and PDFs |
| Deployment | Vercel |
Challenges We Faced
Turning Predictions into Decisions
Our initial implementation focused heavily on temperature and risk predictions. We realised that a temperature value alone does not tell a municipality what action to take.
We redesigned the platform around the complete workflow of detection, diagnosis, comparison, implementation and monitoring.
Separating Simulation from Evidence
A predicted temperature reduction is not the same as an observed real-world improvement.
We explicitly separated:
- Available observations
- Model predictions
- Counterfactual simulations
- Post-implementation measurements
This prevents simulated values from being presented as verified outcomes.
Handling Incomplete Data
Not every environmental measurement is available for every location.
Instead of silently presenting missing values as ground truth, the system distinguishes available observations from model-filled features and communicates these limitations to the user.
Making AI Understandable
Raw feature names and model outputs are difficult for non-technical users.
We translated model features into understandable urban-heat drivers while retaining access to the underlying technical parameters.
Evaluating Real Interventions
A simple before-and-after comparison can be misleading because both dates may have different weather conditions.
We added matched-control monitoring to help separate intervention-related change from city-wide temperature variation.
Building a Deployable System
We integrated model inference, interactive mapping, intervention comparison, reporting and the AI assistant into a browser-accessible application that can be deployed on Vercel.
What We Learned
Building HeatWise AI taught us that an effective AI product requires more than a high-performing model.
A reliable AI product also needs:
- Transparent assumptions
- Understandable explanations
- Confidence-aware decisions
- Safe fallbacks
- Location-specific context
- Post-implementation monitoring
- Clear separation between observed, predicted and simulated data
Most importantly, we learned that responsible AI sometimes means saying, “This requires local verification,” instead of presenting an uncertain prediction as fact.
What Makes HeatWise AI Different
- Goes beyond heat-map visualisation
- Combines temperature regression with hotspot classification
- Explains why a location is predicted to be hot
- Connects model outputs with surface-energy physics
- Supports multi-strategy cooling portfolios
- Compares interventions against a no-action baseline
- Uses local spatial assets for feasibility context
- Separates simulated impact from measured impact
- Supports matched-control monitoring
- Generates location-specific municipal reports
- Includes a contextual AI assistant
- Runs as a deployable web application
Current Limitations
HeatWise AI is a decision-support prototype.
Operational municipal deployment would require:
- Aligned and quality-controlled satellite scenes
- Verified meteorological and ground observations
- Local municipal GIS data
- Engineering and field feasibility surveys
- Independent validation across cities and seasons
- Prediction uncertainty estimates
- Security and access-control review
- Approval from relevant authorities
Model predictions should not be interpreted as guaranteed real-world outcomes.
What’s Next
Our future roadmap includes:
- Reproducible ingestion of satellite and ERA5 data
- Automated cloud masking and temporal alignment
- Validation across additional cities and seasons
- Prediction uncertainty intervals
- Authenticated municipal project portfolios
- Intervention implementation tracking
- Satellite-based post-implementation verification
- Causal modelling after sufficient audited observations
- Model cards and data-lineage documentation
- Municipal GIS integration
- Continuous model-drift monitoring
Try It
- Live application: https://vecnabytes.vercel.app/
- Source code: https://github.com/shreejaykurhade/HeatWise_AI
Built With
- drizzle-orm
- era5
- explainable-ai
- geospatial-ai
- groq
- landsat
- machine-learning
- maplibre
- maptiler
- n8n
- next.js
- openstreetmap
- physics-informed-ml
- postgresql
- python
- pytorch
- react
- remote-sensing
- scikit-learn
- sentinel-2
- tailwind-css
- typescript
- vercel
- xgboost


Log in or sign up for Devpost to join the conversation.