Inspiration
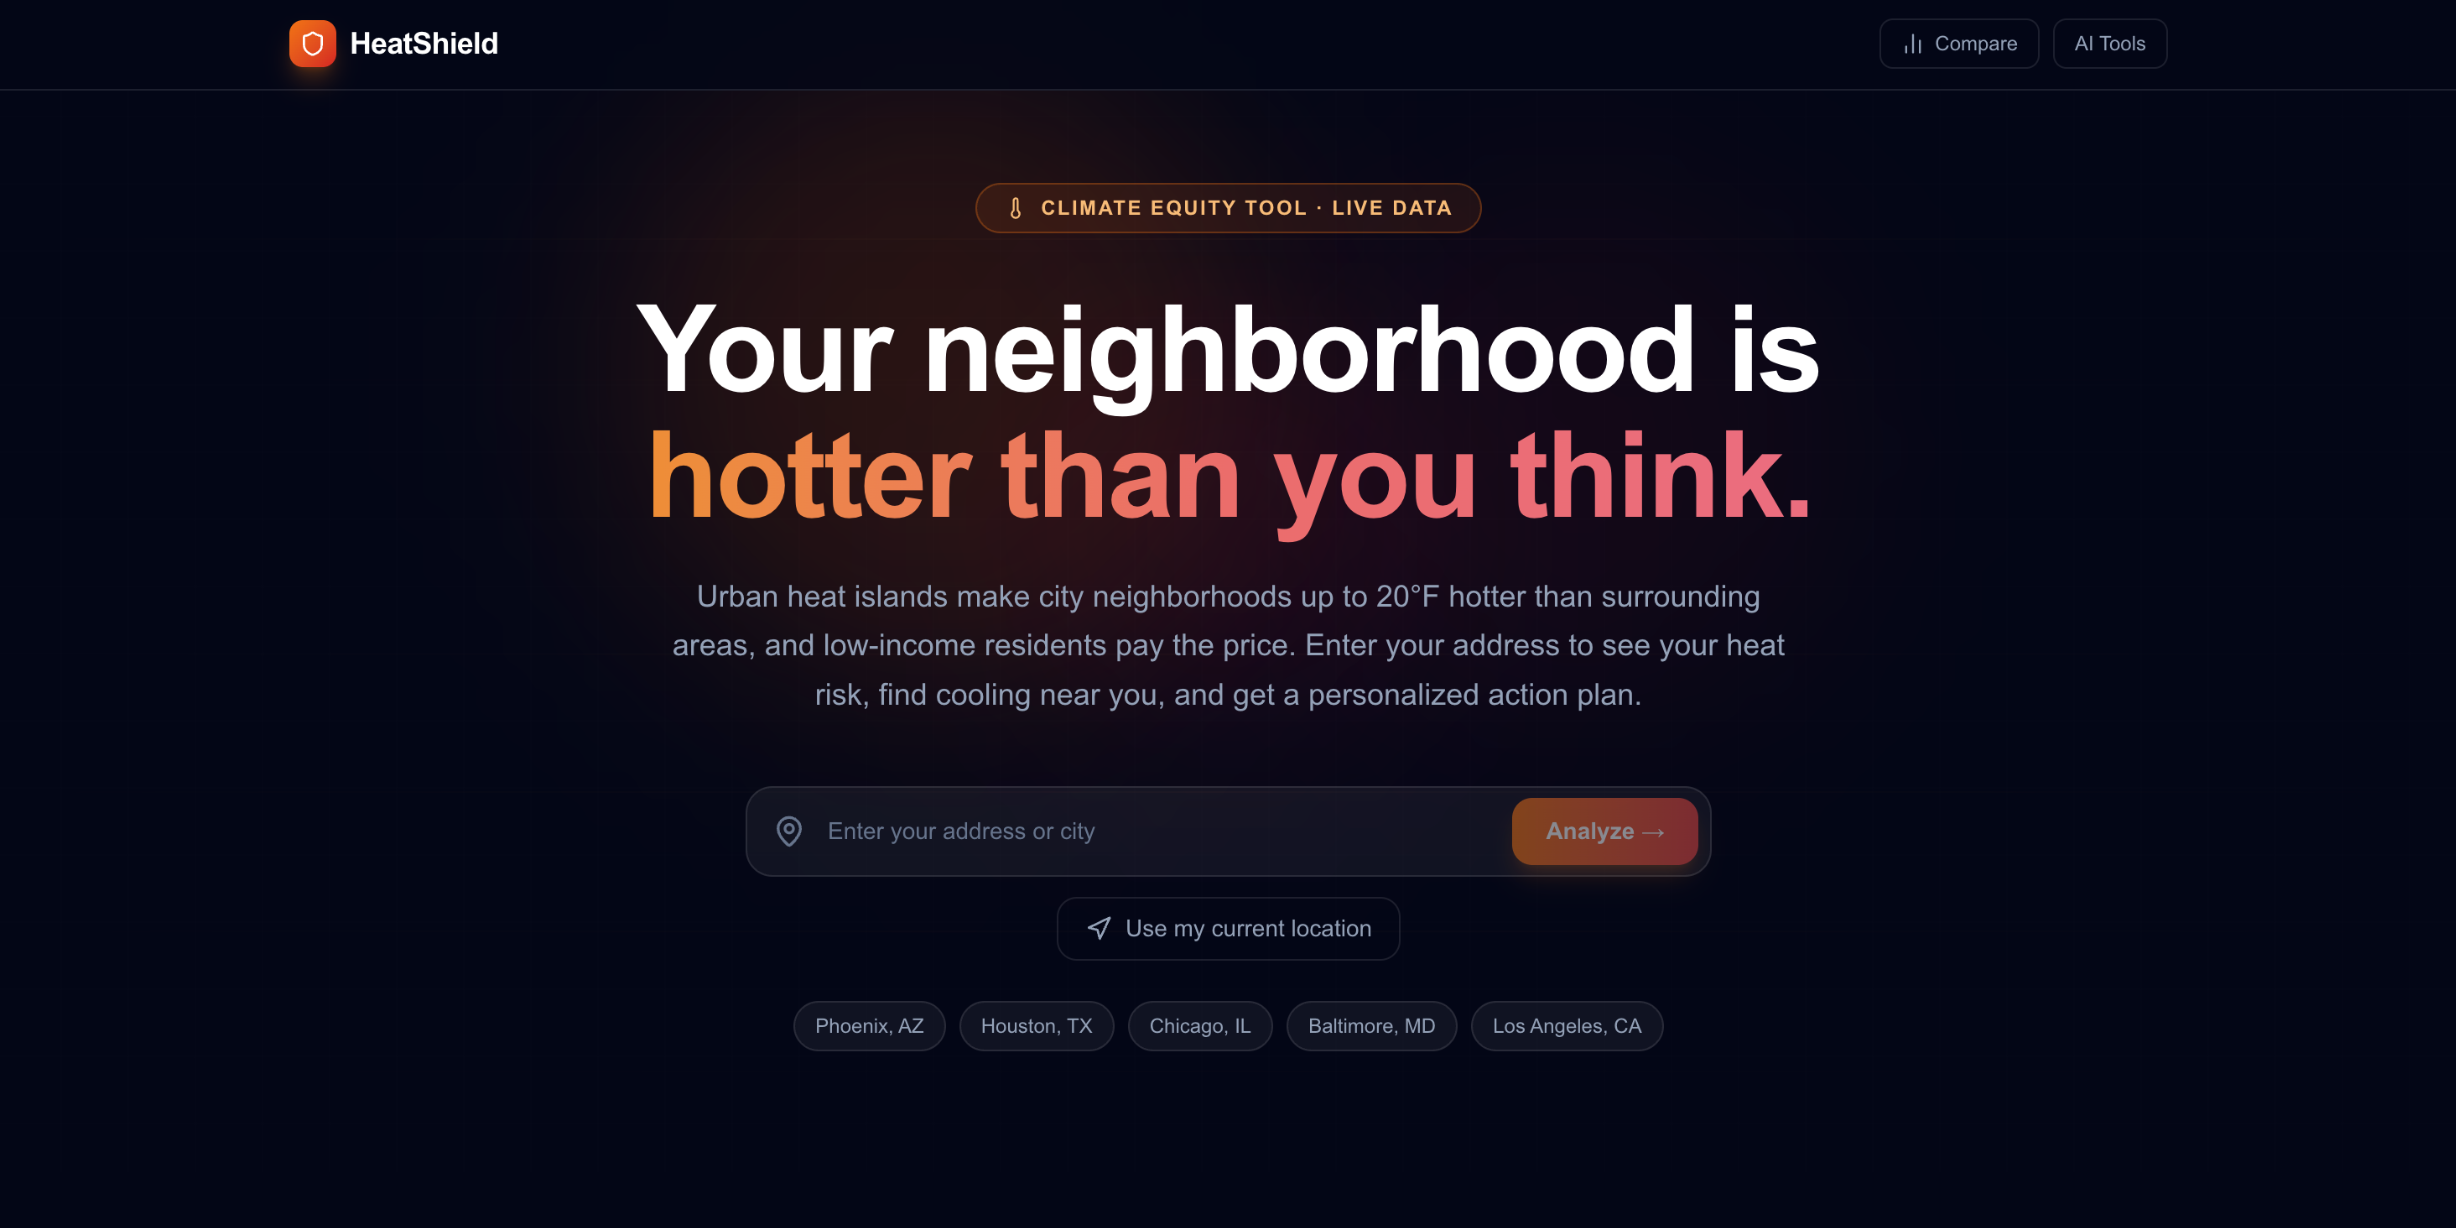
Urban heat islands make low-income neighborhoods up to 20 degrees Fahrenheit hotter than surrounding rural areas, a direct result of historical disinvestment and systemic inequality, and thousands die from heat-related illness every year with almost no tools built to help them. Residents have no way to know their specific heat risk or what concrete steps they can actually take, whether they rent or own, have money or don't. I built HeatShield to fix that.
What it does
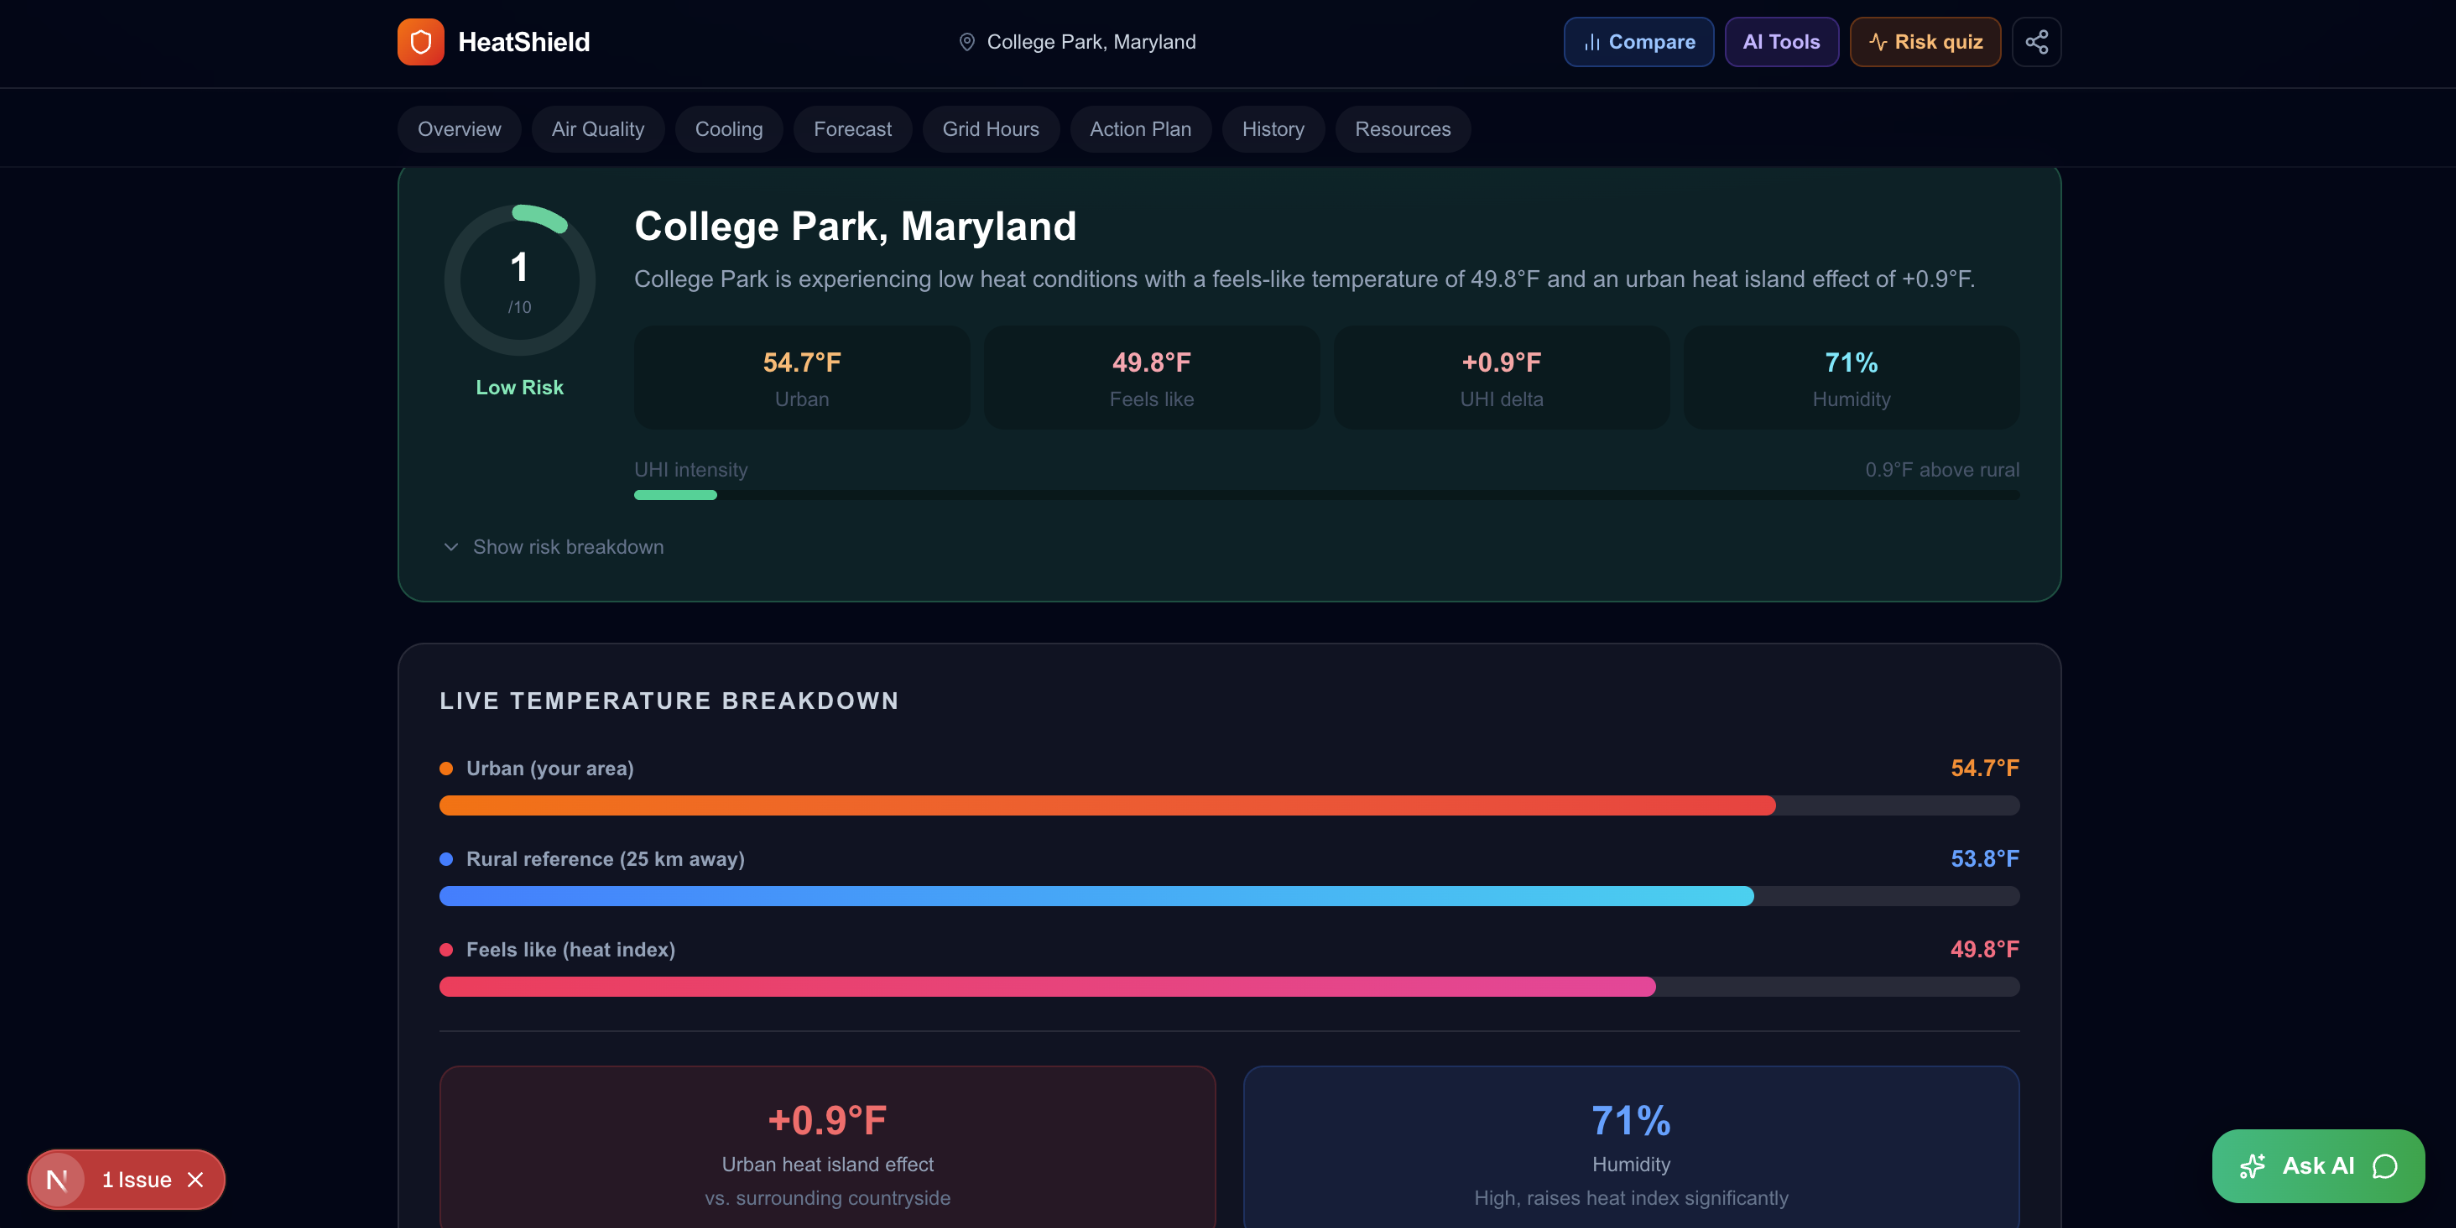
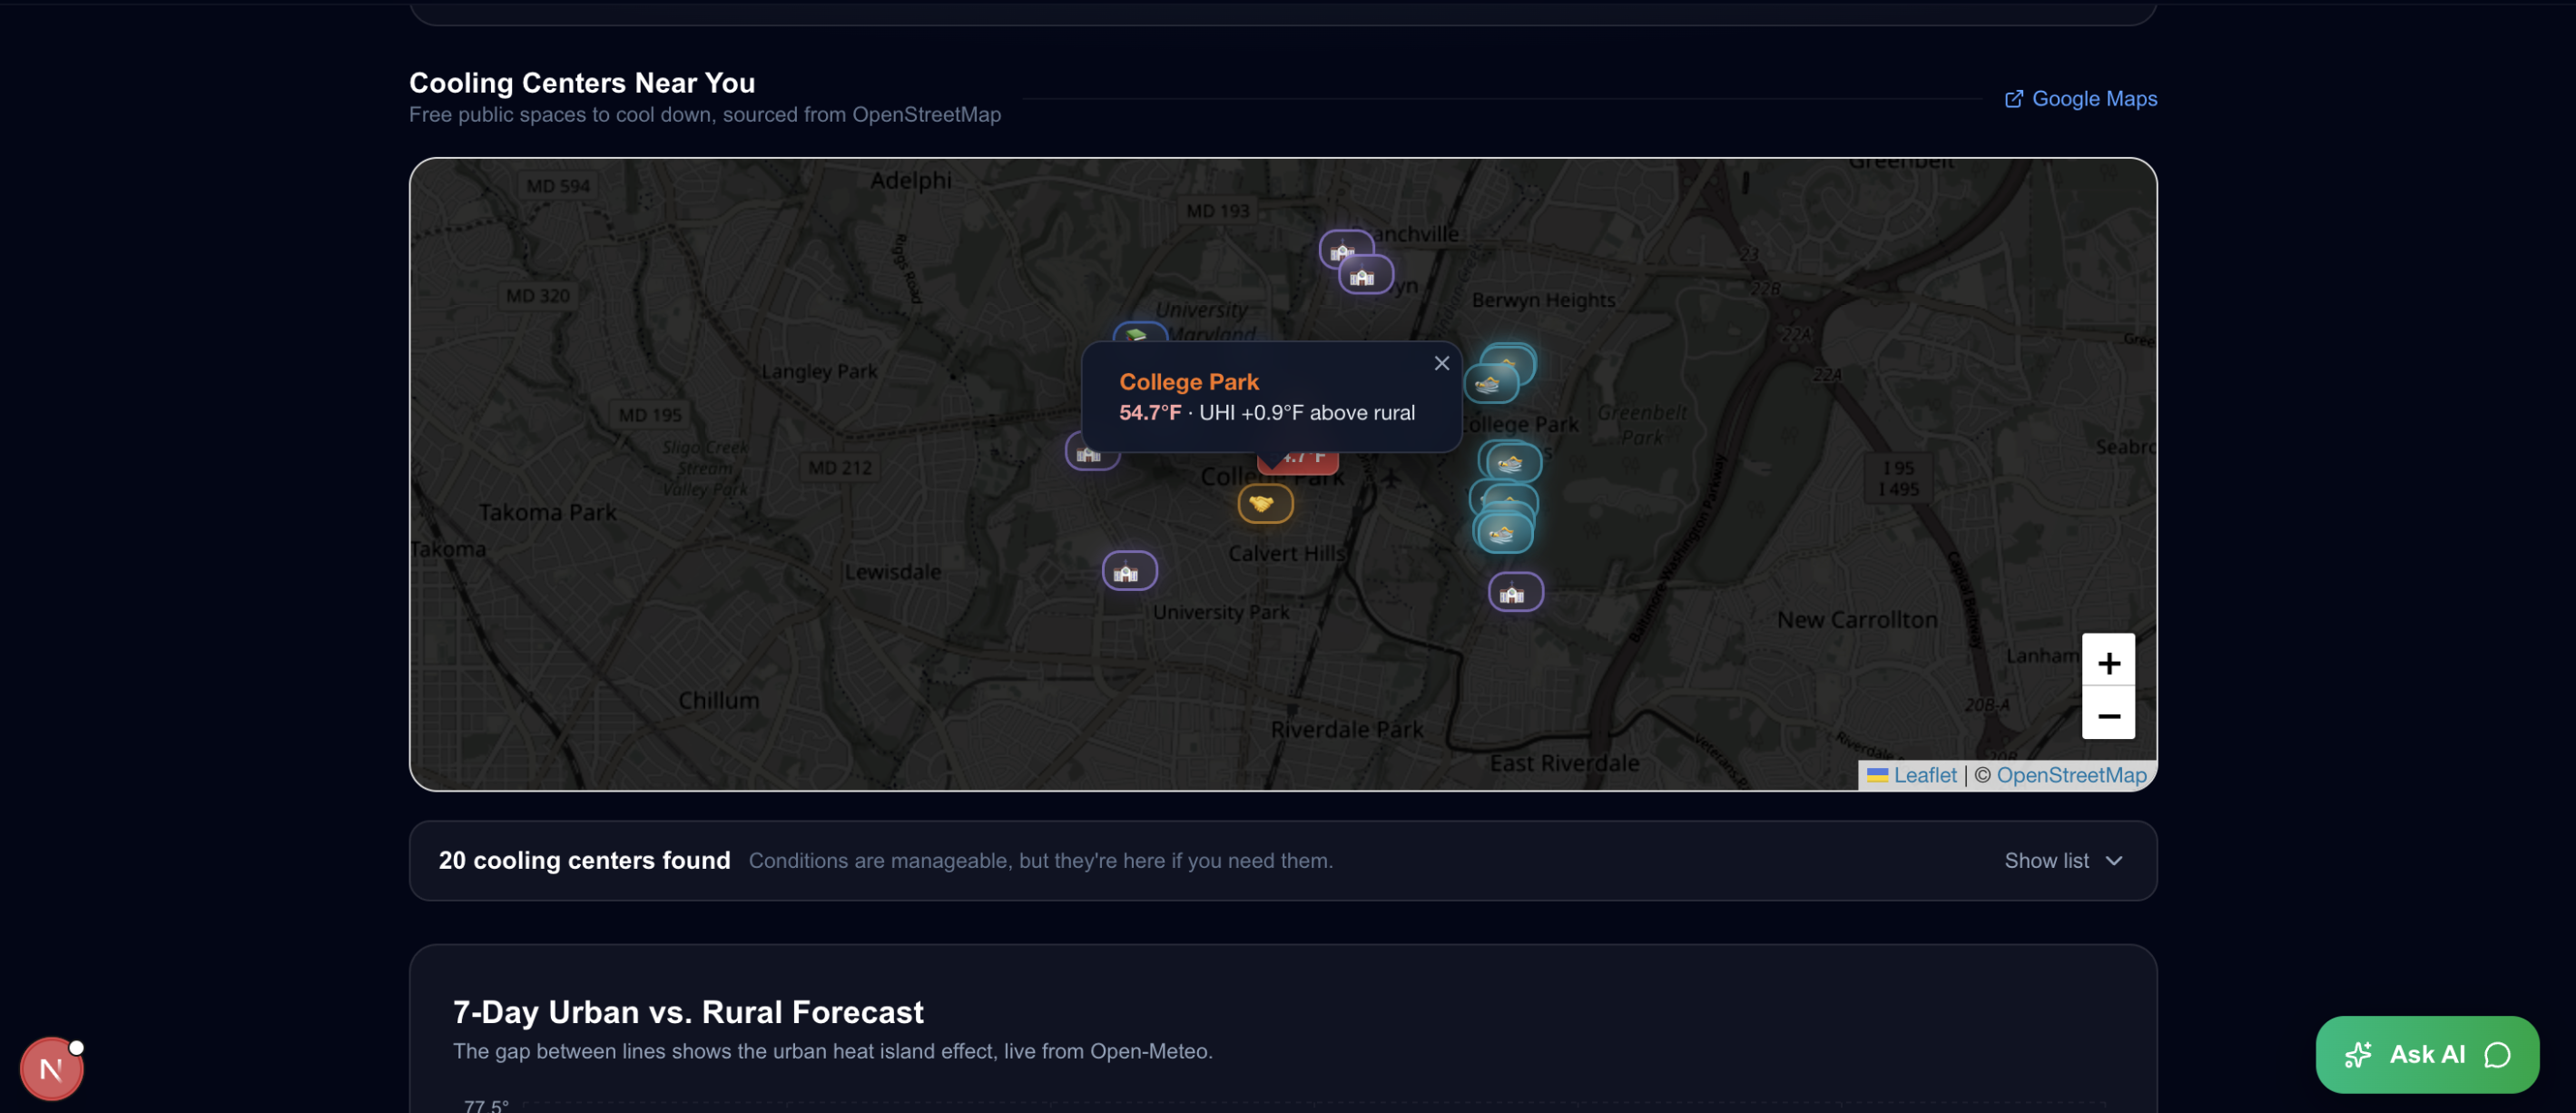
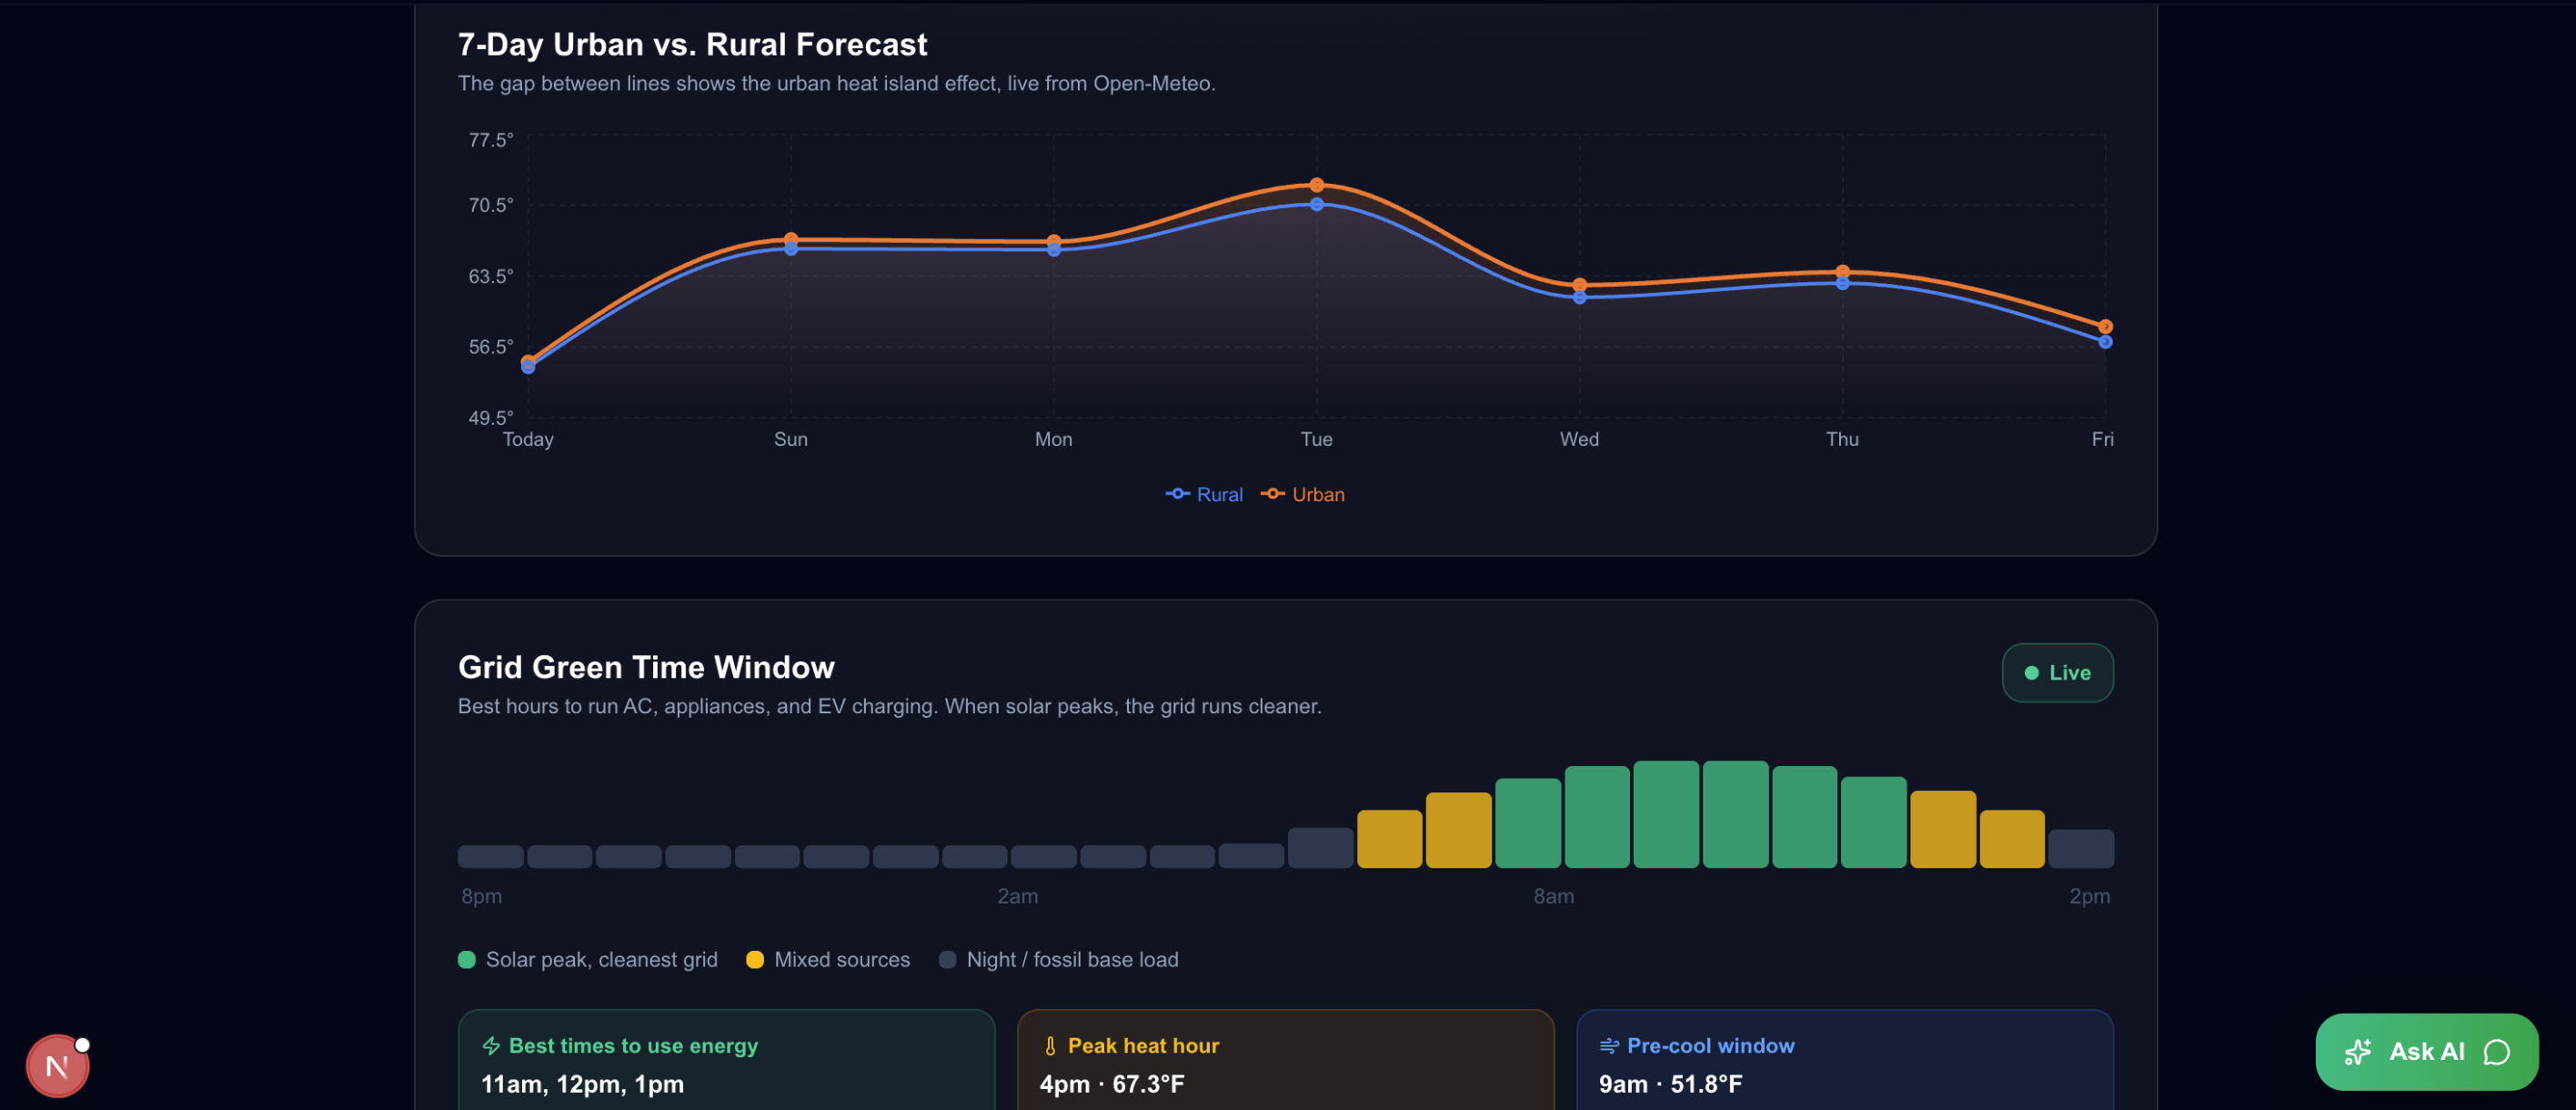
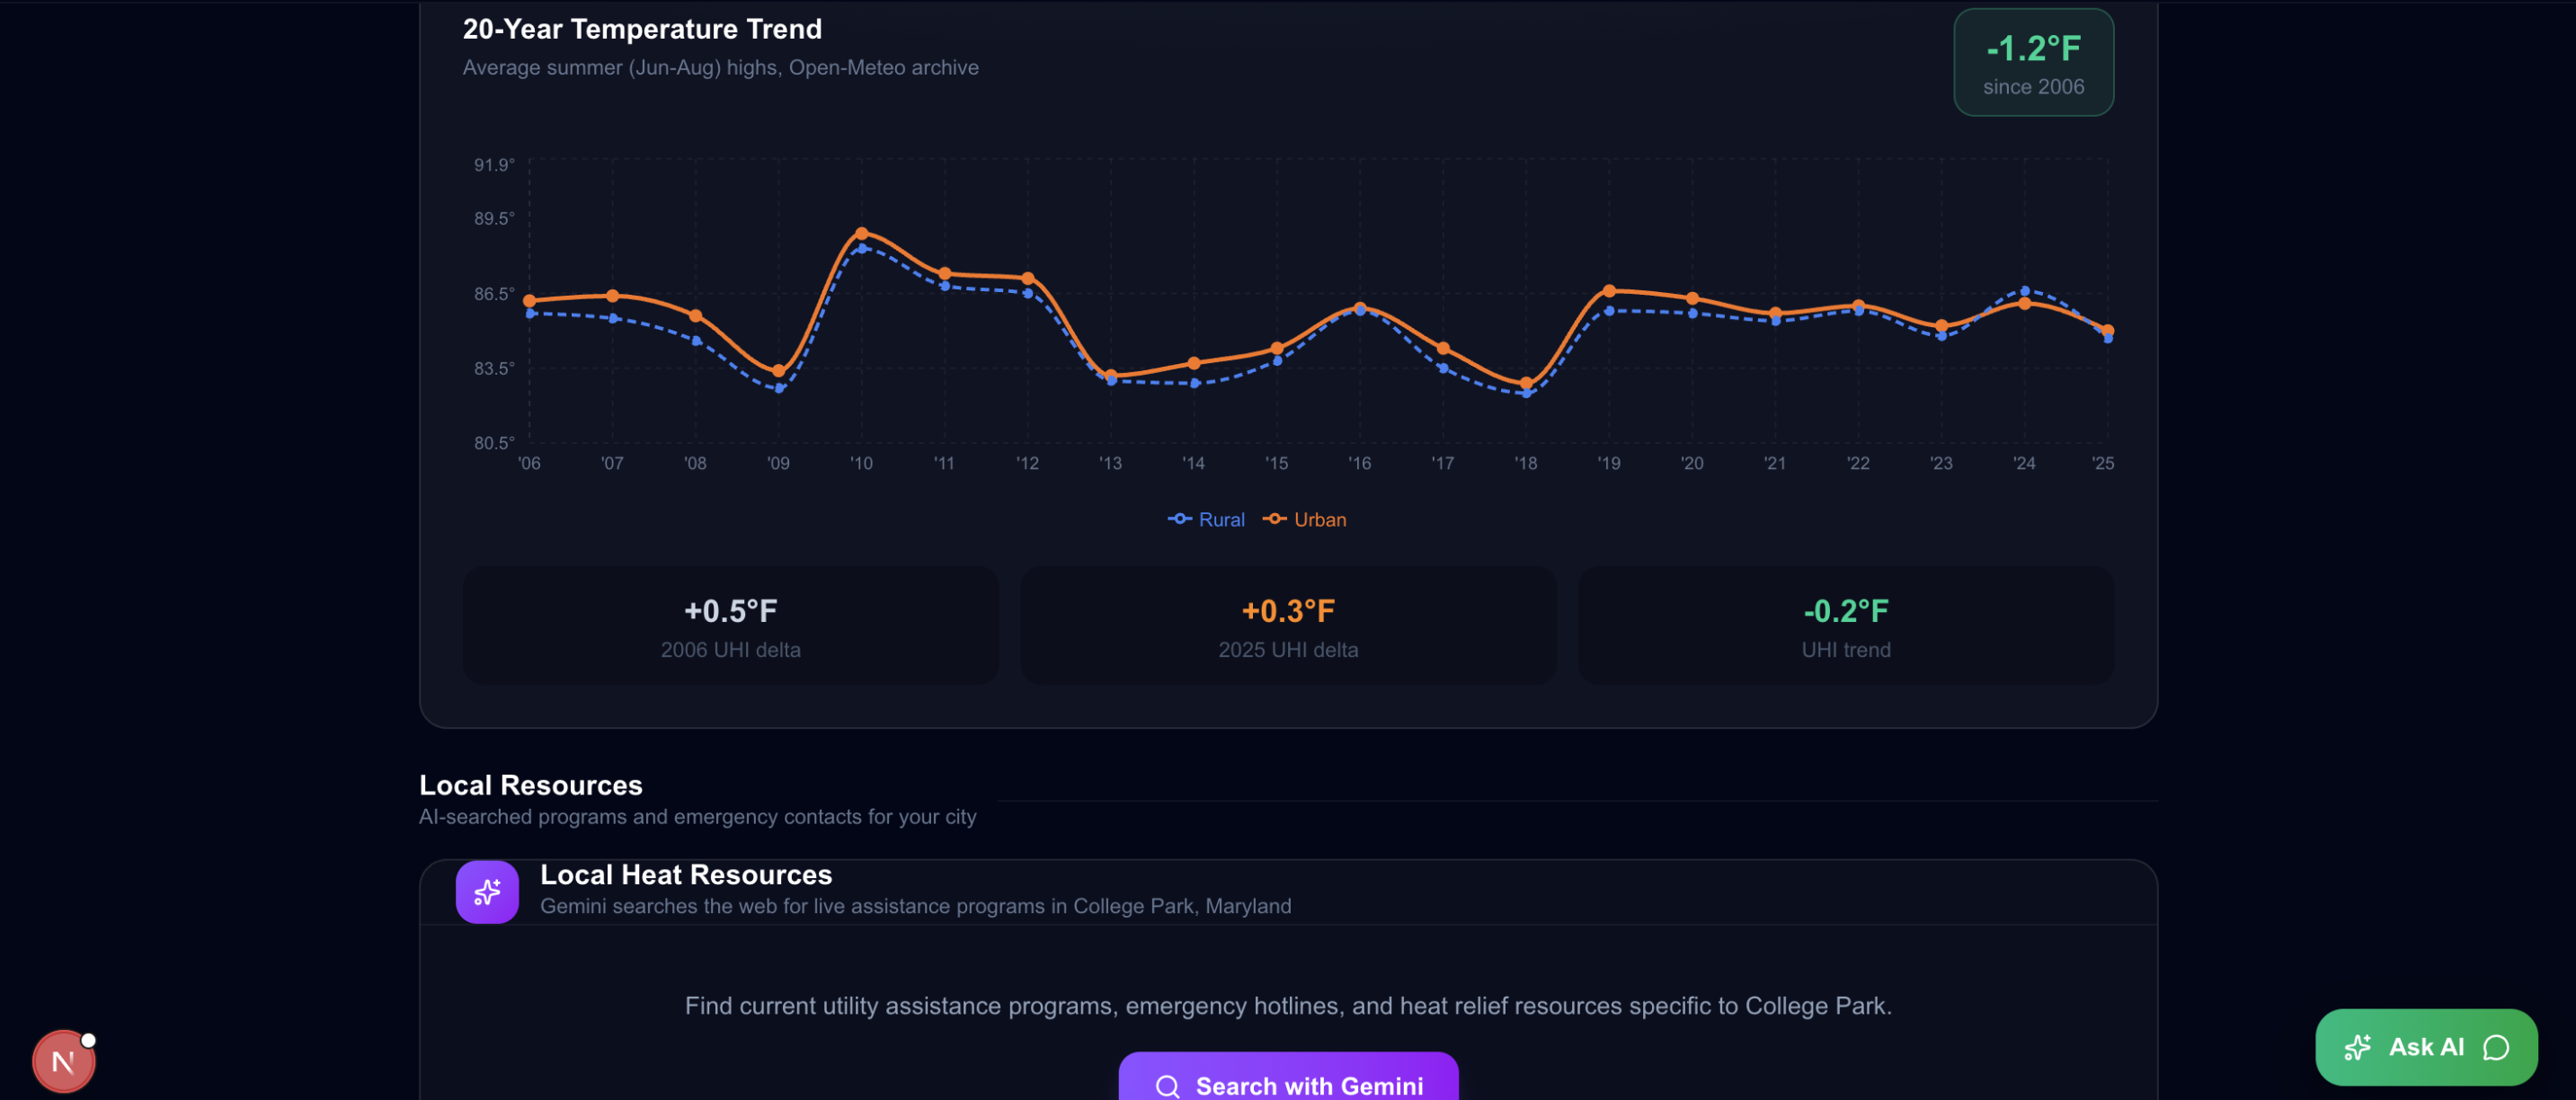
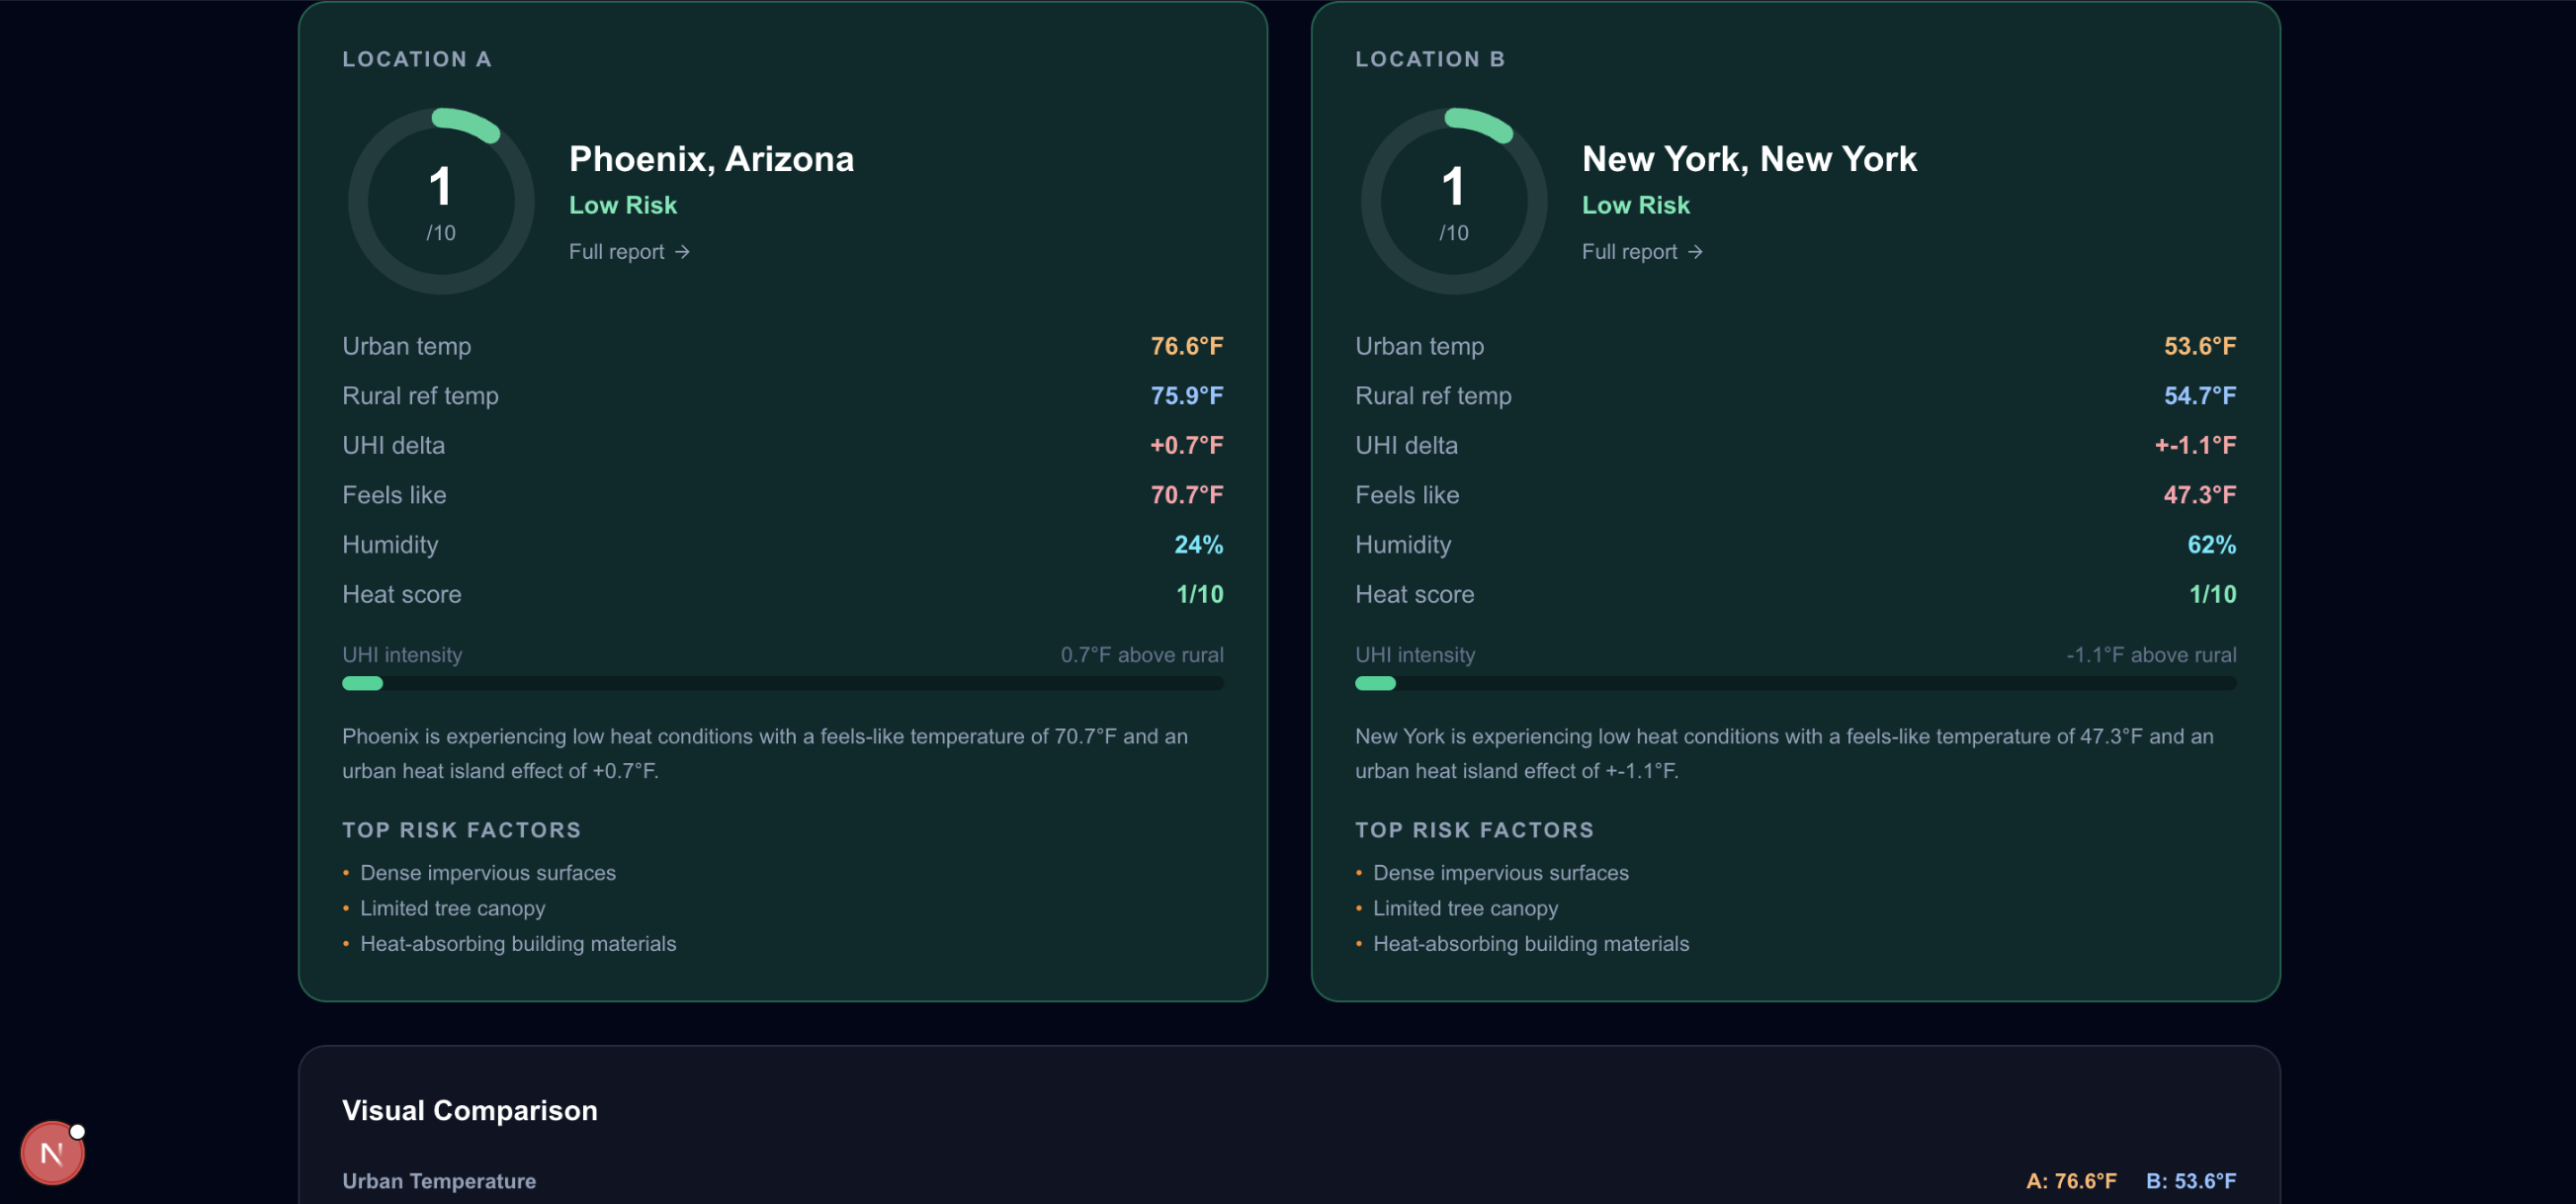
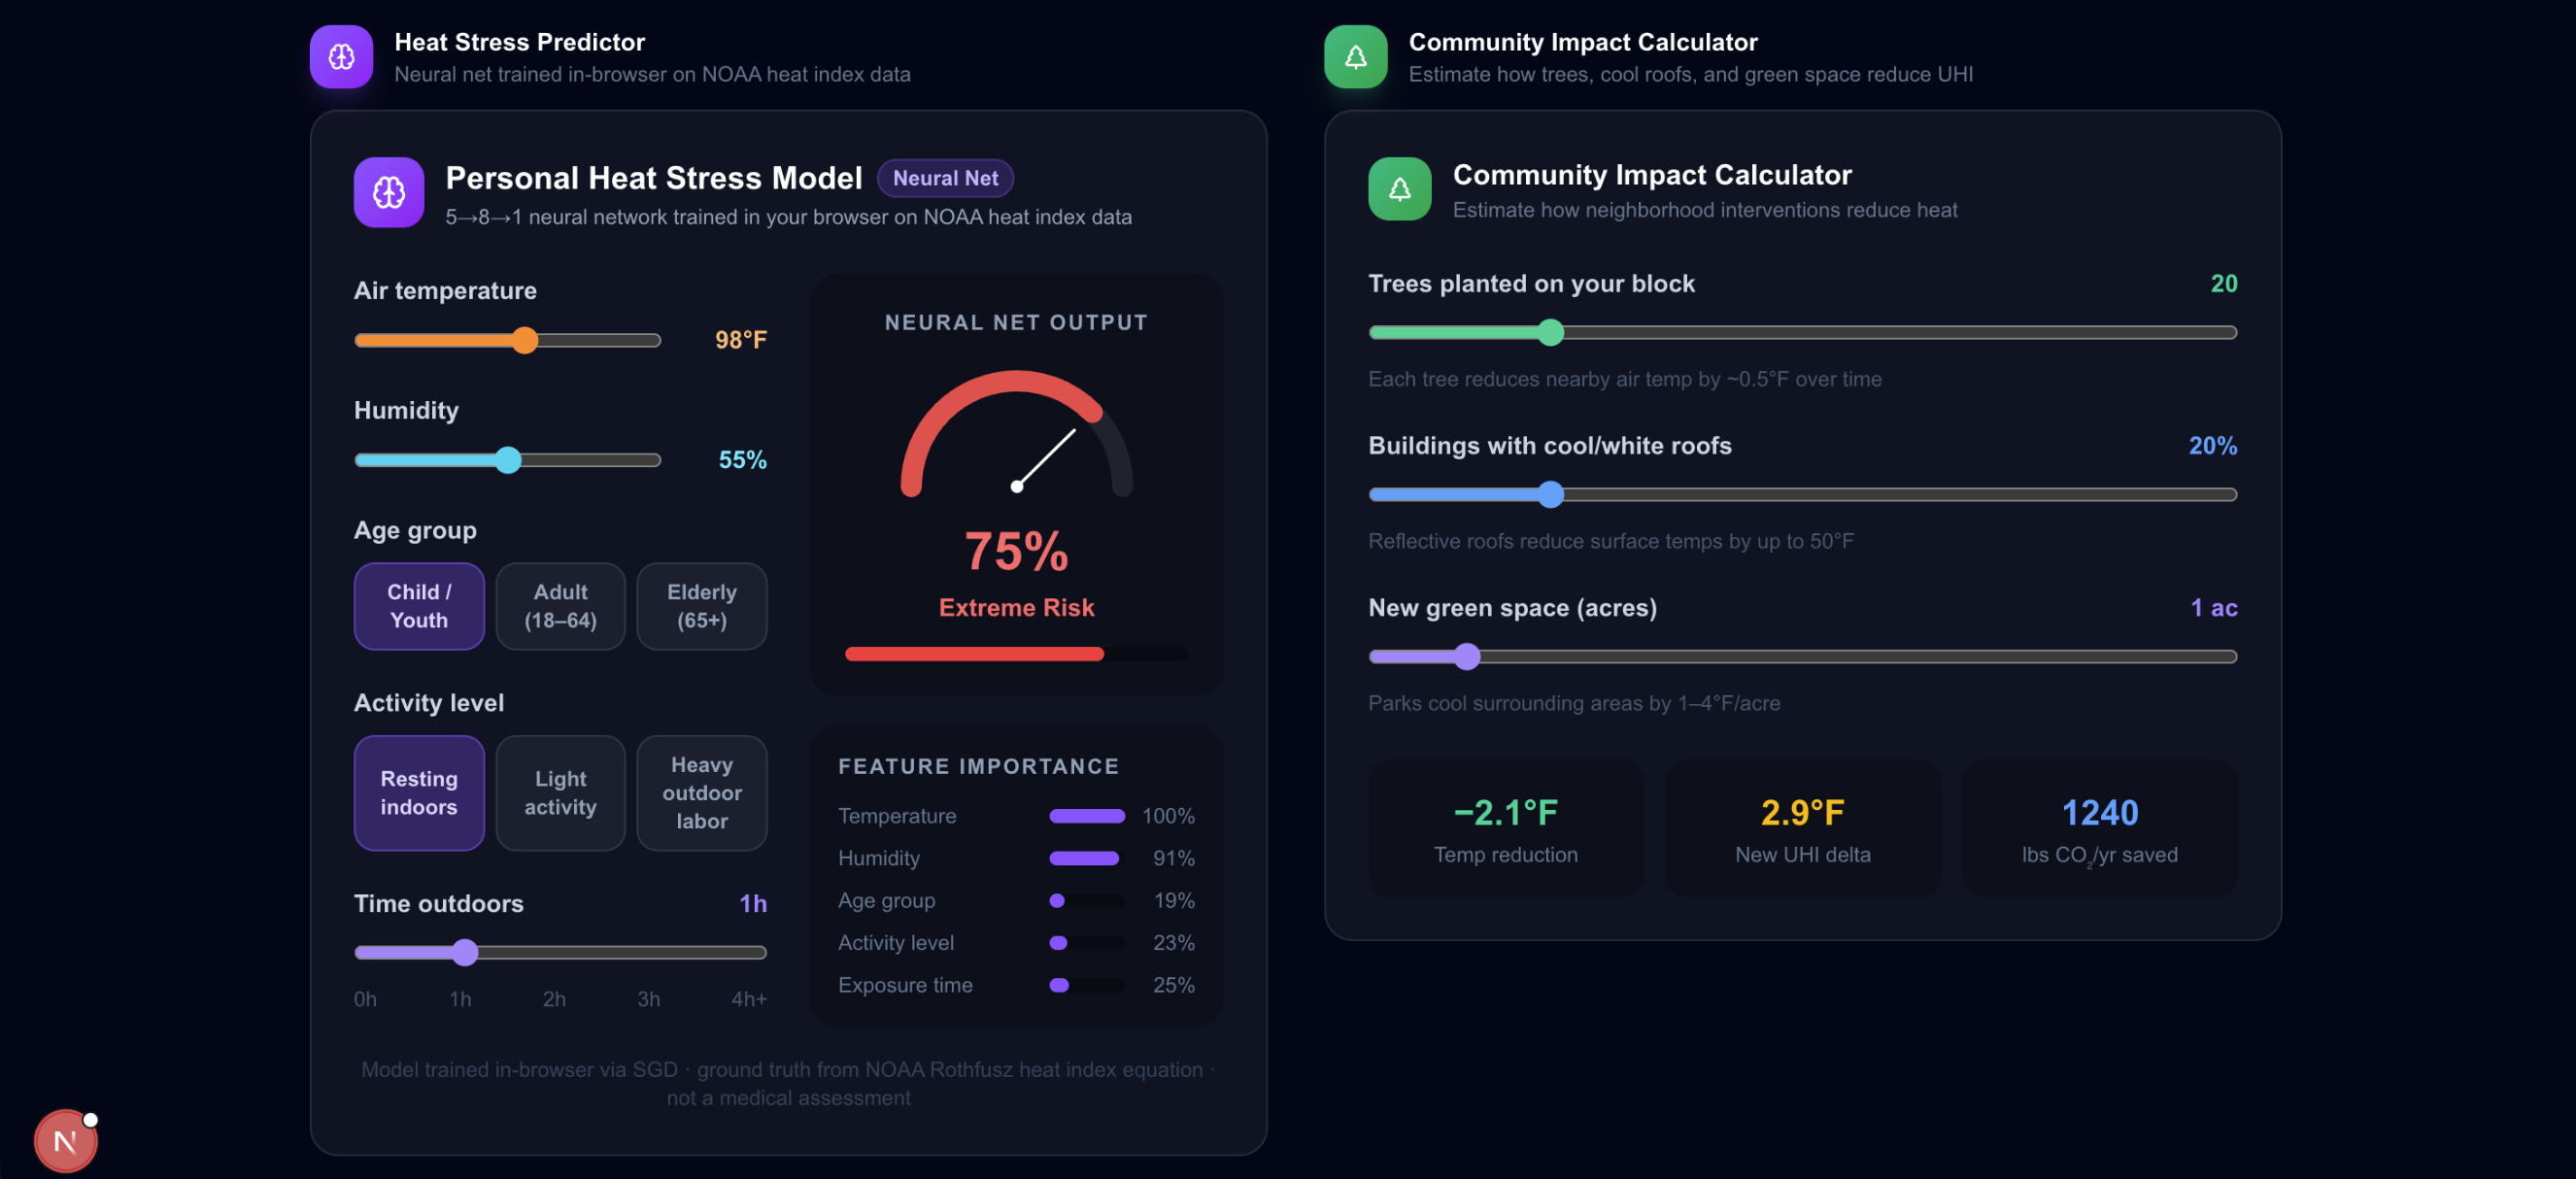
Enter your address and get a live heat risk score with urban vs rural temperature comparison, air quality data, historical trends, and satellite imagery of your area. Find real cooling centers nearby, see forecast heat waves coming, get a personalized action plan based on whether you rent or own, calculate community impact from trees and green space, access emergency resources like 211 and LIHEAP, and connect with local programs and organizations doing heat work.
How we built it
Next.js 16, React 19, Tailwind CSS on the frontend. I created API routes pulling from Open-Meteo, Overpass API, OpenStreetMap, and other free sources.
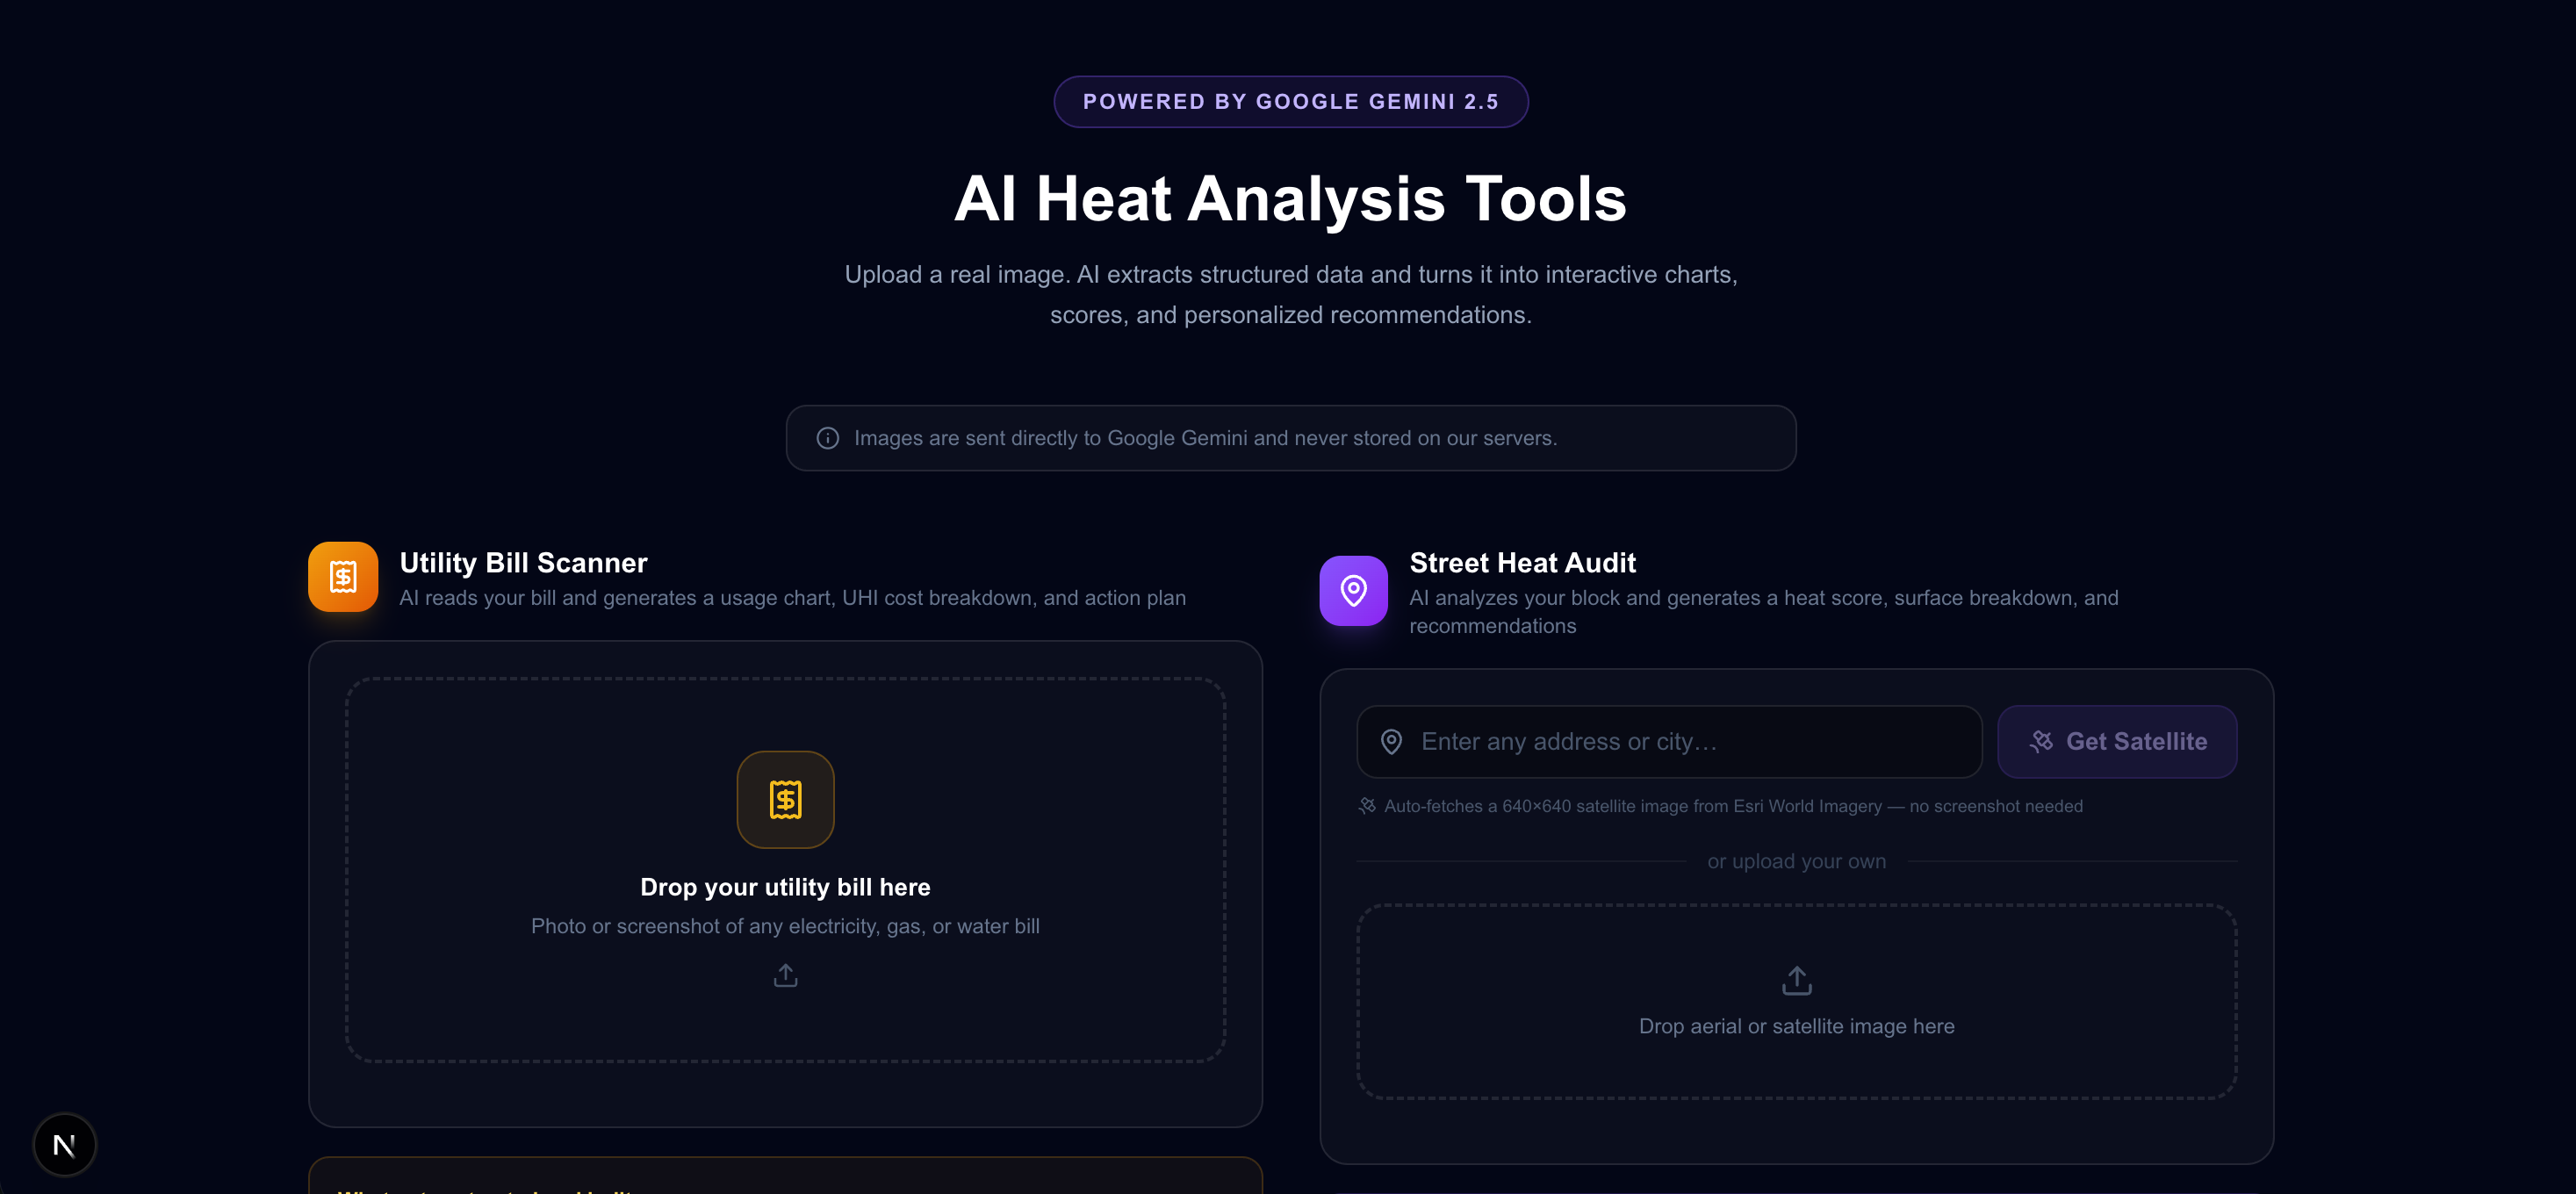
HeatShield uses Google Gemini's vision capabilities through two primary features. Users can upload street-level or satellite photos of their neighborhood, and Google Gemini 2.5 Flash Lite analyzes the images to calculate tree canopy percentage, impervious surface coverage, roof colors, and green space, then generates specific heat-reduction recommendations with cost and feasibility estimates. Similarly, users can photograph their utility bill and Gemini extracts energy consumption data, calculates what percentage of their bill goes to cooling, and estimates their "UHI premium" — the extra money they're paying due to the urban heat island effect (typically 15-25% in dense urban areas) — while recommending energy-saving actions with projected monthly savings. Additionally, Gemini powers the app's heat risk scoring by analyzing real temperature and humidity data to identify risk factors and vulnerable populations, and streams personalized heat safety advice through the chat feature with real-time context about local conditions.
Challenges we ran into
Getting accurate rural reference points 25 km away, handling inconsistent OpenStreetMap data, streaming long Gemini responses without timeouts, designing renter-specific advice, and staying under rate limits on community APIs.
Accomplishments that we're proud of
Working with several APIs to stream in data and analyze and present in a manner that is easy to interpret. Leveraging Google Gemini's multimodal vision capabilities to enable residents to photograph utility bills and neighborhood images, with Gemini automatically extracting energy data and analyzing urban heat infrastructure. This made the invisible "UHI premium" on electricity bills quantifiable and generated site-specific cooling recommendations based on actual neighborhood conditions. We also implemented Gemini's streaming API for real-time personalized heat safety advice, delivering responsive and trustworthy guidance.
Built With
- gemini
- nextjs
- open-meteo-forecast
- overpass-openstreetmap
- react
- tailwind

Log in or sign up for Devpost to join the conversation.