-
-
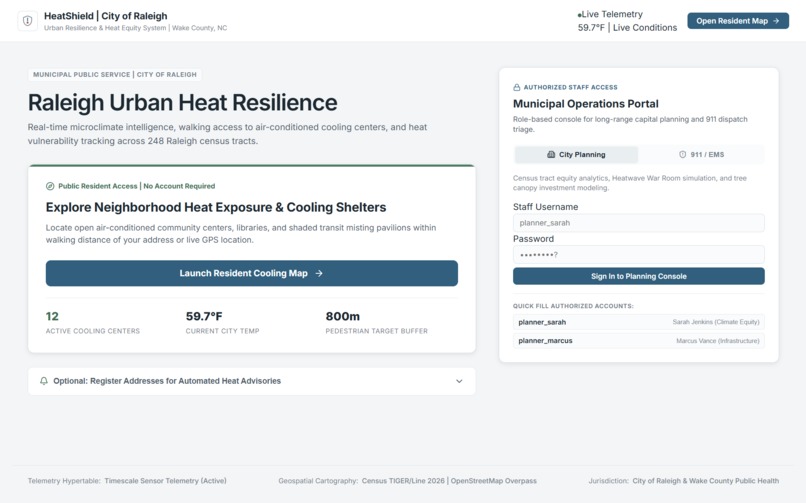
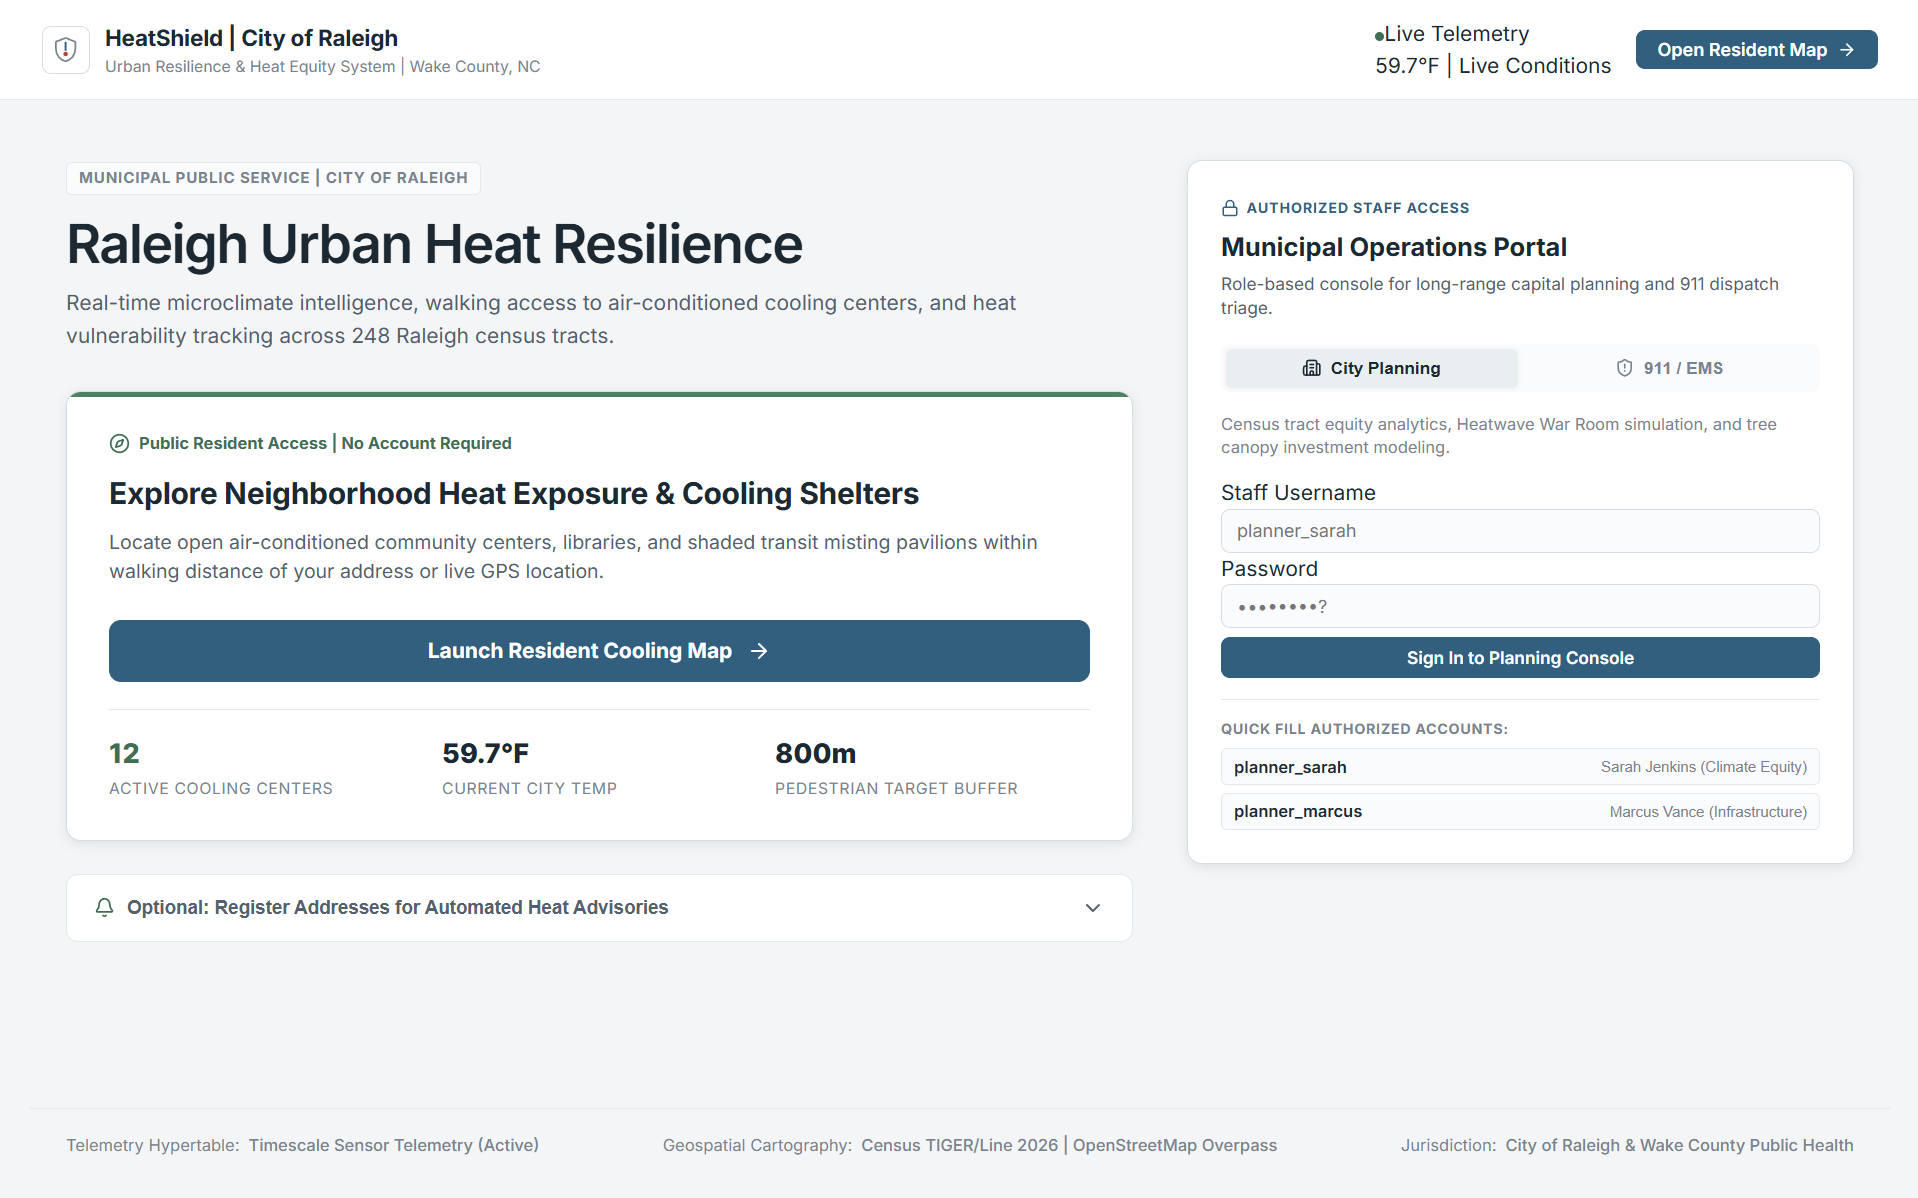
The main project landing page
-
-
-
-
-
-
-
-
-
-
-
-
-
Inspiration
Extreme heat is not just a temperature problem. Two neighborhoods can experience the same heat, while one has trees, parks, pools, and cooling resources nearby and the other does not.
We wanted to answer a question that a normal heat map cannot:
When Raleigh gets hotter, who is most at risk—and what should the city do about it?
That idea became HeatShield.
What it does
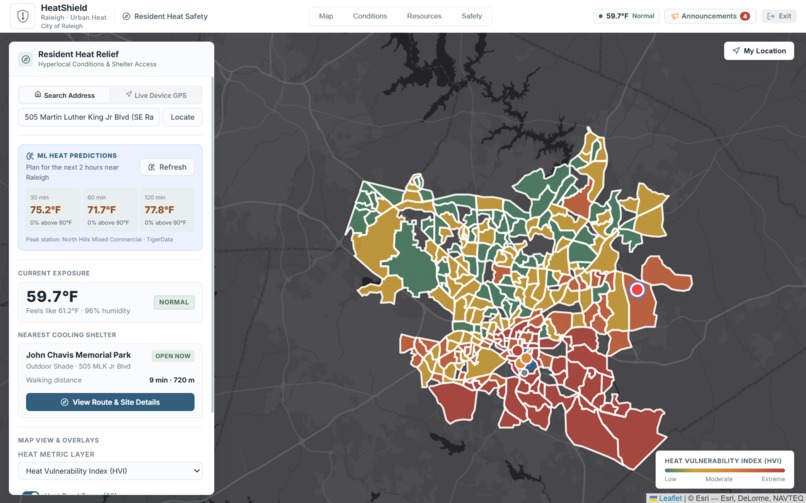
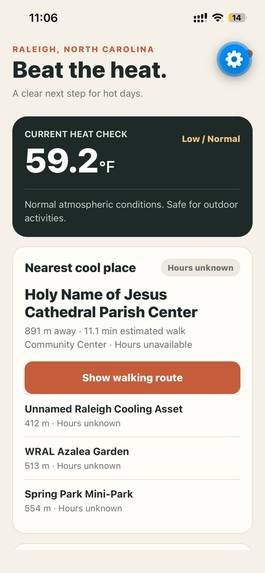
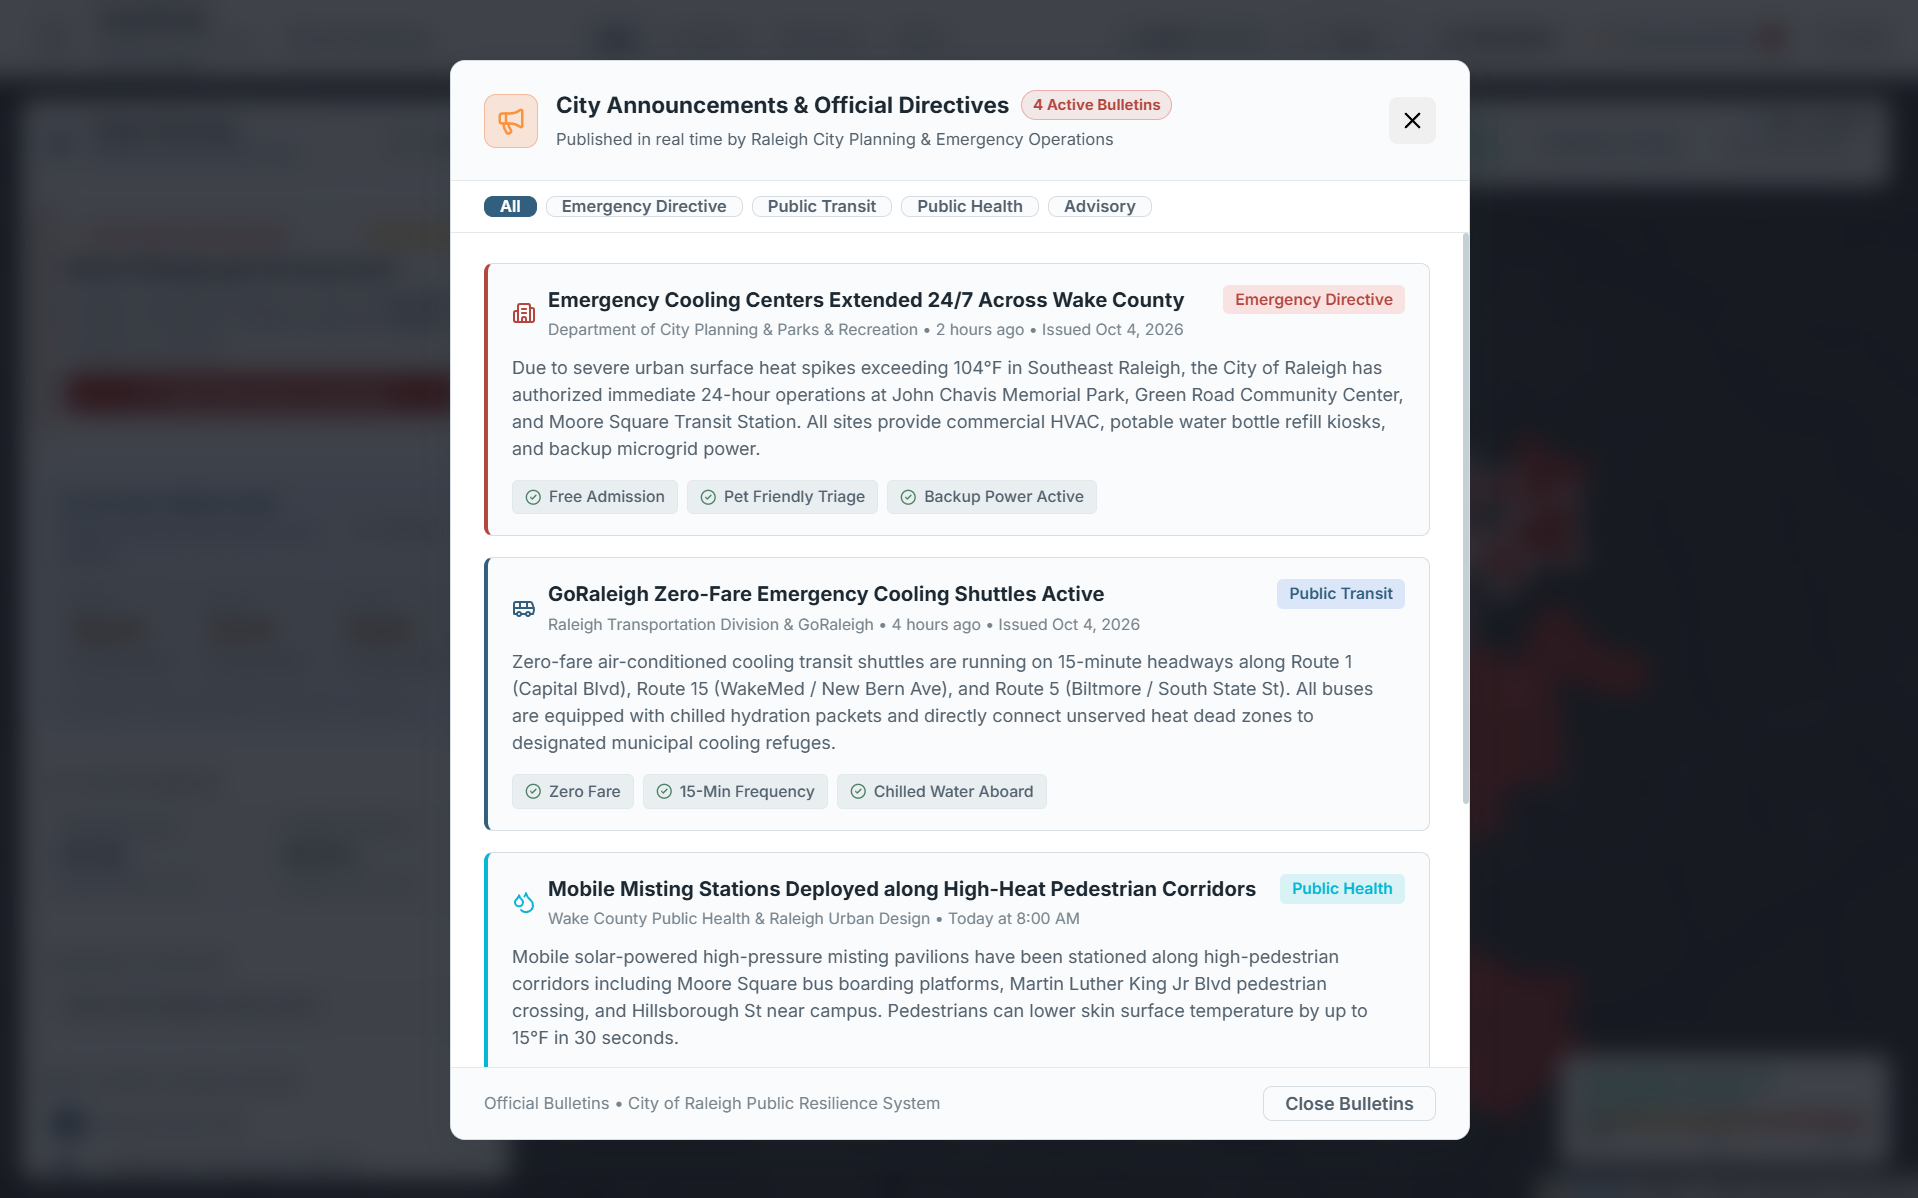
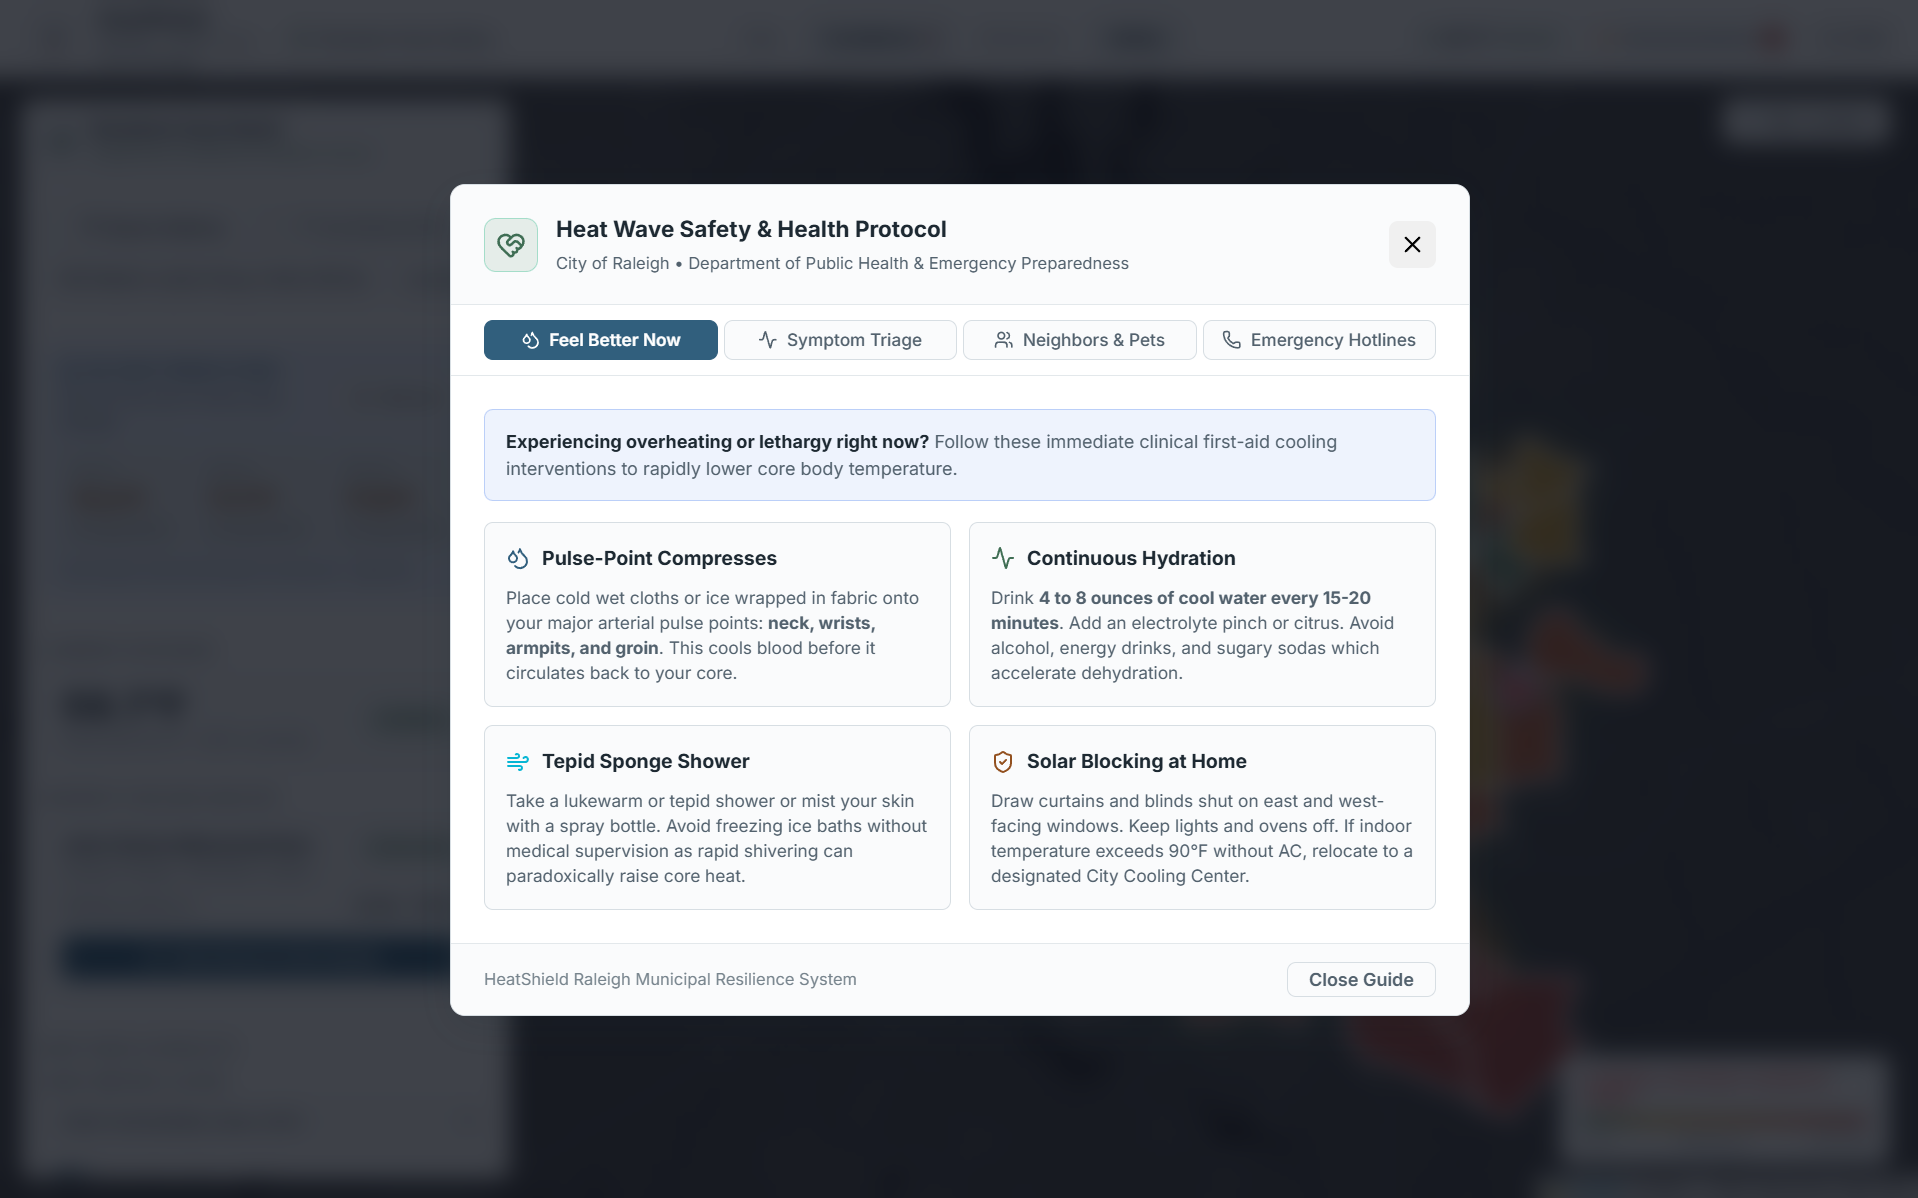
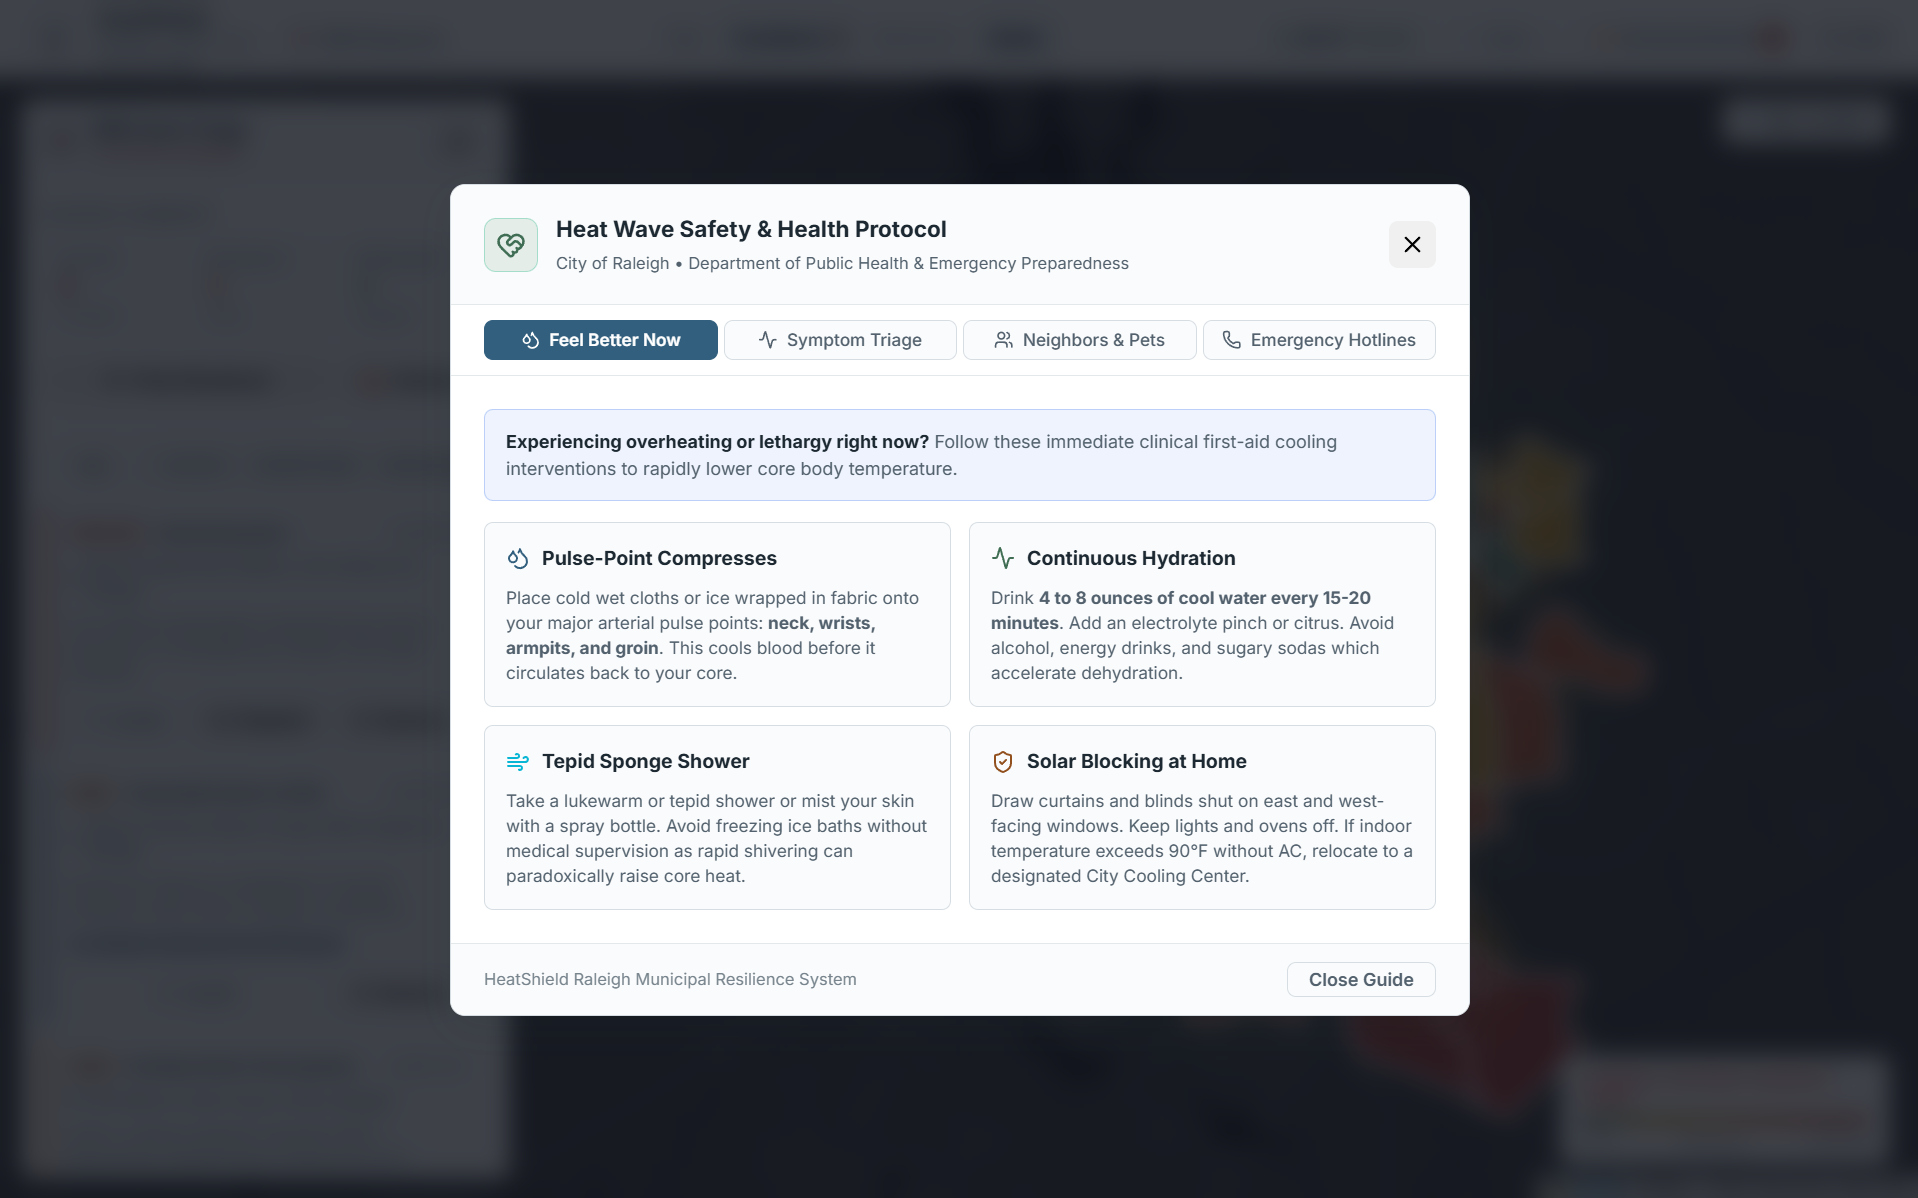
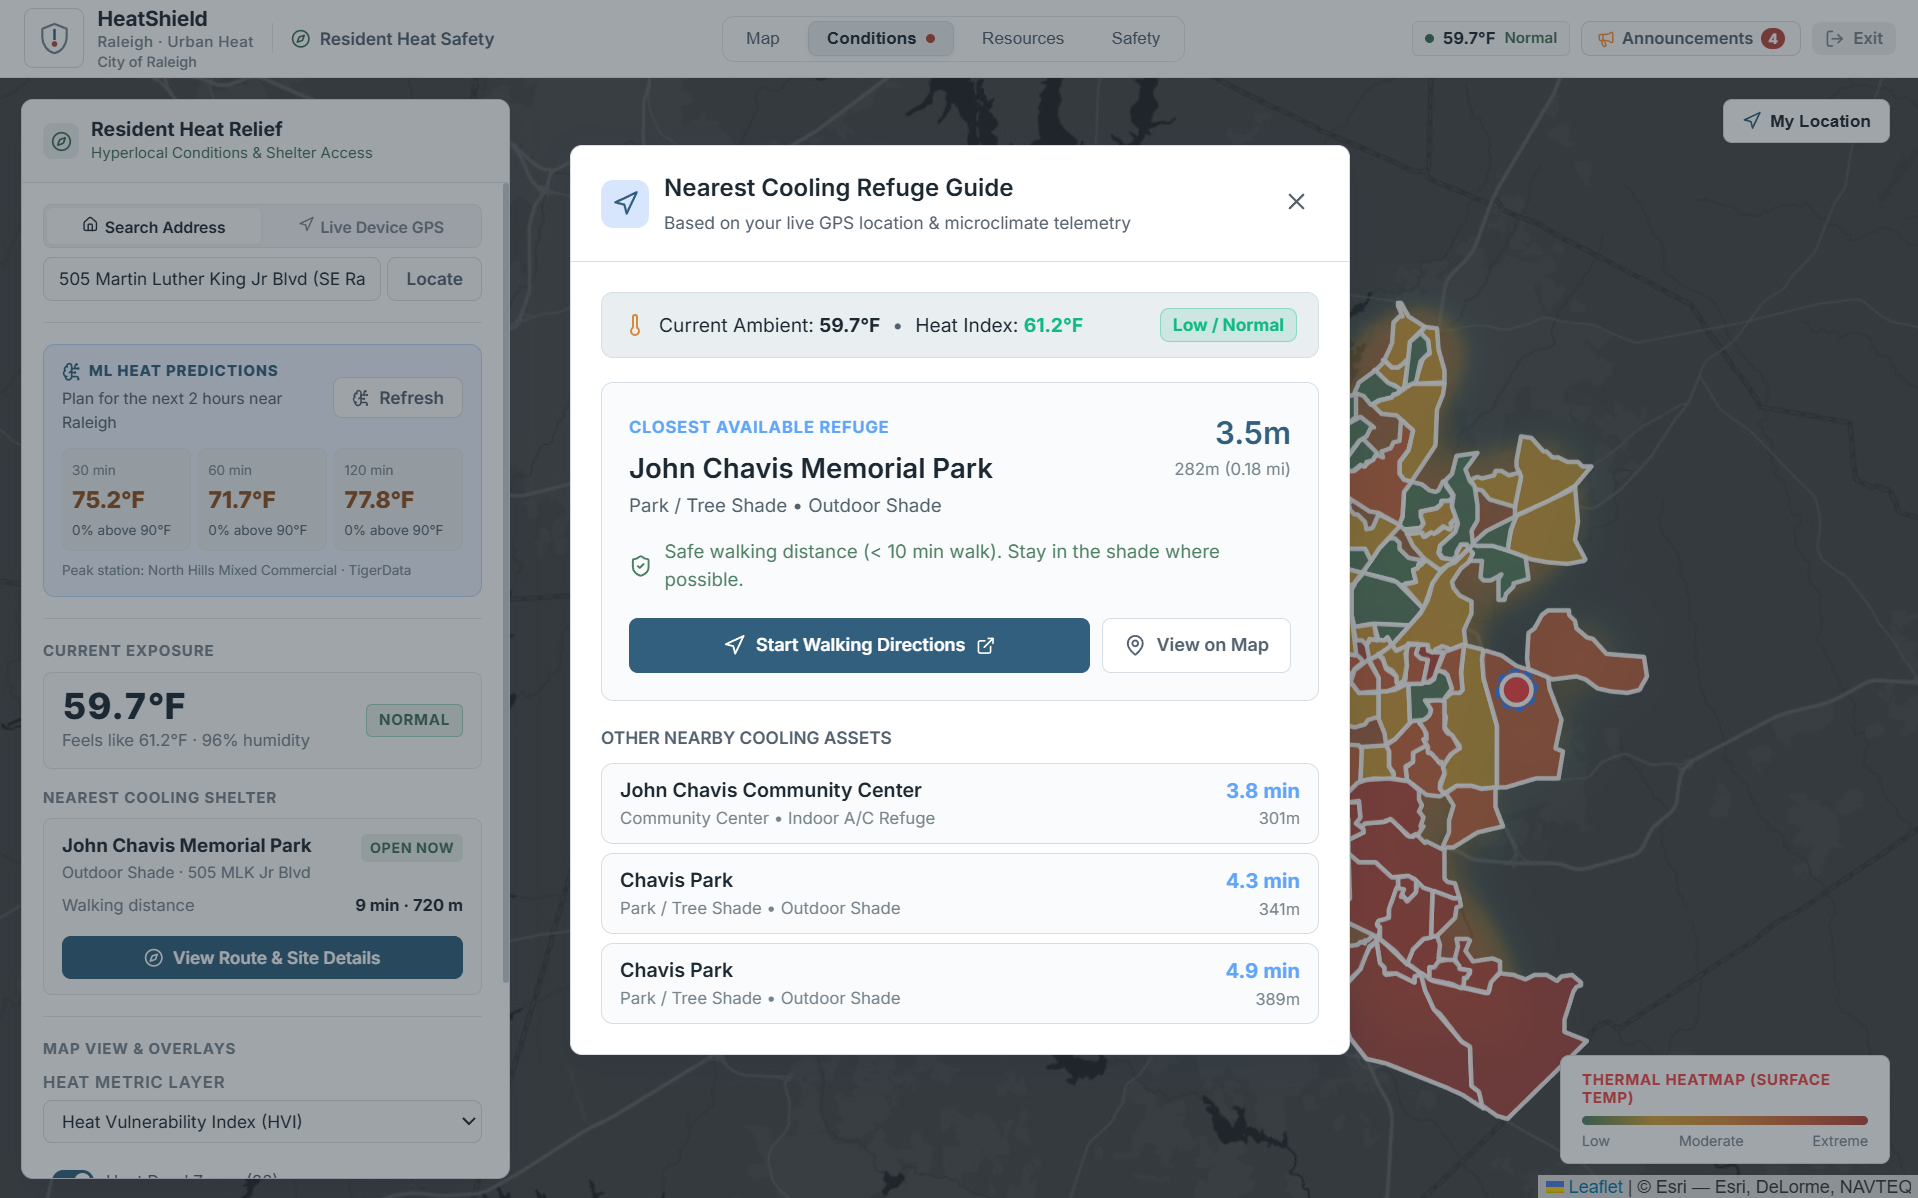
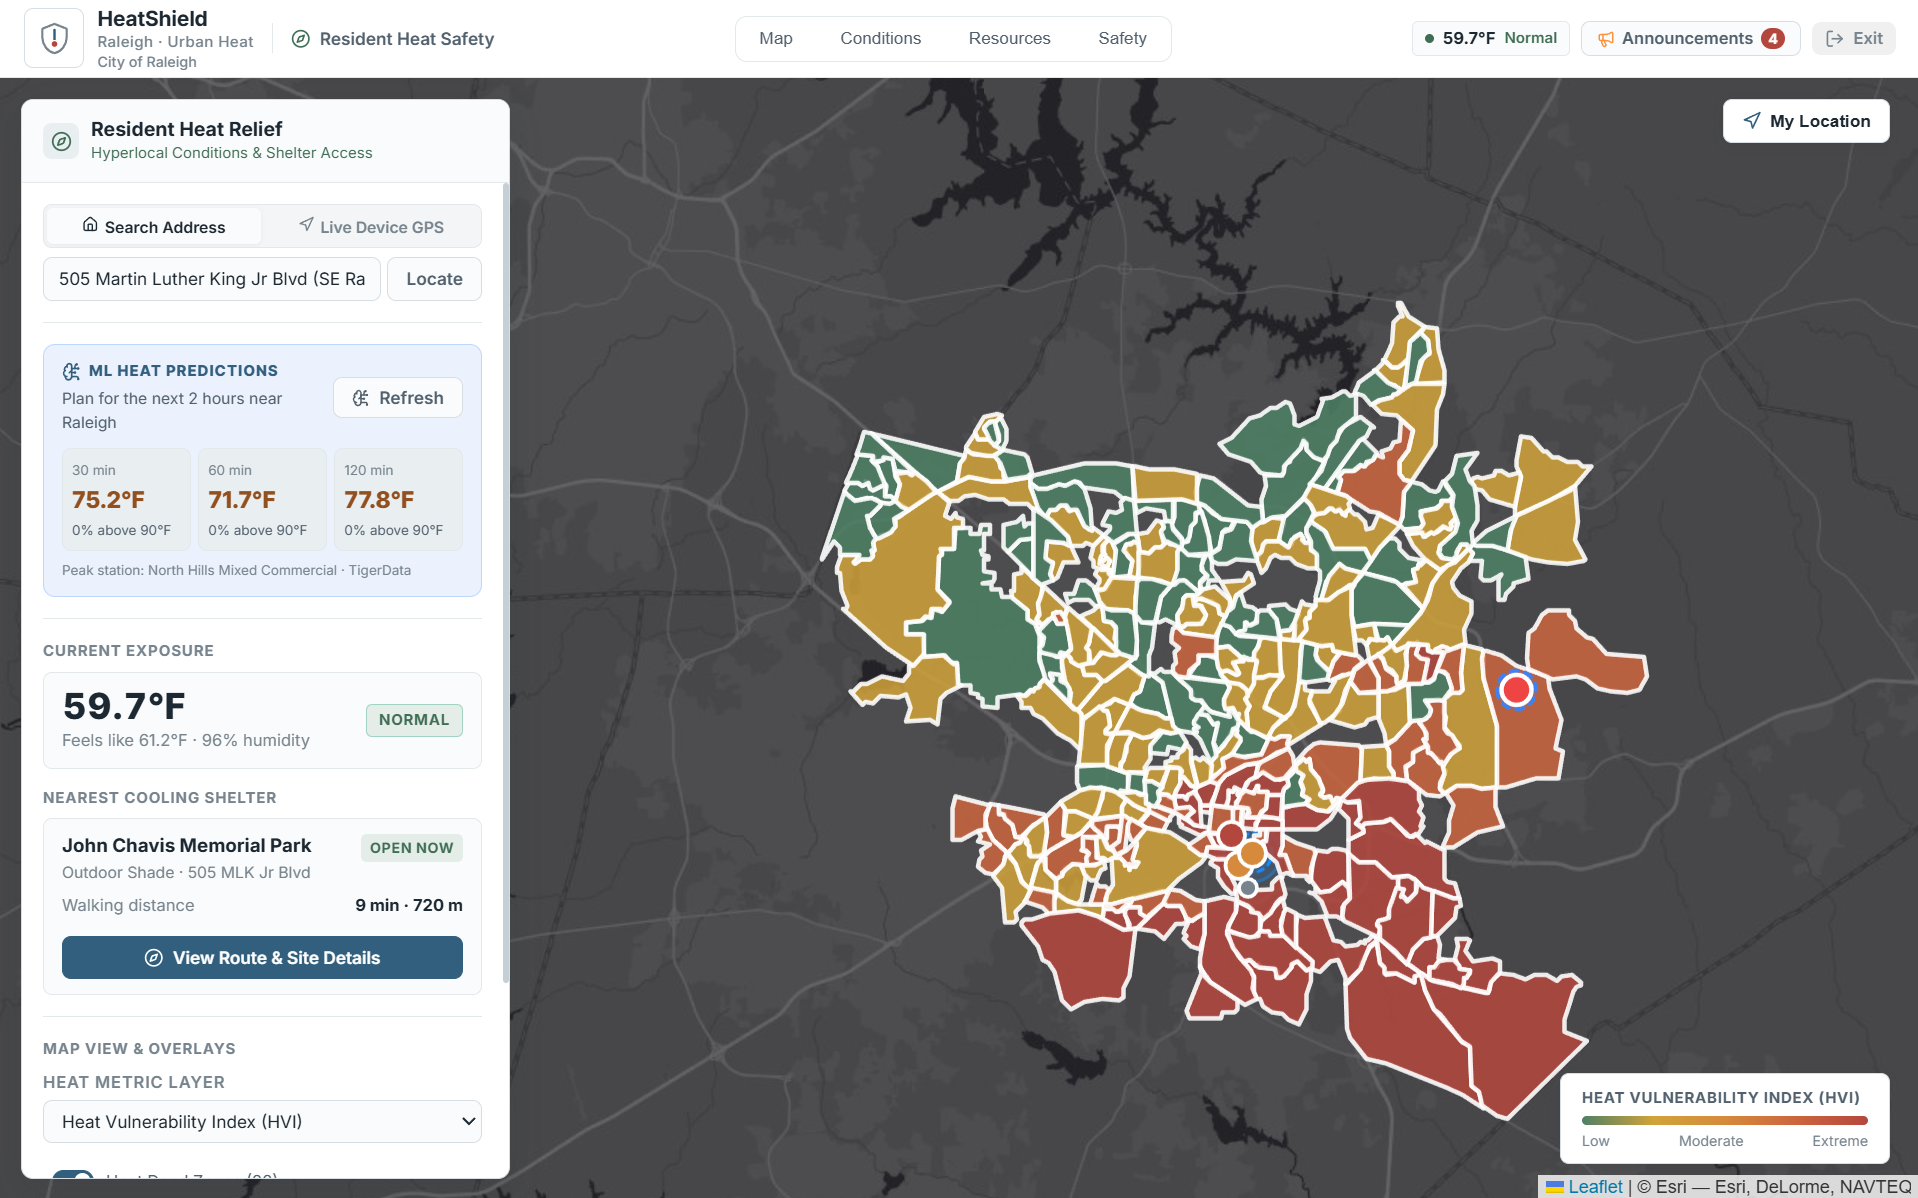
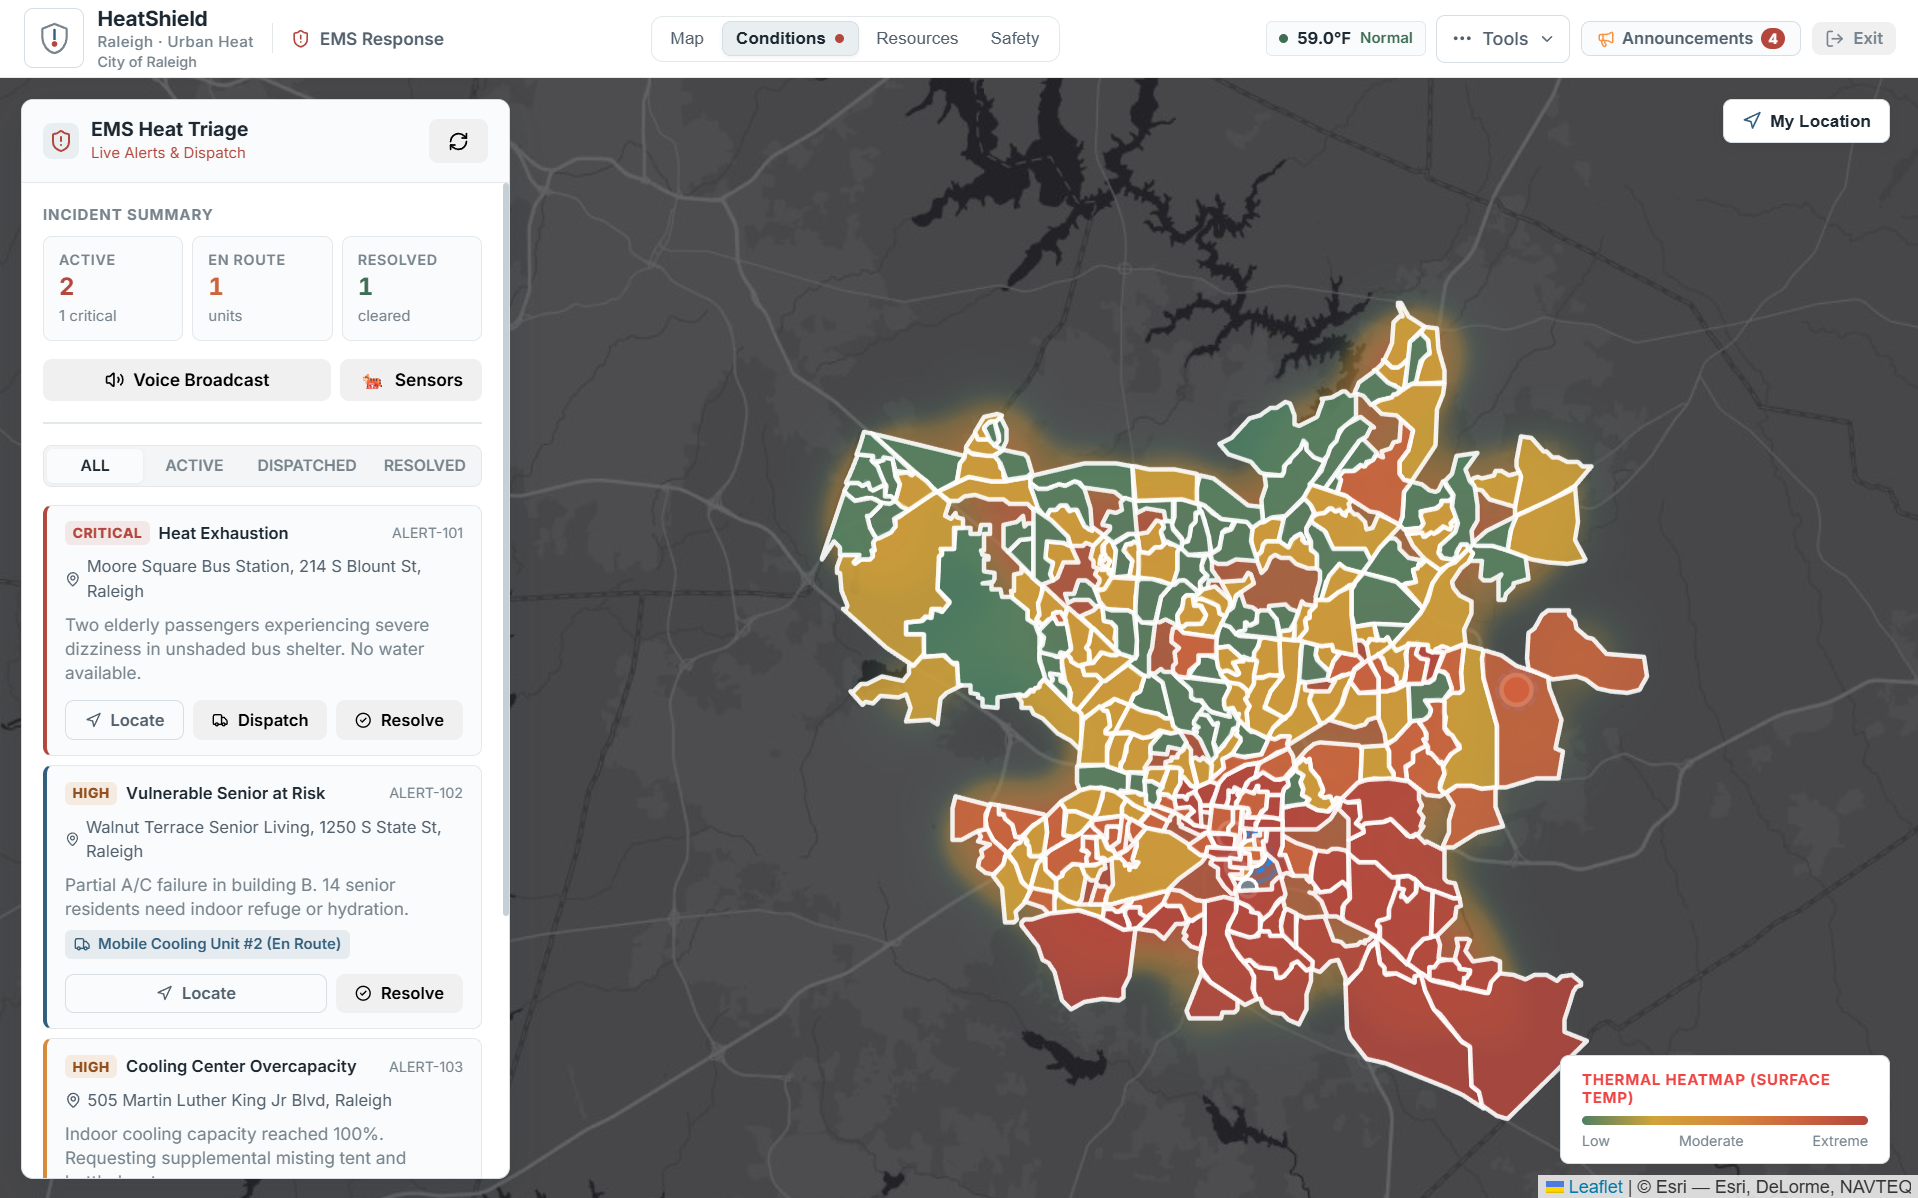
HeatShield is a climate decision-support platform built around Raleigh.
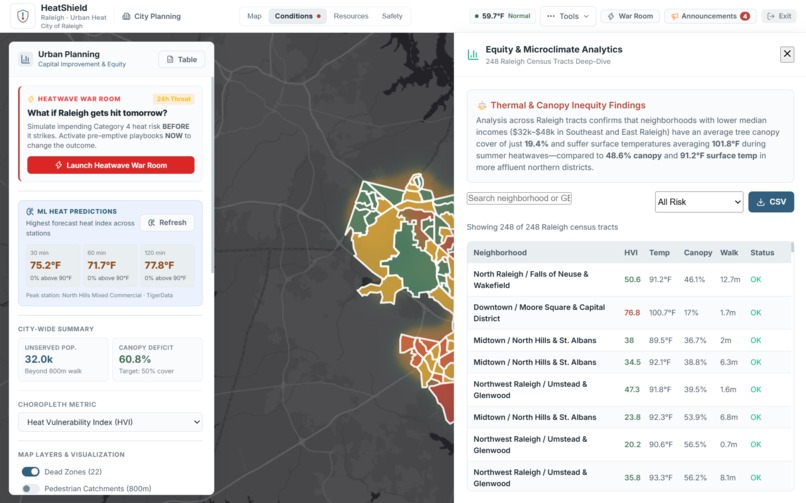
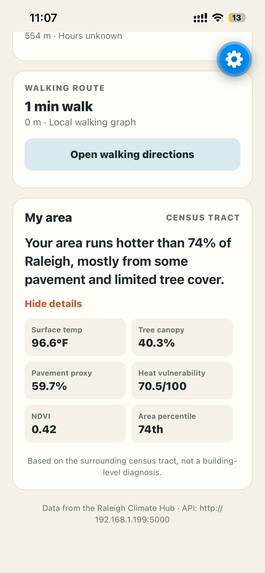
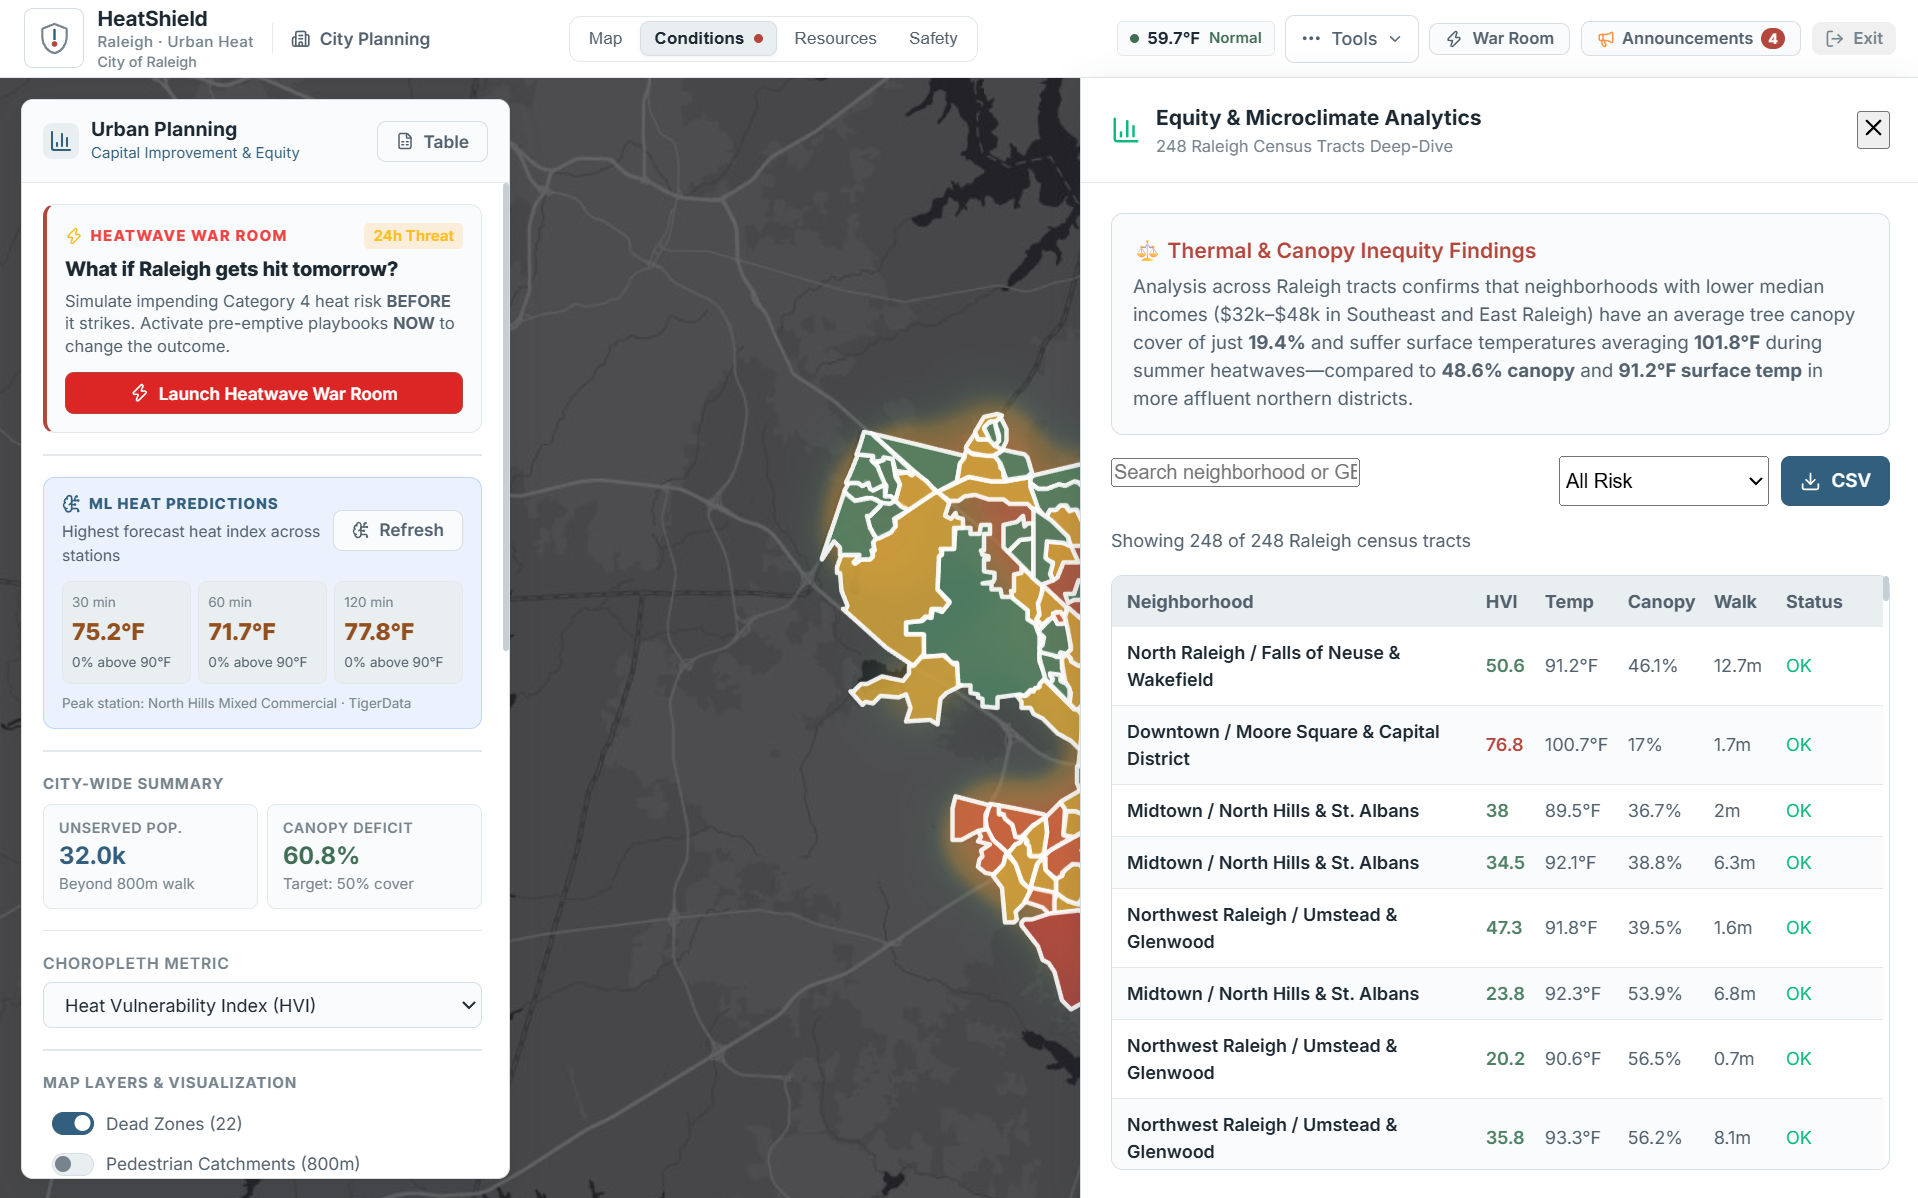
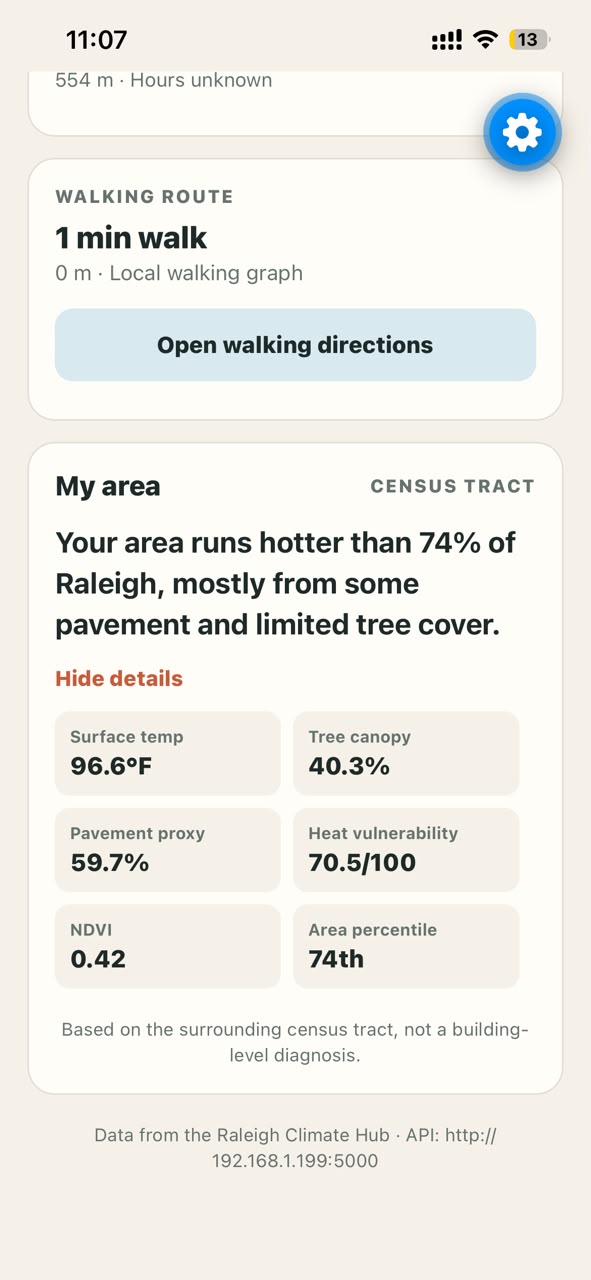
Instead of simply showing where temperatures are high, HeatShield combines heat exposure, demographic vulnerability, tree canopy, impervious surfaces, population data, and access to cooling resources.
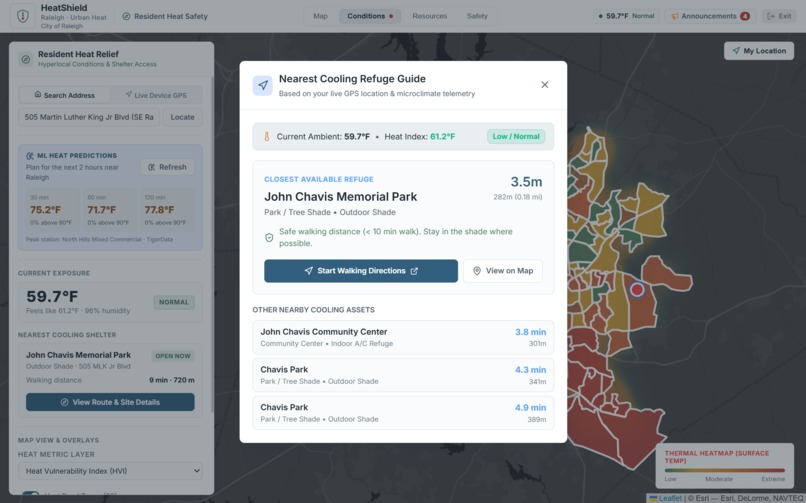
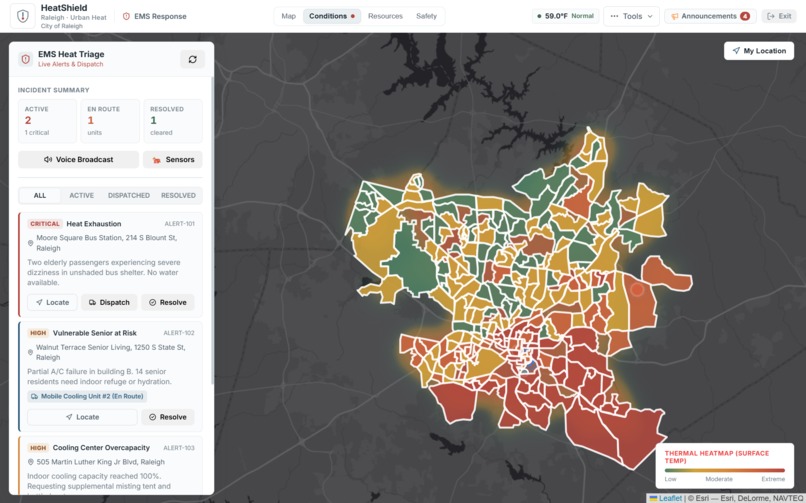
It identifies heat dead zones where high-risk communities lack nearby cooling options.
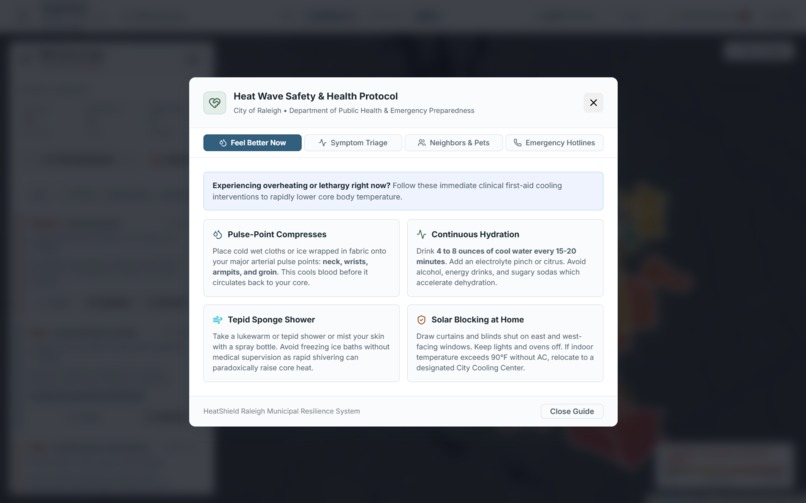
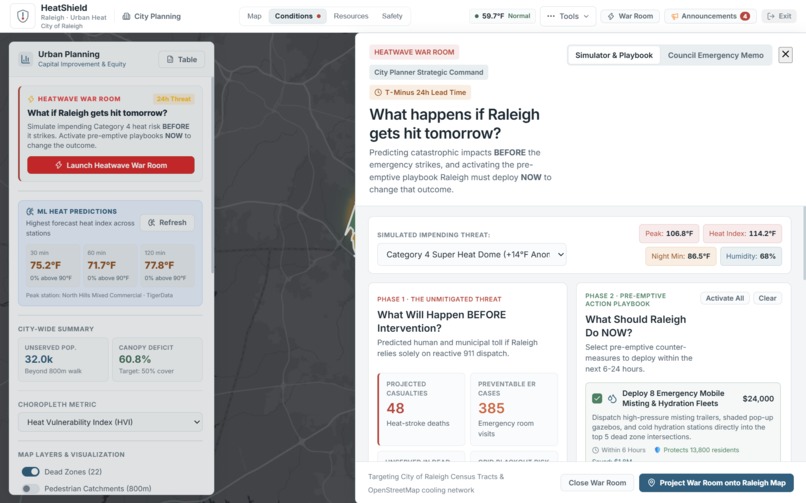
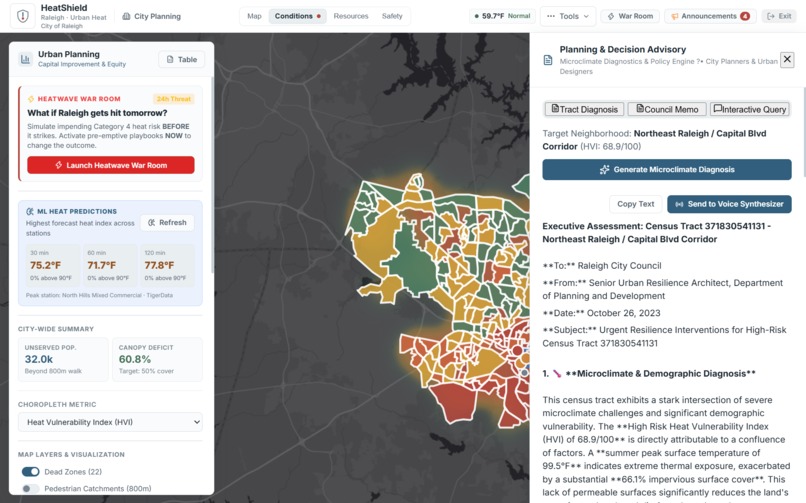
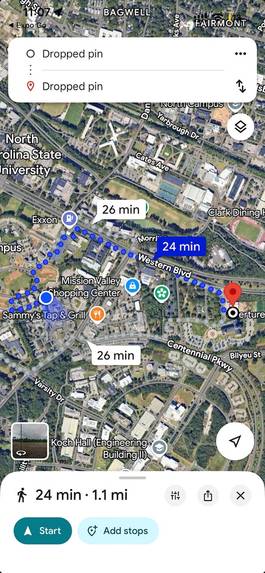
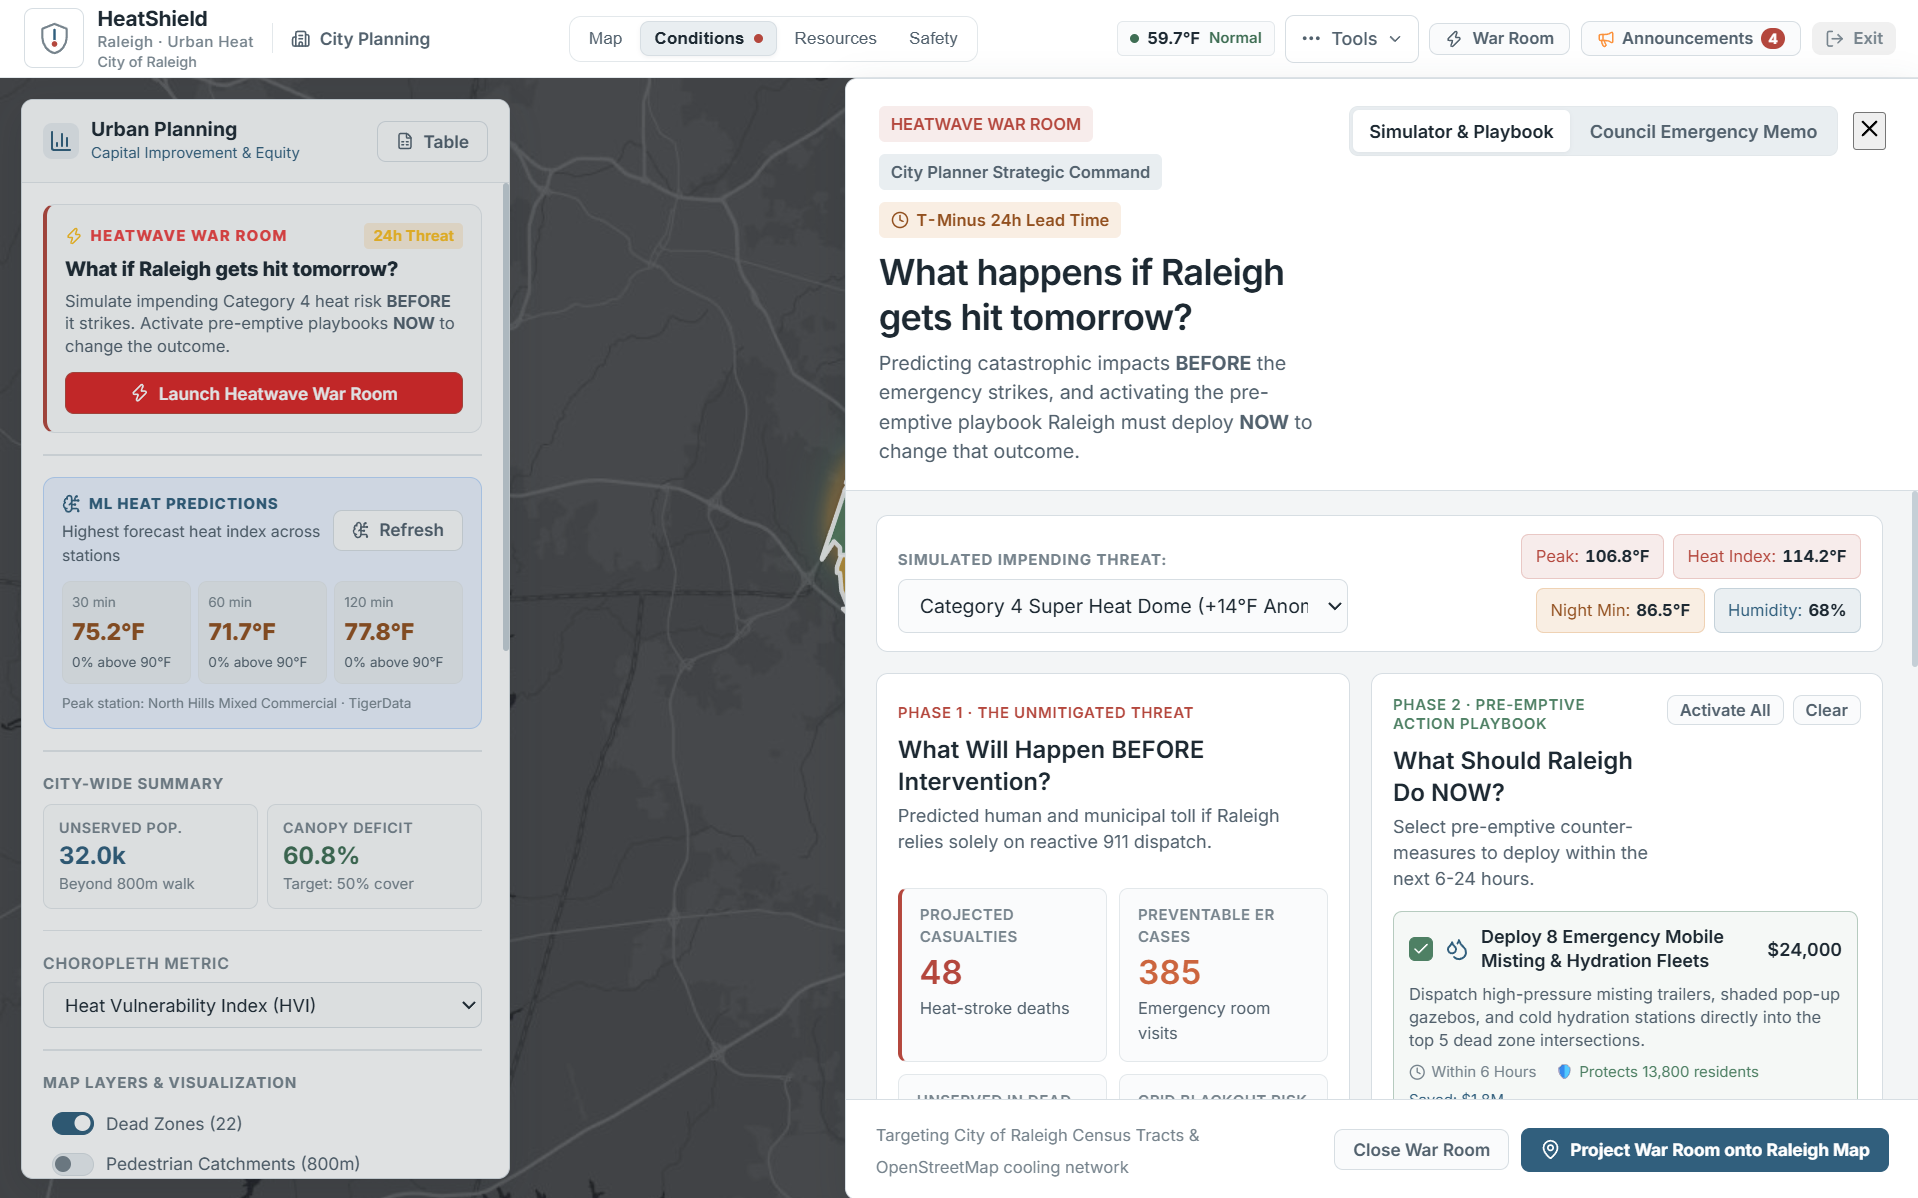
But finding a problem is only the first step. HeatShield lets planners test potential interventions—such as cooling centers, urban forests, splash pads, and shaded hydration hubs—and estimate how each option changes population coverage, accessibility, dead zones, and cost per person.
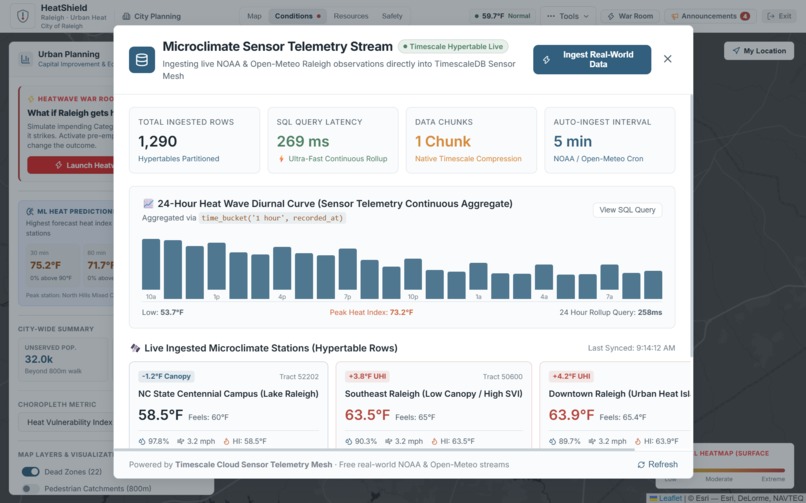
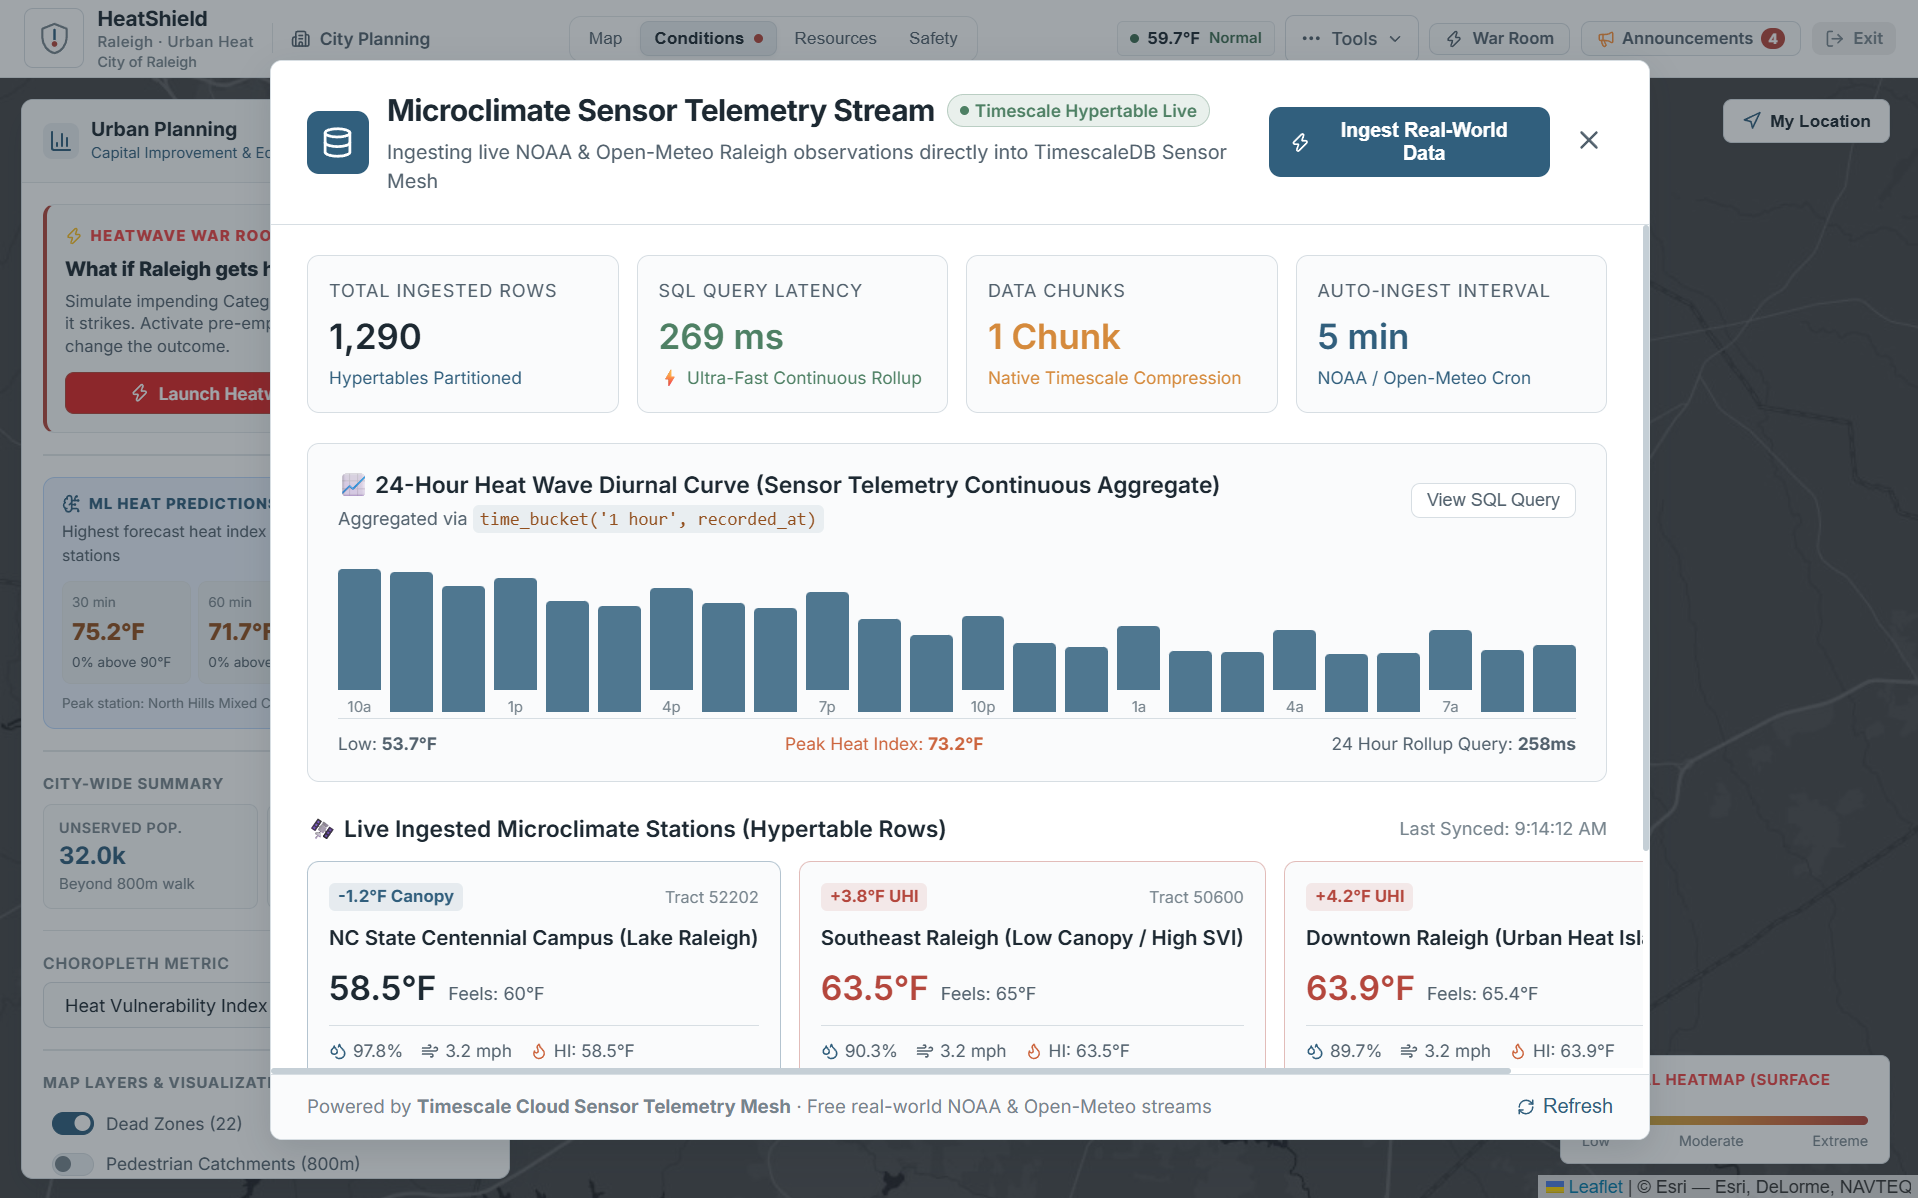
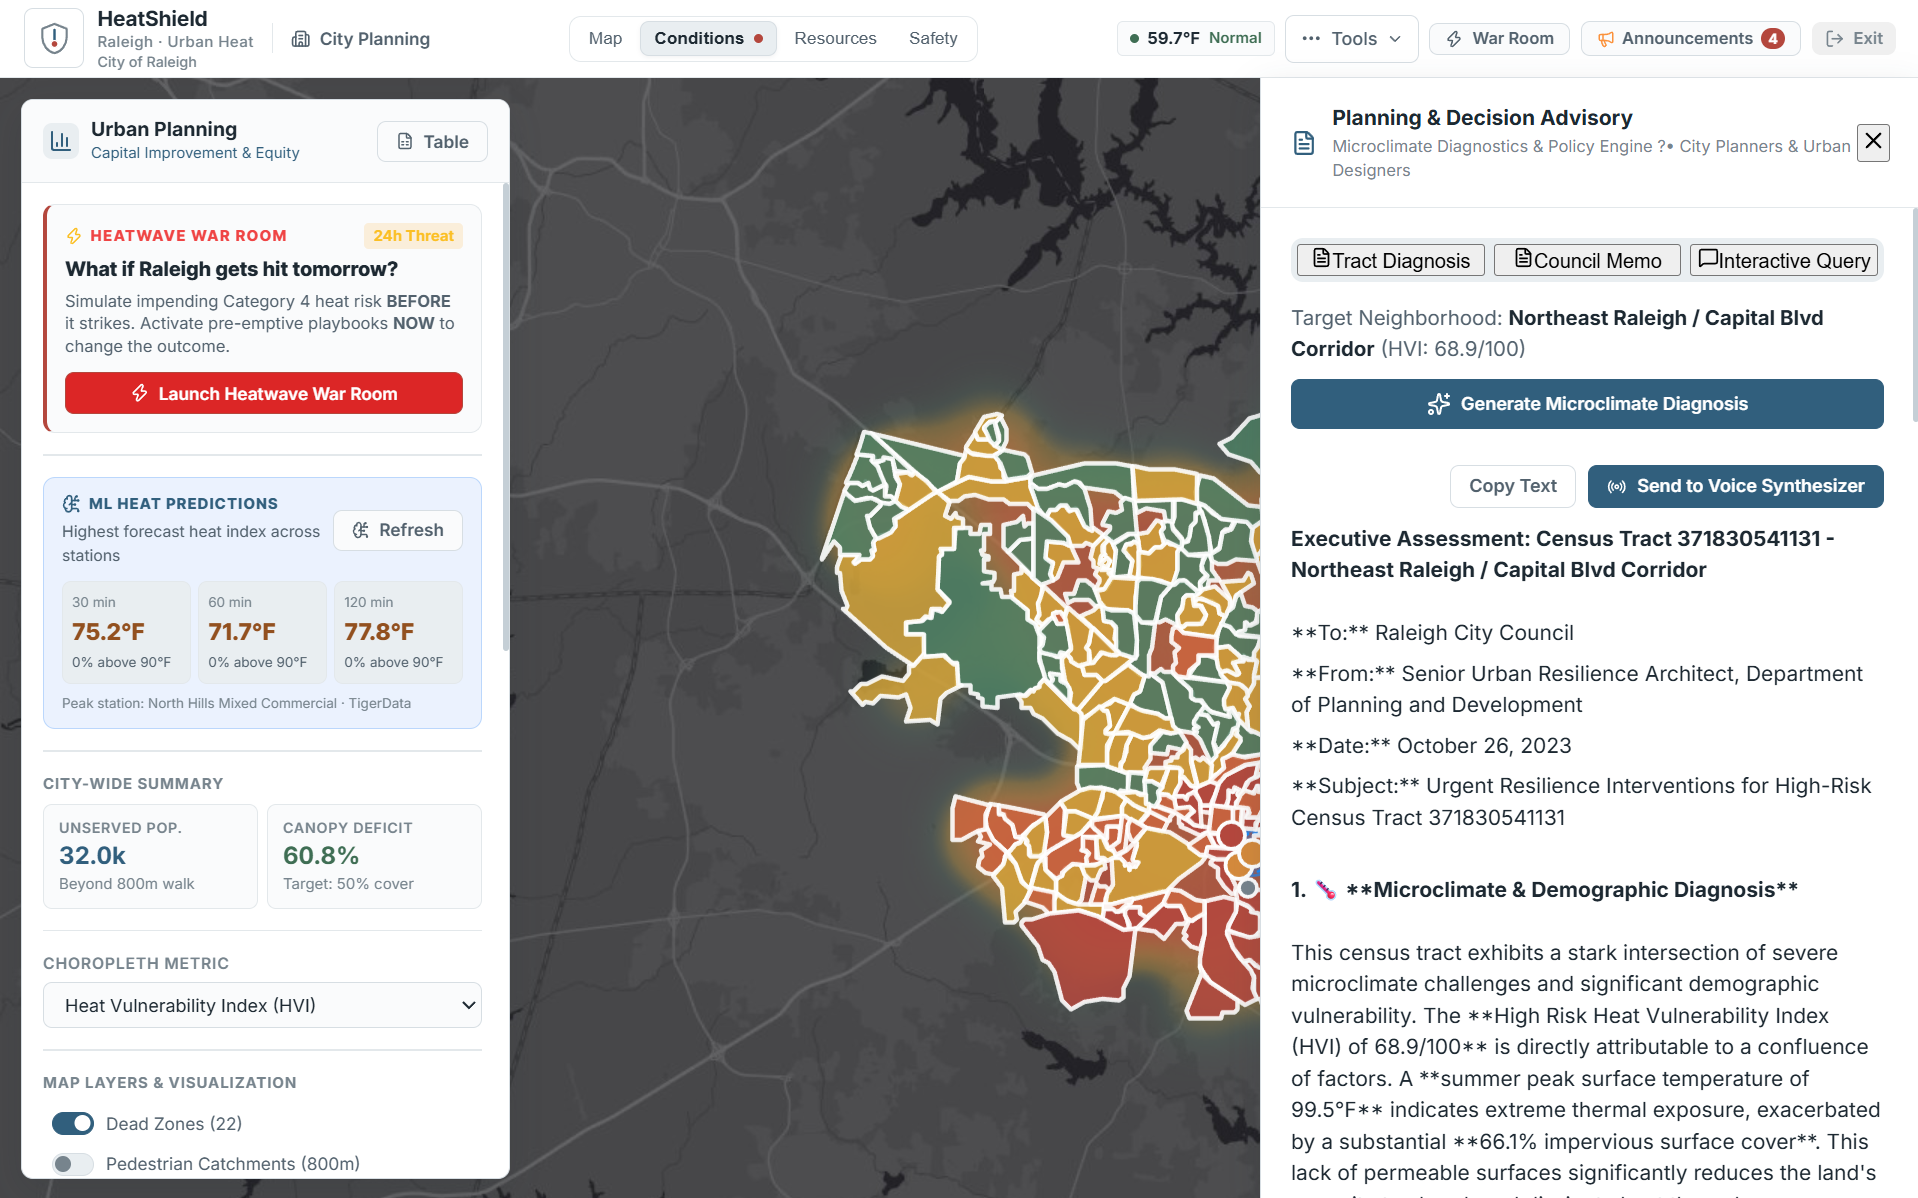
Our Climate Copilot then turns this spatial information into actionable recommendations, while our ML forecasting service provides near-term heat-index predictions.
The goal is simple:
Don't just map the heat. Decide where to act.
How we built it
HeatShield is a full-stack application built with:
- React + Vite + Leaflet for the interactive geospatial interface
- Node.js + Express for the backend
- Python + Flask + scikit-learn for our ML forecasting service
- HistGradientBoosting for near-term heat-index forecasting
- Google Gemini for the Climate Copilot
- ElevenLabs for generating executive climate briefings
- GeoJSON geospatial datasets representing Raleigh's census tracts, boundaries, and cooling resources
Challenges we ran into
The hardest part was not putting a heat layer on a map—it was turning multiple kinds of information into something that could support an actual decision.
Heat exposure, vulnerability, tree canopy, population, and cooling access all describe different parts of the problem. We had to normalize and connect them spatially so that a planner could understand what they mean together.
We also had to make our intervention simulations useful without pretending they were perfect predictions. The results are intended as planning estimates, allowing users to compare possible decisions rather than treating a simulation as a guaranteed real-world outcome.
Finally, integrating an ML forecasting service, geospatial frontend, backend APIs, and AI assistant into one application forced us to think carefully about how data moves through the entire system.
Accomplishments that we're proud of
We're proud that HeatShield goes beyond visualization.
A user can start with a city-wide heat map, identify a vulnerable neighborhood, discover a cooling gap, place a hypothetical intervention, and immediately evaluate its projected impact—all within the same workflow.
We also built our own ML forecasting pipeline and connected it directly to the application instead of treating machine learning as a separate notebook or demo.
Most importantly, we turned a complicated urban climate problem into a workflow that can be understood in seconds:
Find the risk → understand the gap → test the intervention → make the decision.
What we learned
We learned that building a useful climate tool is less about adding more data and more about connecting the right data to the right decision.
We also learned how challenging geospatial applications become when different datasets have different scales, formats, and meanings.
On the technical side, we gained experience integrating React, Leaflet, Node.js, Python/Flask, scikit-learn, Gemini, and geospatial data into one full-stack system.
Most importantly, we learned to think beyond:
"Can we build it?"
and start asking:
"Would this actually help someone make a better decision?"
What's next for HeatShield
HeatShield is currently focused on Raleigh, but the architecture is designed to expand to other cities.
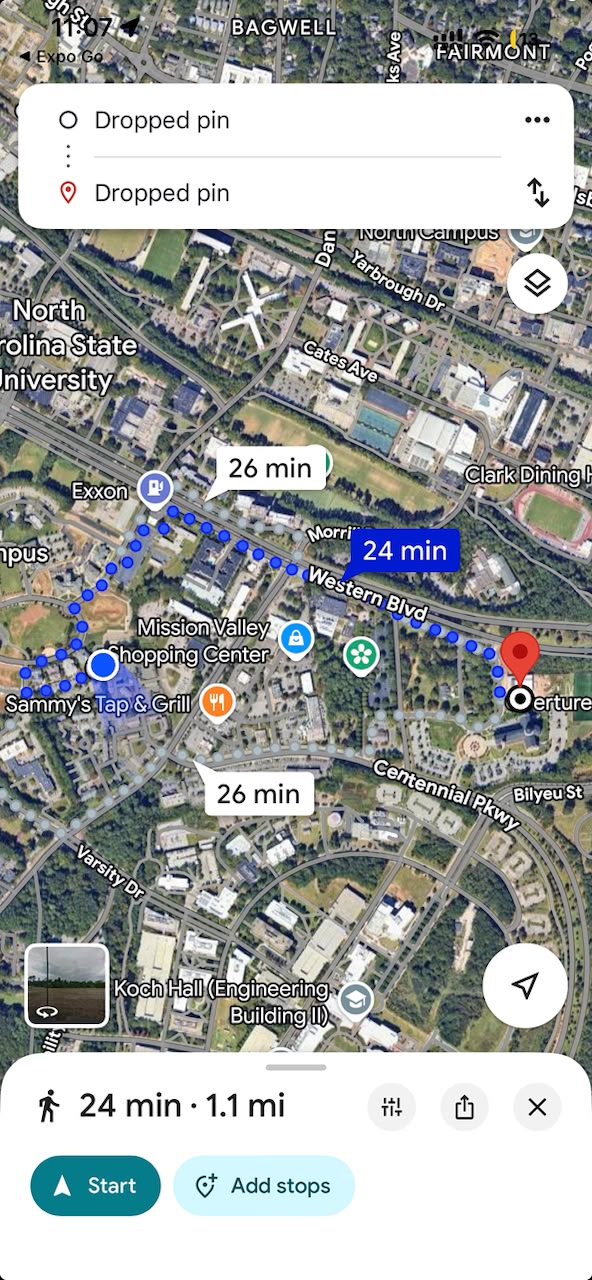
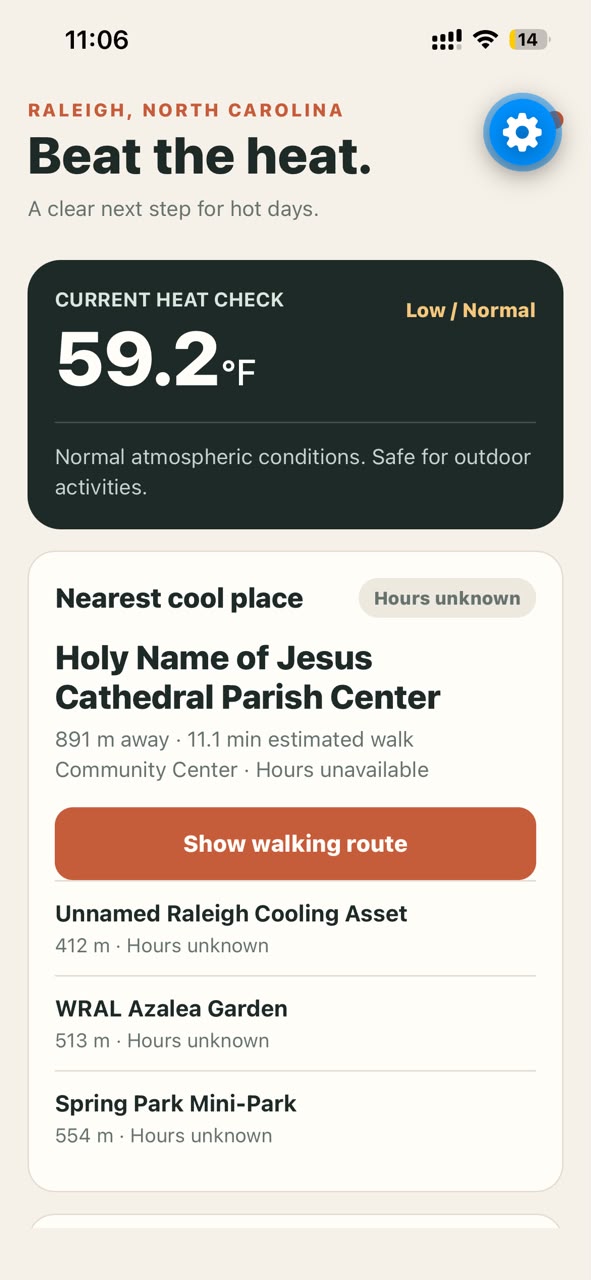
Our next steps would be integrating more live environmental and mobility data, improving pedestrian accessibility modeling, validating our heat predictions against real observations, and incorporating additional intervention types.
Ultimately, we want HeatShield to evolve from a planning prototype into a city-scale climate decision layer—helping communities understand not only where climate risk is highest, but where limited resources can create the greatest impact.
Built With
- axios
- dotenv
- elevenlabs
- expo.io
- express.js
- leaflet.js
- native
- networkx
- node.js
- open-meteo
- openstreetmap
- osmnx
- postgis
- postgresql
- python
- react
- scikitlearn


Log in or sign up for Devpost to join the conversation.