Inspiration
Data centers turn almost every watt they draw into heat, around the clock, and then spend more energy and water getting rid of it. Cooling can take up to about 40% of a data center's energy, and nearly all the rest ends up as heat too. Meanwhile the buildings next door (apartments, hotels, hospitals, offices) burn gas, oil or Con Ed steam to make heat and hot water.
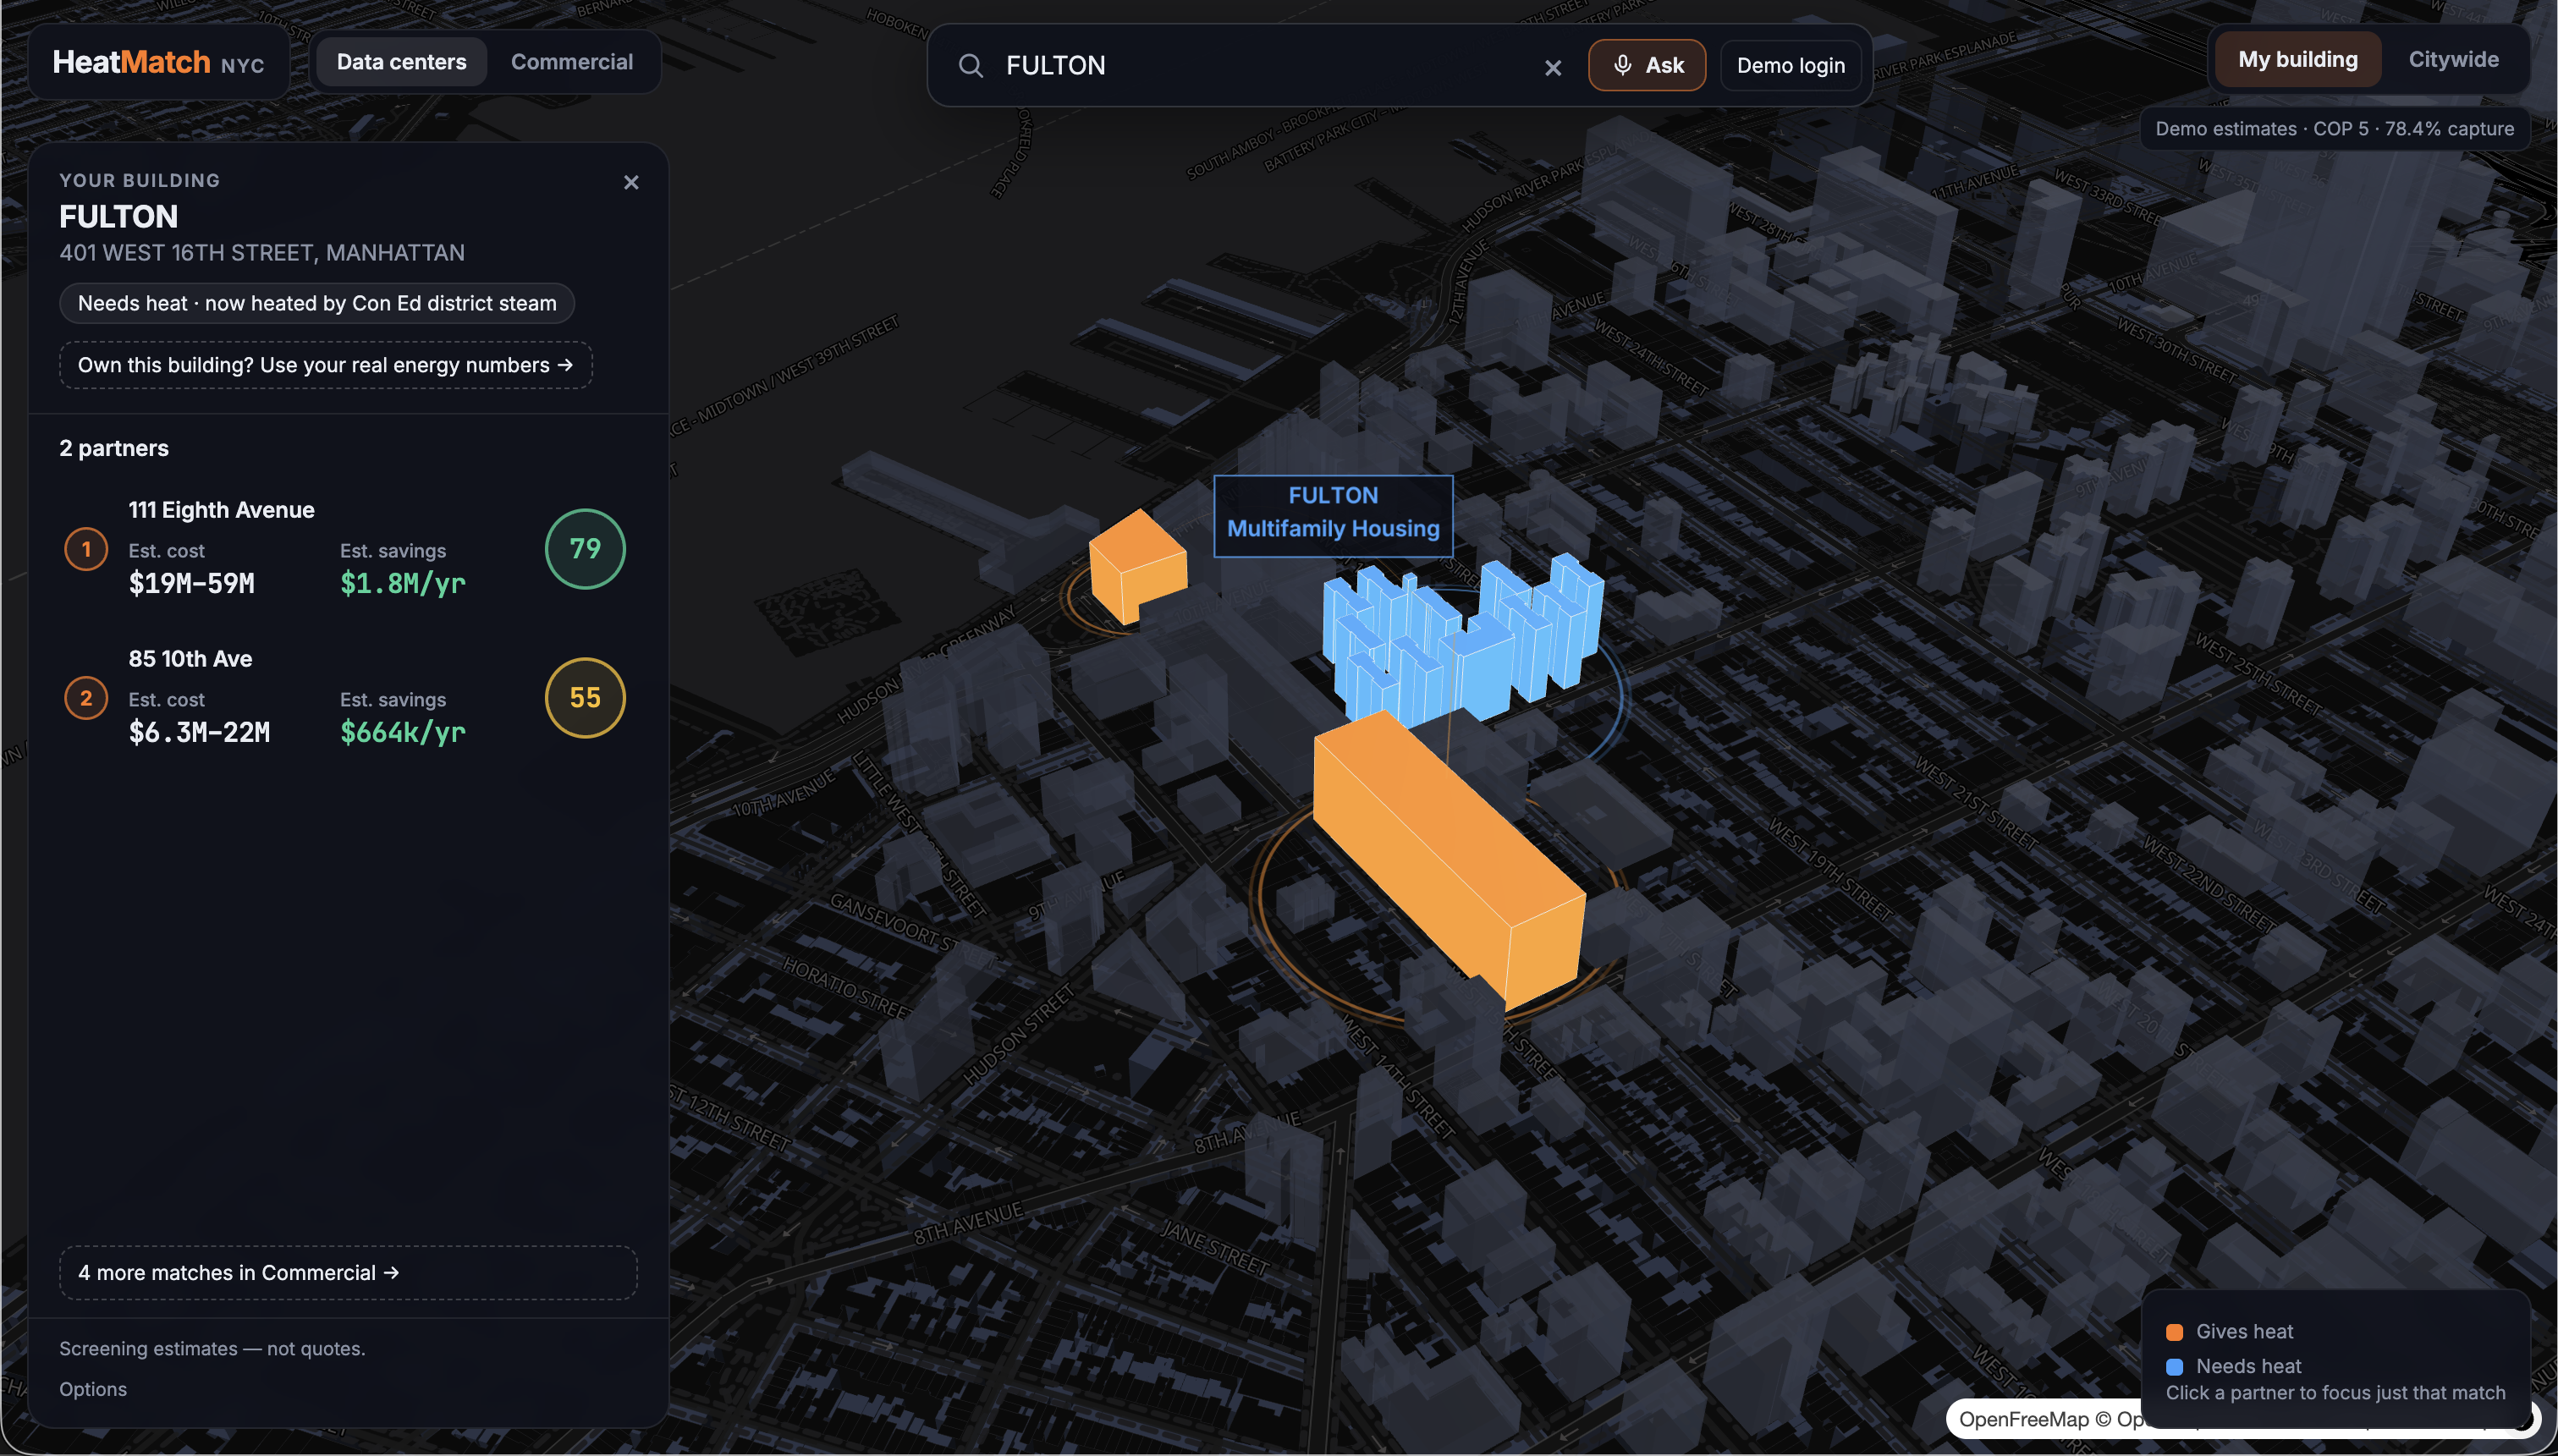
We started from an EESI article on thermal energy networks, which showed this already works in Stockholm, Helsinki, Dublin and Paris. Then Con Edison's proposed Chelsea pilot, which would send heat from a data-center building to NYCHA's Fulton Houses, showed us a real version of that link in New York City. That raised our question: using only public data, could we find every other match like it?
What it does
HeatMatch finds NYC data centers and the buildings next to them that could use their waste heat. For each possible pair, it checks that:
- the buildings are close (within 150 m, wall to wall);
- the heat is there in the hours it's needed;
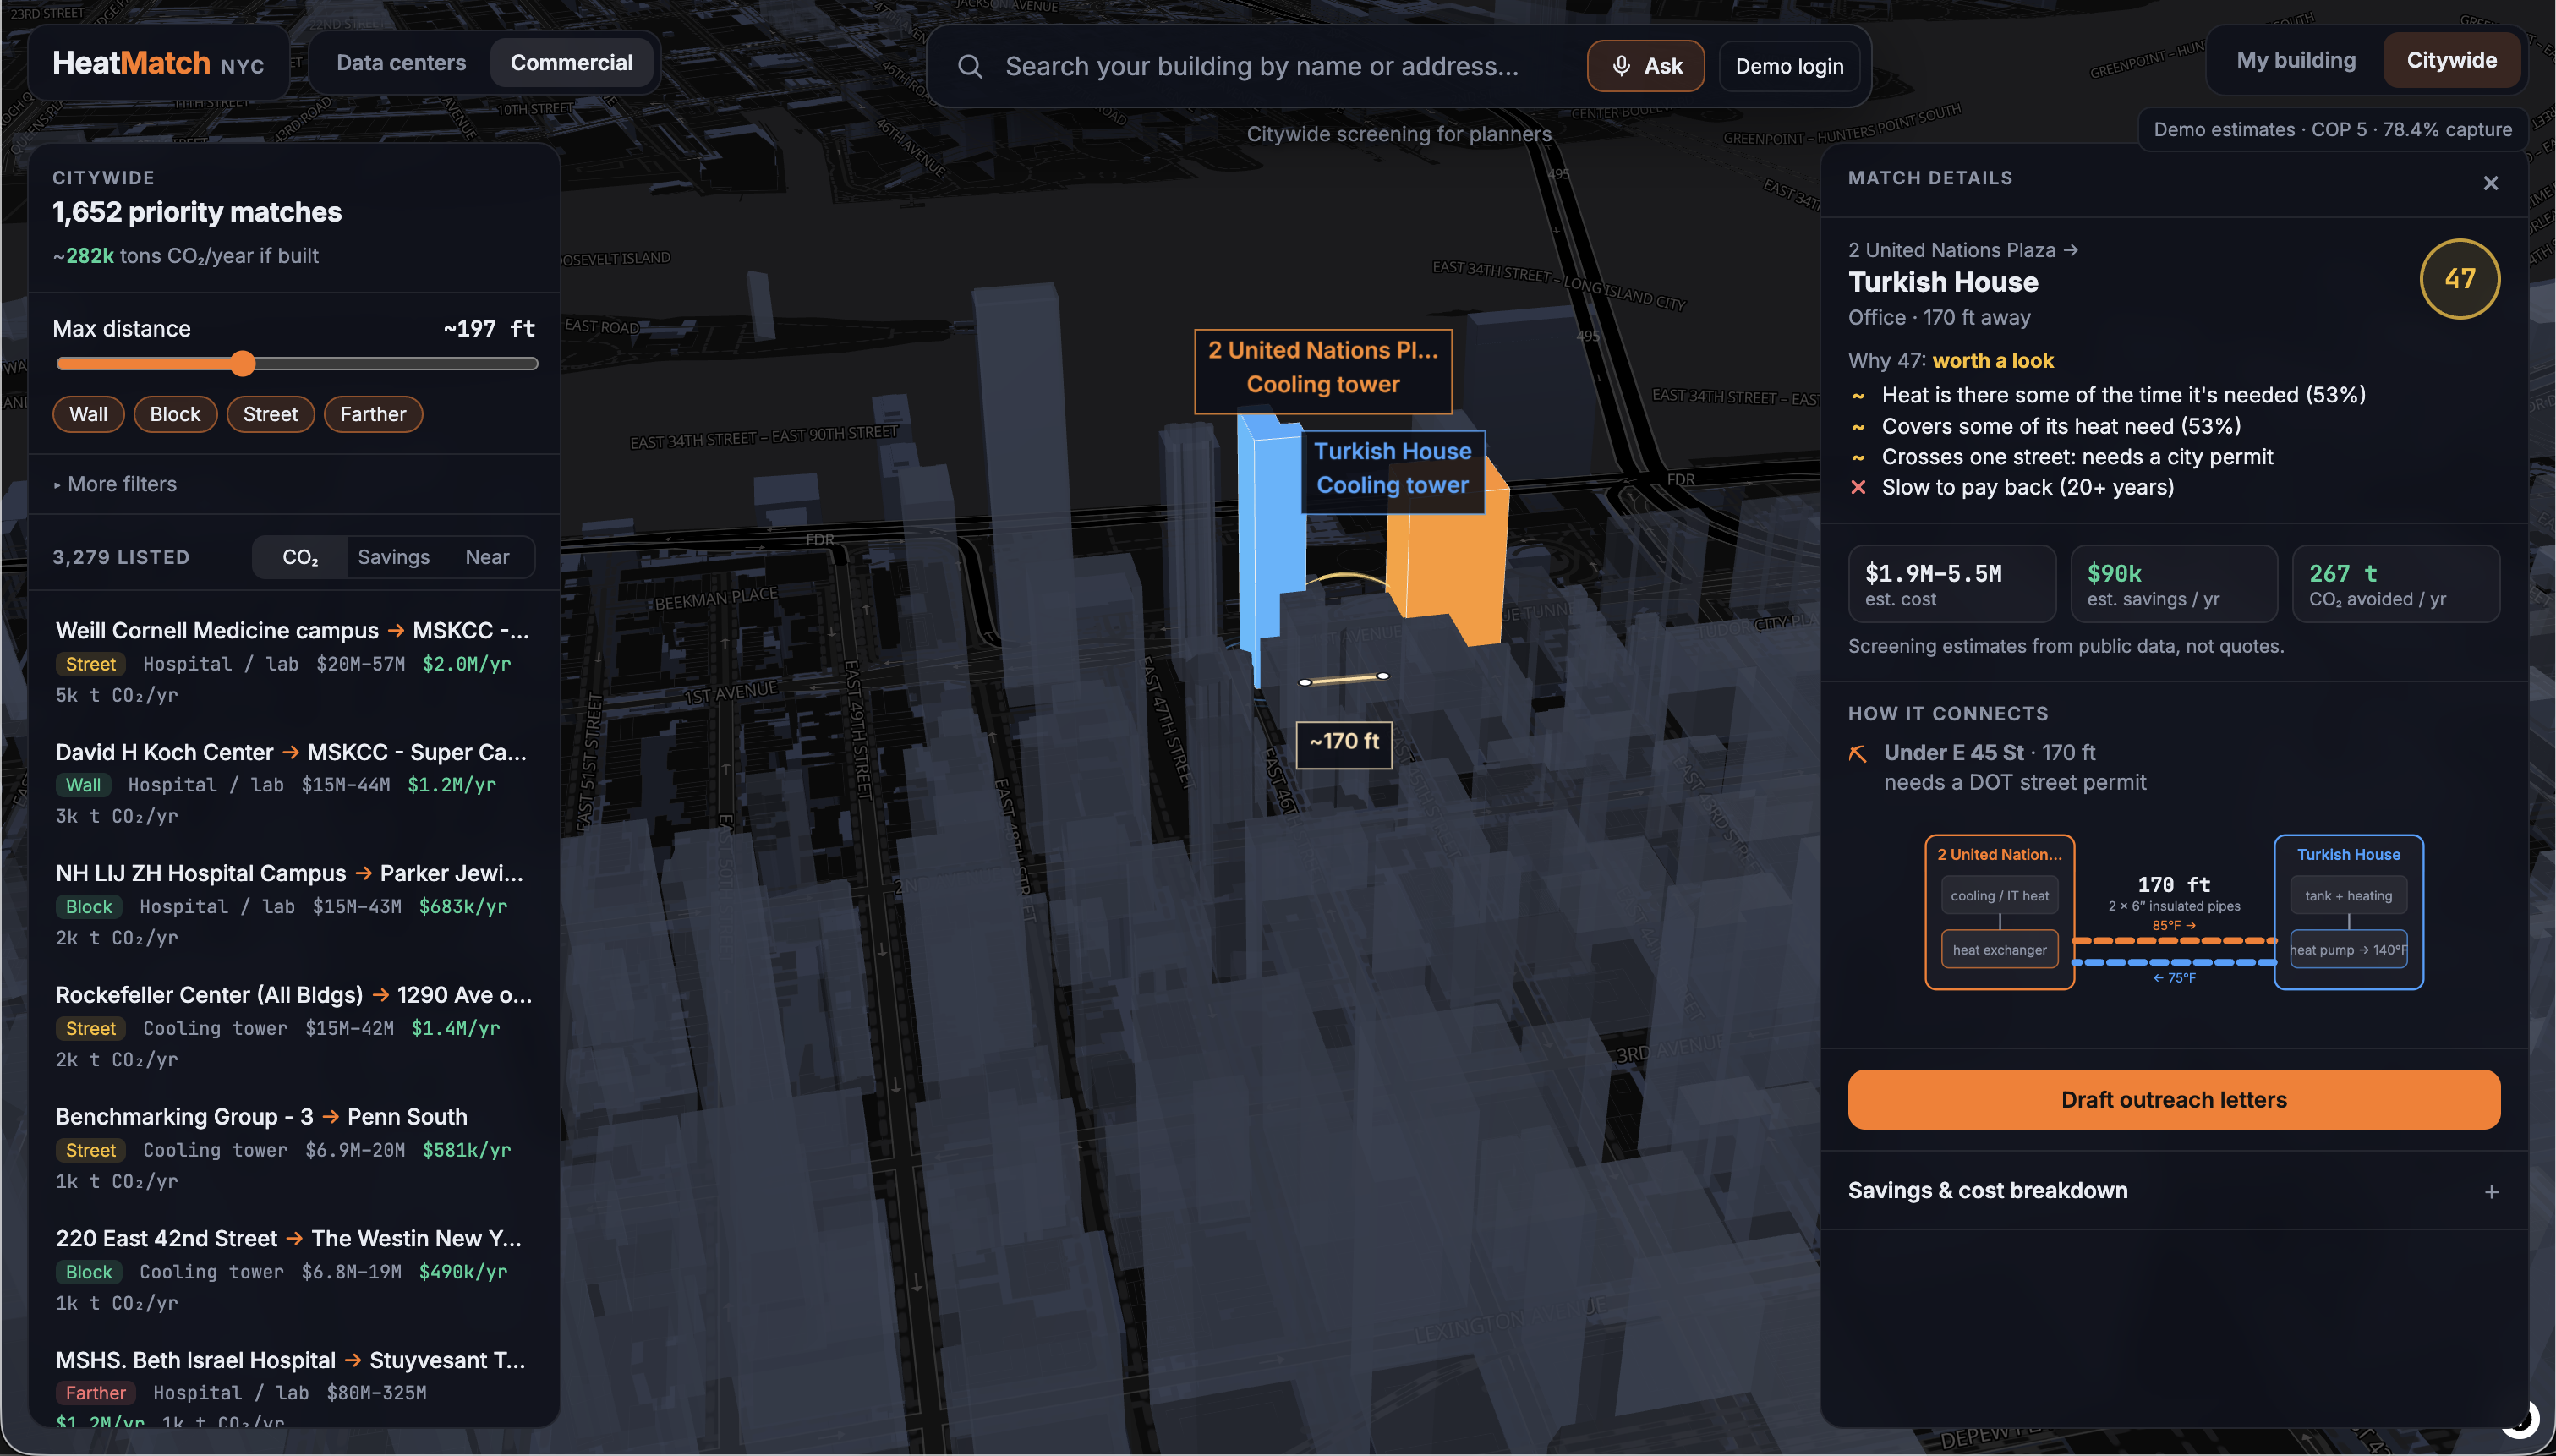
- the pipe route is realistic, including which public streets it must cross;
- the link makes financial sense, with a low/base/high installed-cost range and estimated yearly savings.
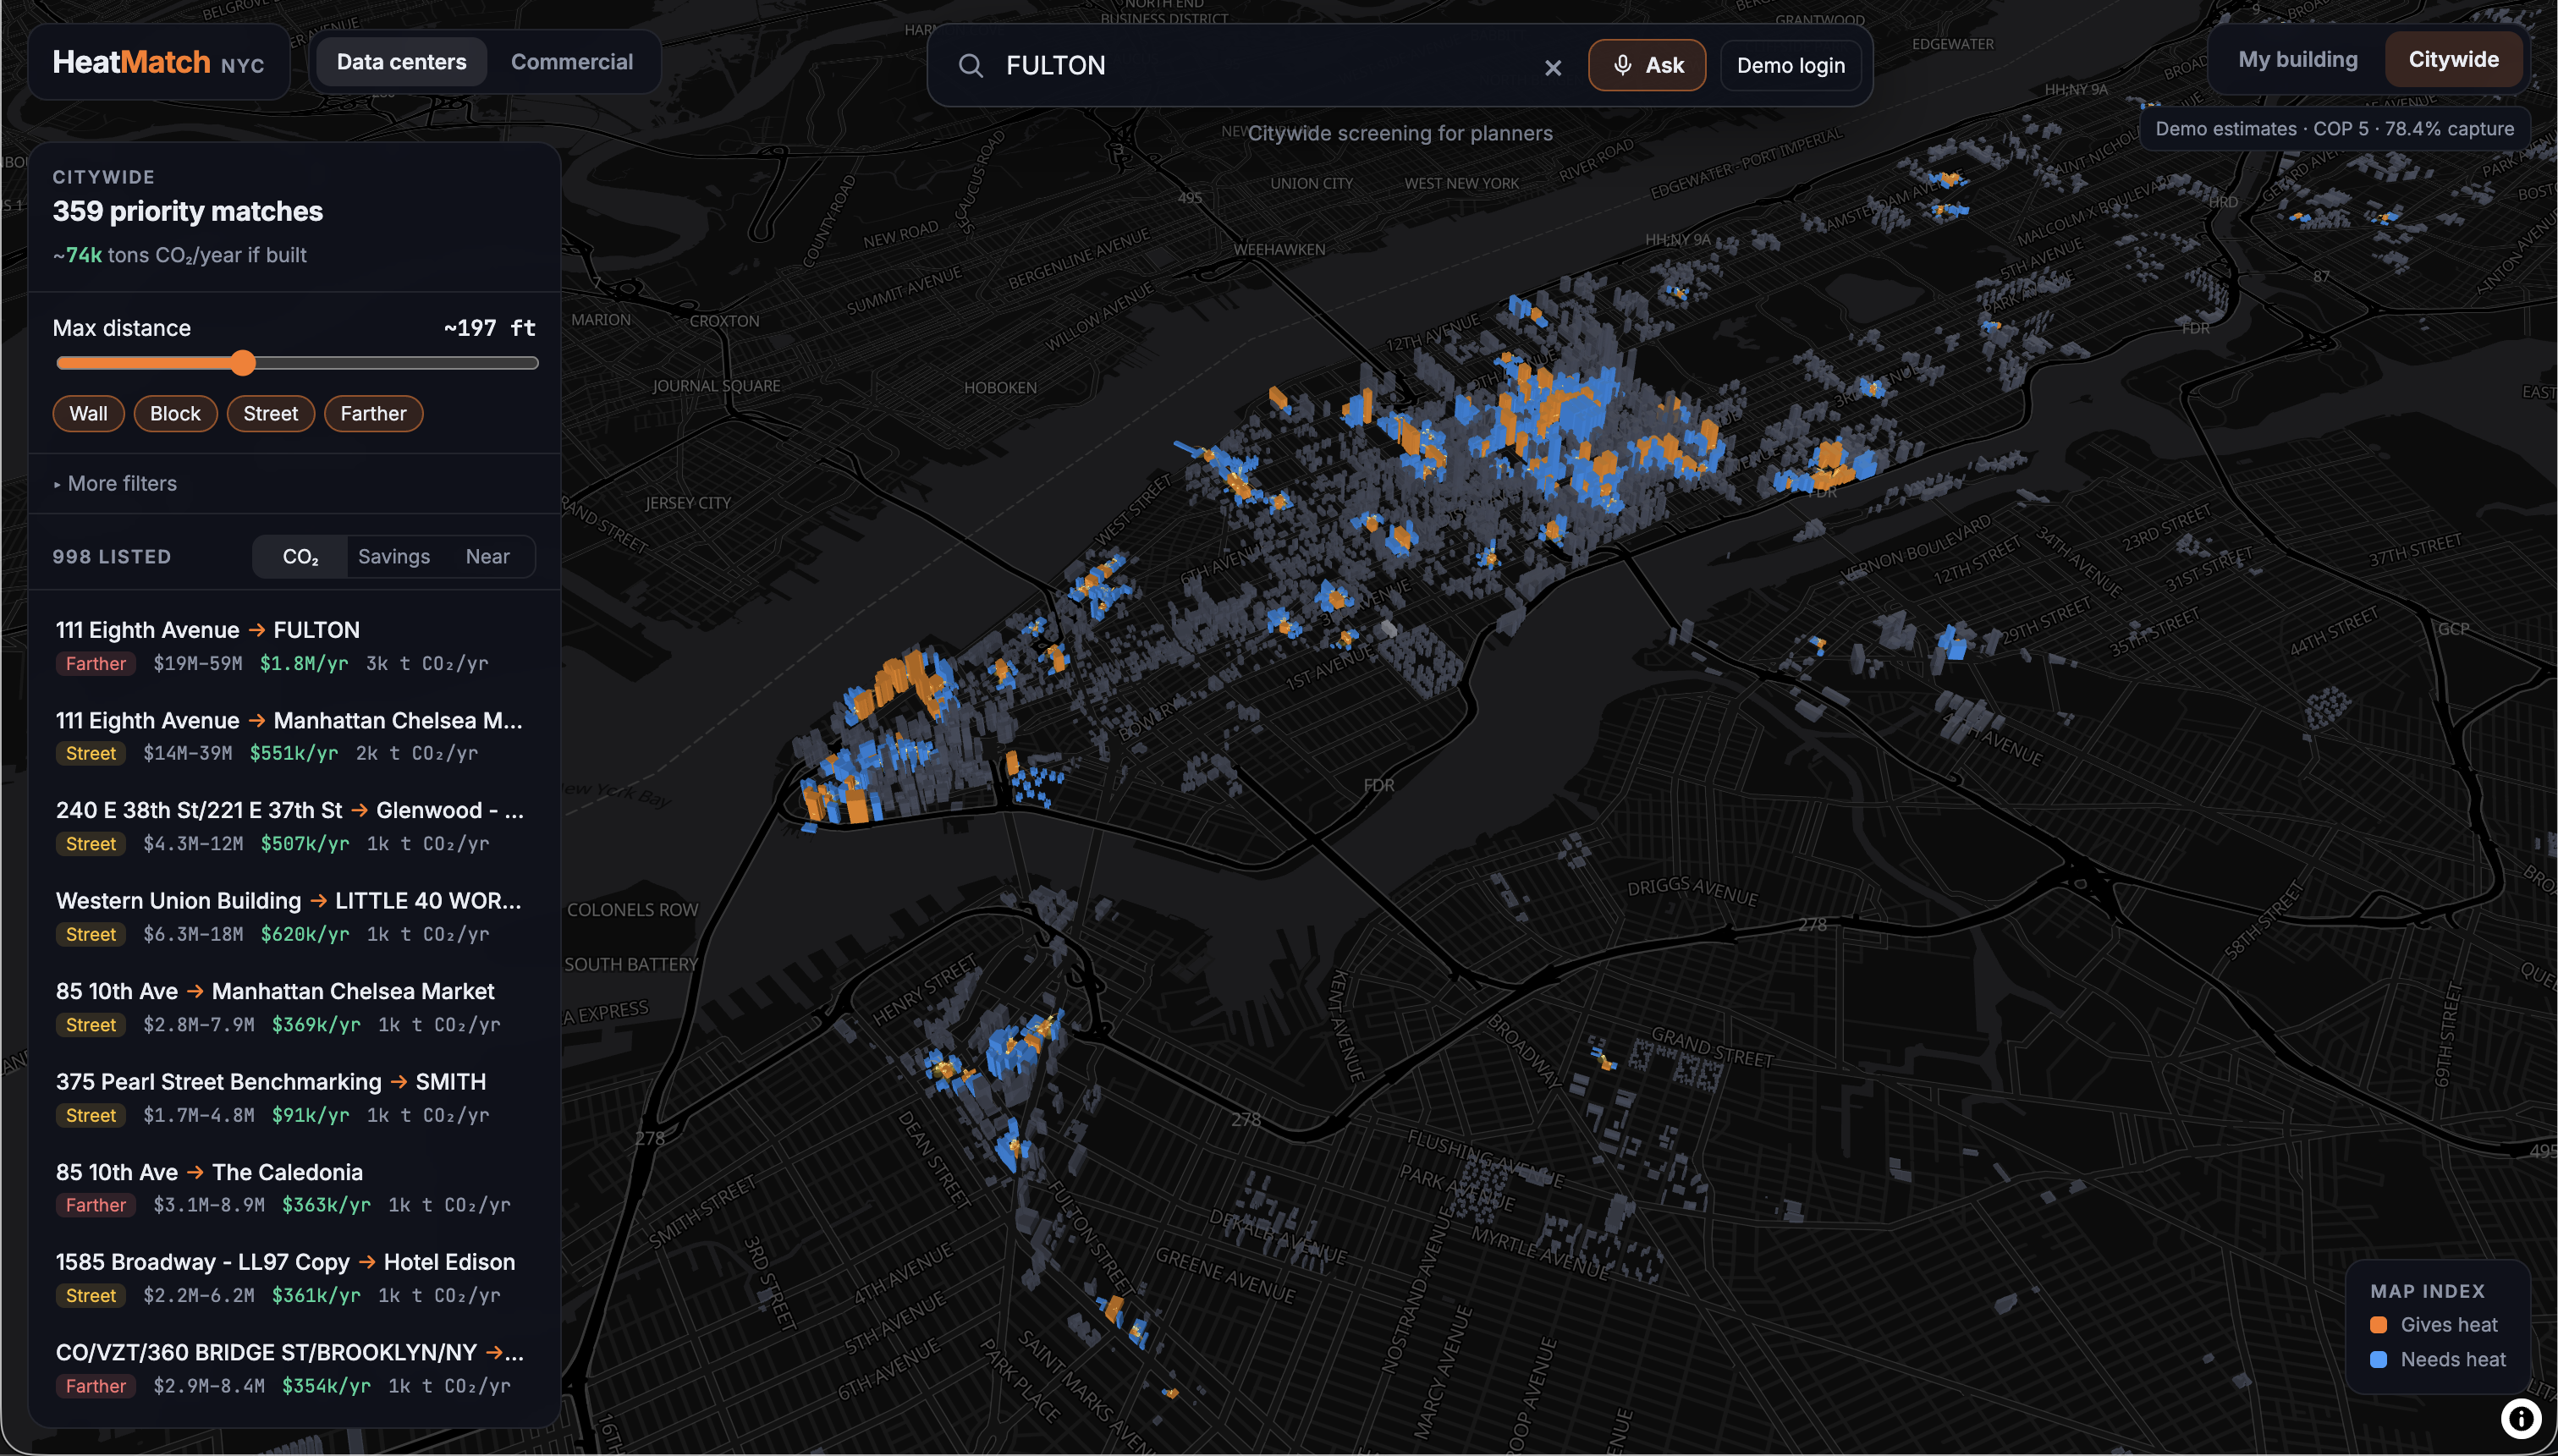
The app has two tabs. The Data centers tab is the main product: 170 NYC data centers (16 with a measured IT load reported under Local Law 84), 160 of which have at least one heat user within 150 m, for 3,231 pairs with 2,073 neighboring buildings. A second Commercial tab covers supermarkets, refrigerated warehouses, hospitals and cooling-tower buildings, whose heat is modeled from assumed cooling and refrigeration loads, since those aren't metered publicly.
Every partner gets a match score from 0 to 100: 30% timing fit (does the heat line up hour by hour), 30% coverage (how much of the neighbor's heat need it meets), 20% how easy the pipe route is, and 20% payback. Each score shows the four reasons behind it. Under "More filters", HeatMatch can also search for heat loops of 3 to 6 buildings, where one source feeds several neighbors through a chain of short pipes.
For owners, HeatMatch can:
- replace the public-data model with their own numbers, typed in or read from an uploaded energy bill in any format (PDF, spreadsheet, CSV or photo);
- take a spoken or typed request such as "I run the data center at 111 Eighth Avenue, find hotels within a block, cheapest first", then follow-ups like "none that cross a street";
- draft an outreach letter to each owner, using only the numbers HeatMatch computed for that link.
How we built it
The data. HeatMatch runs entirely on free public data. A Python pipeline (pandas, NumPy, Shapely, pyproj) pulls NYC's Local Law 84 energy benchmarking (annual and monthly), the cooling tower registry, building footprints, PLUTO owner records, the street centerline file, DOT protected streets and MTA subway lines. From that it identifies 170 data centers as heat sources and about 18,900 buildings as possible heat users: apartments, hotels, dorms, hospitals, schools and offices that buy at least 1 million kBtu a year of gas, oil or steam.
The timing. Public data only tells you how much energy a building uses in a year or a month, but heat reuse depends on when the heat is needed. We used NREL ComStock and ResStock load profiles for the shape of each building's day, and each building's own benchmarking numbers for its size. That gives every building an hour-by-hour profile for the whole year. Data-center heat is nearly flat around the clock, while a neighbor's demand rises and falls with the season and the time of day, so for each pair we simulate how much heat actually lines up hour by hour, with optional 4-hour and 12-hour thermal storage to smooth the gaps.
The pipe route. For every pair we draw the shortest wall-to-wall line between the two footprints and intersect it with the city's street centerlines. Each link then knows which public streets it crosses, how wide they are, whether one was recently repaved (a DOT protected street) and whether a subway line runs underneath. Links are sorted into shared wall, no street to cross, one street, or several streets. Crossing a street costs far more than running a pipe between two buildings, so it gets its own line in the cost breakdown.
The economics. We assume a water-source heat pump lifts the captured heat to about 140°F, and we price each link as a low, base and high installed cost. The pipeline's baseline is a heat pump COP of 3.5 with 70% of rejected heat captured; the web app runs a more optimistic demo setting of COP 5 with 78.4% capture, and we report both. The yearly value is the fuel the neighbor no longer buys, minus the heat pump's electricity, plus the cooling-tower water saved, plus the Local Law 97 carbon penalties avoided at $268 per tonne. NYCHA buildings follow a different rule under that law, so we give them no penalty value. We also total the savings across the whole city without double counting: each building takes only its best source, and no source's heat is used twice.
The web app. The front end is a React and Vite app with deck.gl and MapLibre on an OpenFreeMap basemap. It loads the pipeline's precomputed JSON, and we mirrored the economics in JavaScript, so costs and savings recompute instantly when you change the citywide filters (distance, timing fit, storage) or enter your own numbers. Multi-building loops are searched in the browser from each building's month-by-hour heat grid, and each partner's 0–100 match score is computed there too. An owner's own numbers stay in their browser. An uploaded bill is sent to Claude only to read it, and is deleted right after.
The AI features. A small FastAPI service calls Claude Opus 5.5 for three jobs: reading uploaded bills in any format, turning a spoken or typed request into search filters, and streaming an outreach letter to each owner. We deliberately kept Claude away from the facts. For search and bills it only returns structured JSON (a filter set, or the usage numbers from a bill for the owner to check), and the app runs every search on its own data, so the assistant can't invent a building or a number. Letters may only use the figures the app sends. Voice runs on ElevenLabs: on the hosted site the browser streams the microphone straight to Scribe v2 Realtime with a single-use token from our server, and Flash v2.5 text-to-speech reads answers aloud. Run locally, the server transcribes with faster-whisper or Vosk instead. Without an AI key, the app falls back to keyword search, CSV uploads and template letters. The paid AI routes sit behind a shared demo password, API keys stay on the server, and the site is live at heatmatch.us.
Challenges we ran into
- Public data has gaps. LL84's monthly data publishes gas but leaves electricity blank for 2021 to 2024, and no public source meters hourly use or cooling-tower capacity. We modeled hourly profiles from annual and monthly totals and labeled every estimate.
- Pricing street work. No public source prices NYC street openings per foot. We used published district-energy cost formulas, widened them into low/base/high ranges, and say plainly that concept-stage estimates can be off by −50% to +100%.
- Not fooling ourselves. We excluded pairs on the same campus, lot or owner (and hospital-to-hospital pairs, which are almost always one medical campus), and computed city totals so each building takes only its best source and no source's heat is spent twice.
- Policy detail. NYCHA buildings follow LL97 Article 321 instead of per-tonne penalties, so we gave them no penalty value. That makes the big NYCHA links slower to pay back, and we show that rather than hide it.
Accomplishments that we're proud of
- HeatMatch found Con Edison's Chelsea pilot pair on its own from public data, plus a closer data-center source for the same campus: 111 Eighth Ave, 37 m away. That big link is an estimated $19–59M saving about $1.8M a year, so it takes 10 years or more to pay back, and we show that honestly.
- Of the 1,387 data-center links that cross at most one street, 208 pay back in under 15 years at the base cost estimate with our baseline assumptions, and 406 at the app's demo setting. The citywide data-center portfolio could avoid an estimated 67,000 tCO₂e a year (baseline).
- The best links are small and close. ConEd Irving Place → 145 East 15th St is 19 m across E 15th St, an estimated $1.0–2.9M saving about $246k a year (demo setting).
- Real street crossings, not straight-line distance, drive the cost.
- The whole product runs on free public data, and owners can bring their own bills when they want a sharper answer.
What we learned
- Heat reuse is a timing problem as much as a distance problem. Data-center heat is flat around the clock, while cooling-tower heat fades at night and in winter, so the best partners are the ones whose demand lines up hour by hour.
- The street is the real cost. Distance alone badly misjudges a link.
- In NYC, at our baseline heat-pump efficiency, the heat pump's electricity can cost more than the gas it replaces, so for gas-heated neighbors much of the savings comes from avoided LL97 penalties. Policy shapes the business case as much as physics does.
What's next for HeatMatch
- An equity layer. Flag "thermal deserts" where heat-reuse potential and energy burden are both high and no project is planned, and weight rankings toward public housing, schools and community buildings so savings reach the people who need them most.
- Better routing. Replace the straight-line pipe route with routes along the actual street network.
- More cities. Bring the same method to any city that publishes building energy benchmarking data.
- From screening to action. Hand shortlisted links to utilities and engineers for feasibility studies.
Built With
- deck.gl
- fastapi
- javascript
- maplibre-gl
- numpy
- nyc-open-data
- openstreetmap
- pandas
- pyproj
- python
- react
- react-map-gl
- shapely
- uvicorn
- vite
