-
-
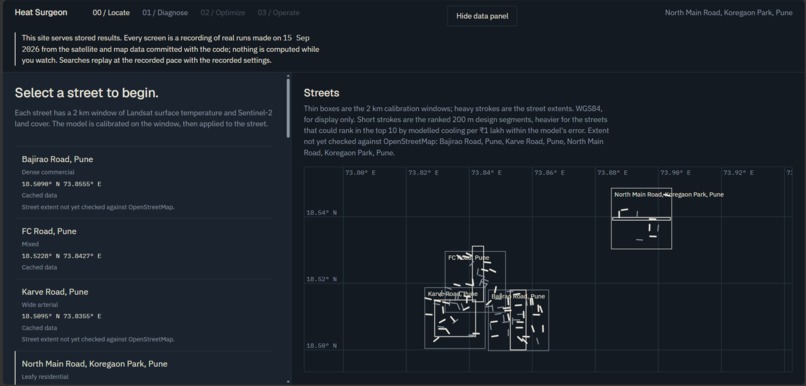
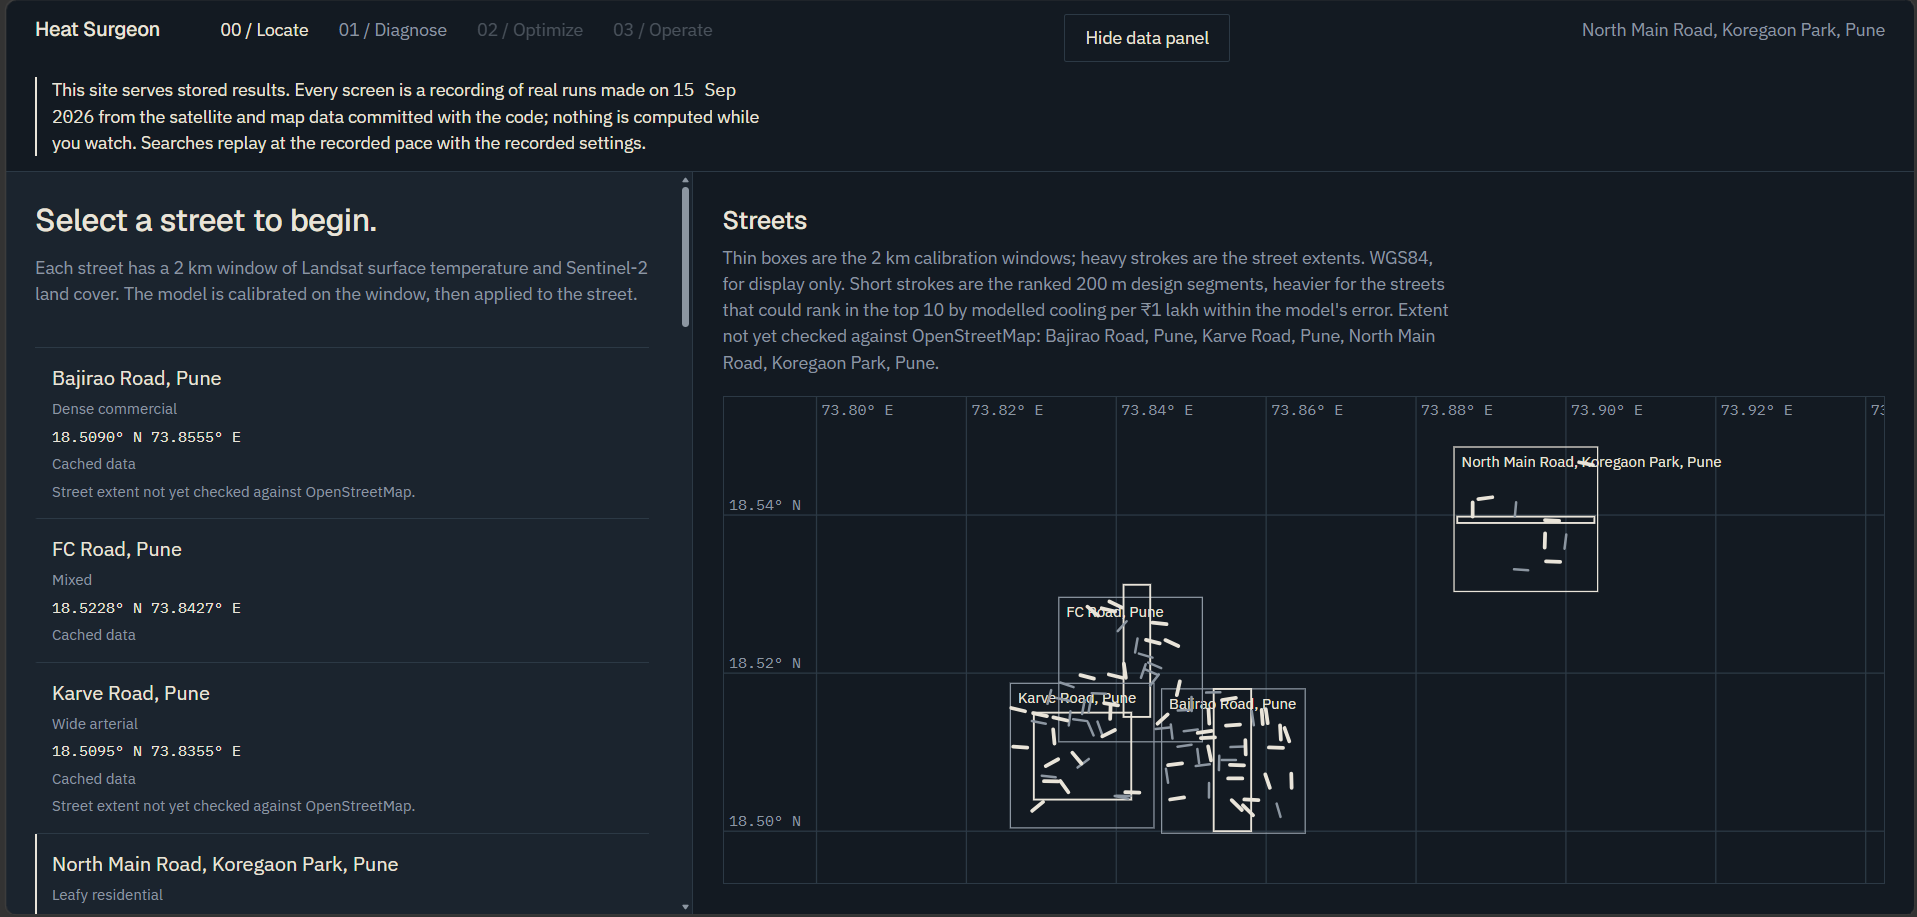
Stage 00, Locate. Four cached Pune streets with distinct heat profiles, plus 2 km calibration windows and ranked 200 m design segments.
-
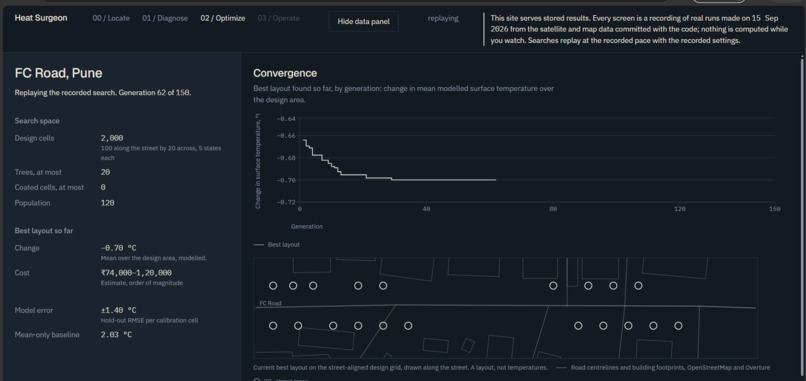
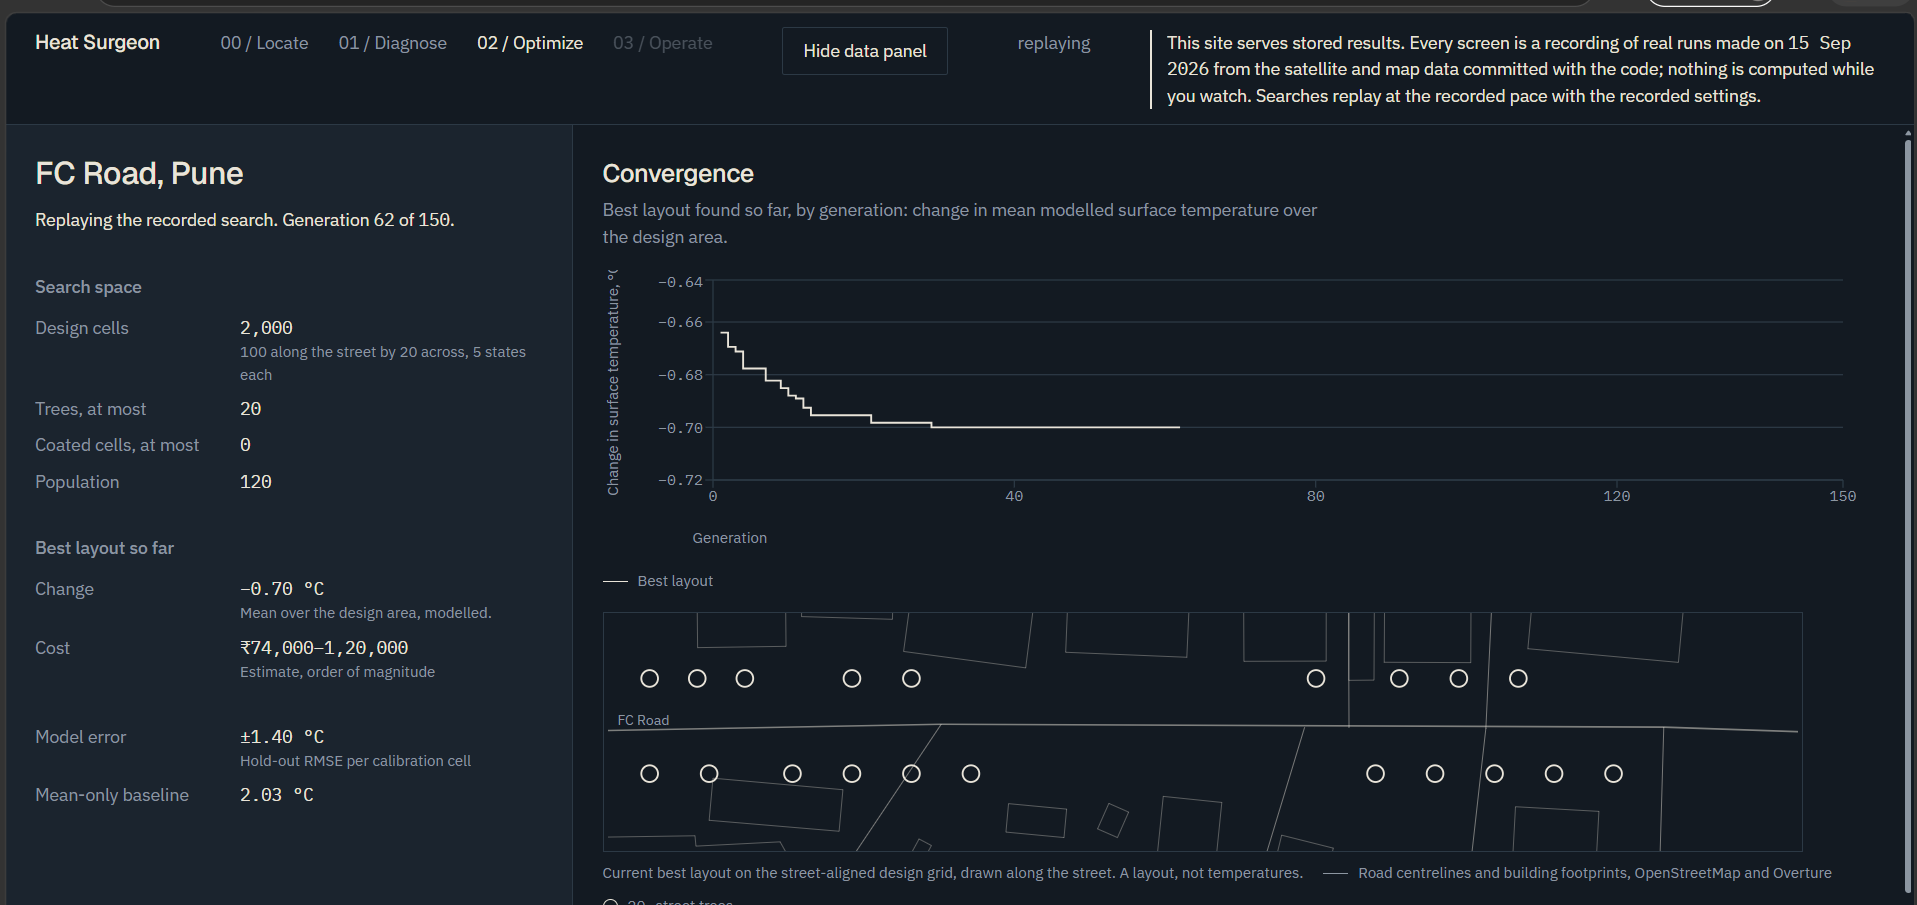
Stage 02, Optimize. Live WebSocket convergence curve at generation 62/150, alongside hold-out error and the mean-only baseline.
-
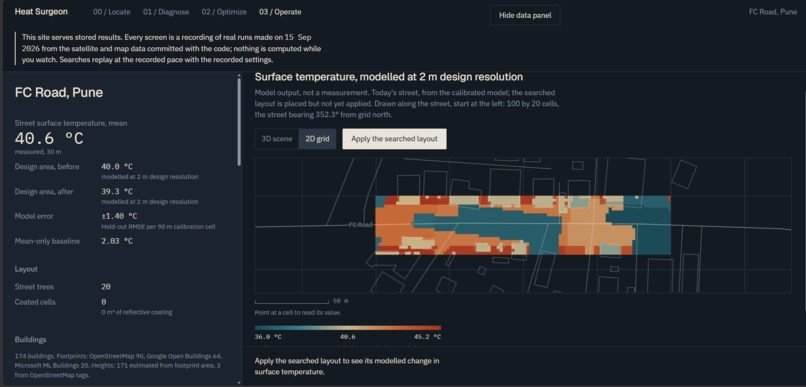
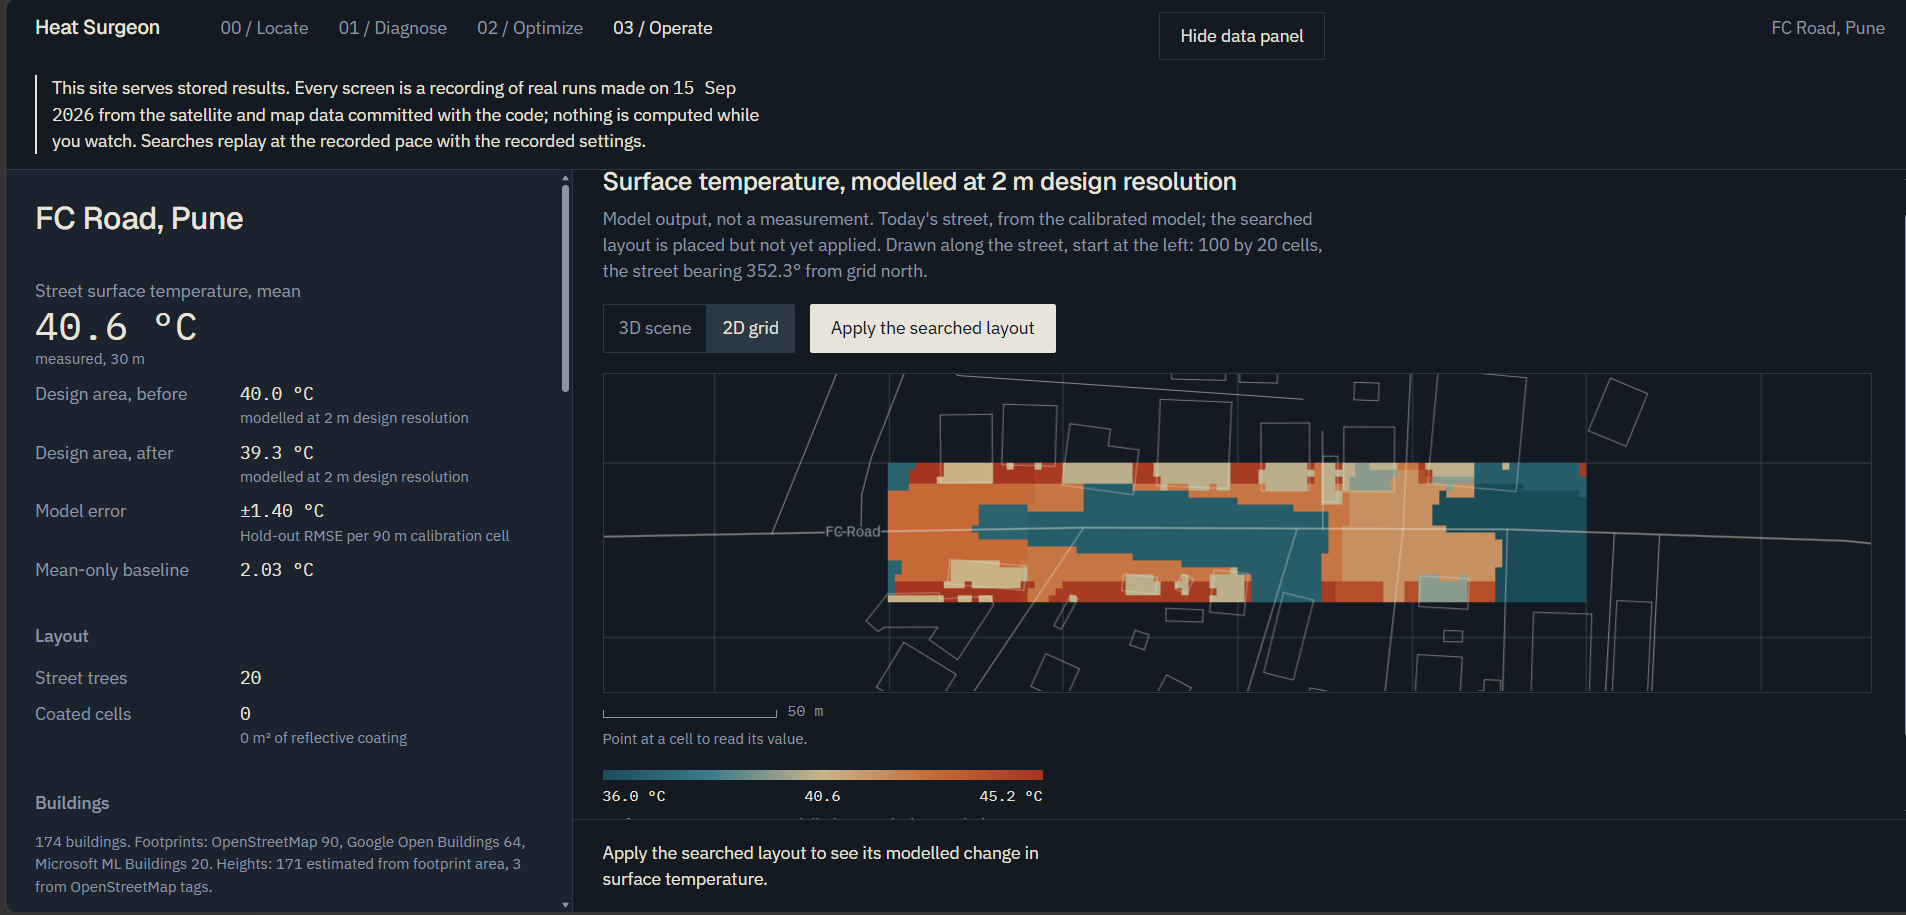
Stage 03, Operate. 2D before-state grid along the street, labelled as a 2 m-resolution model output, not a measurement.
-
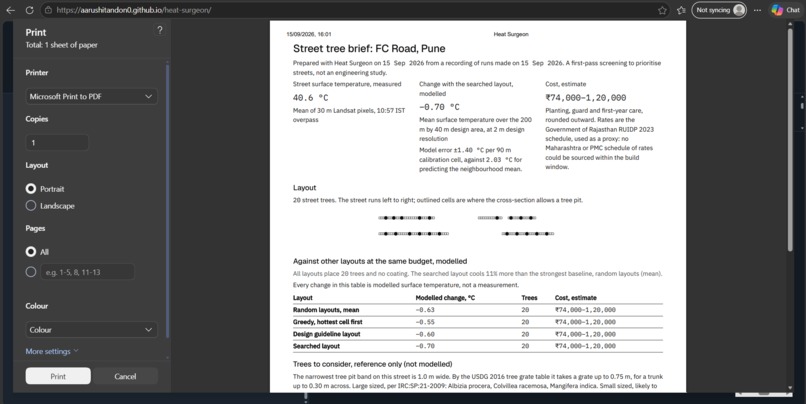
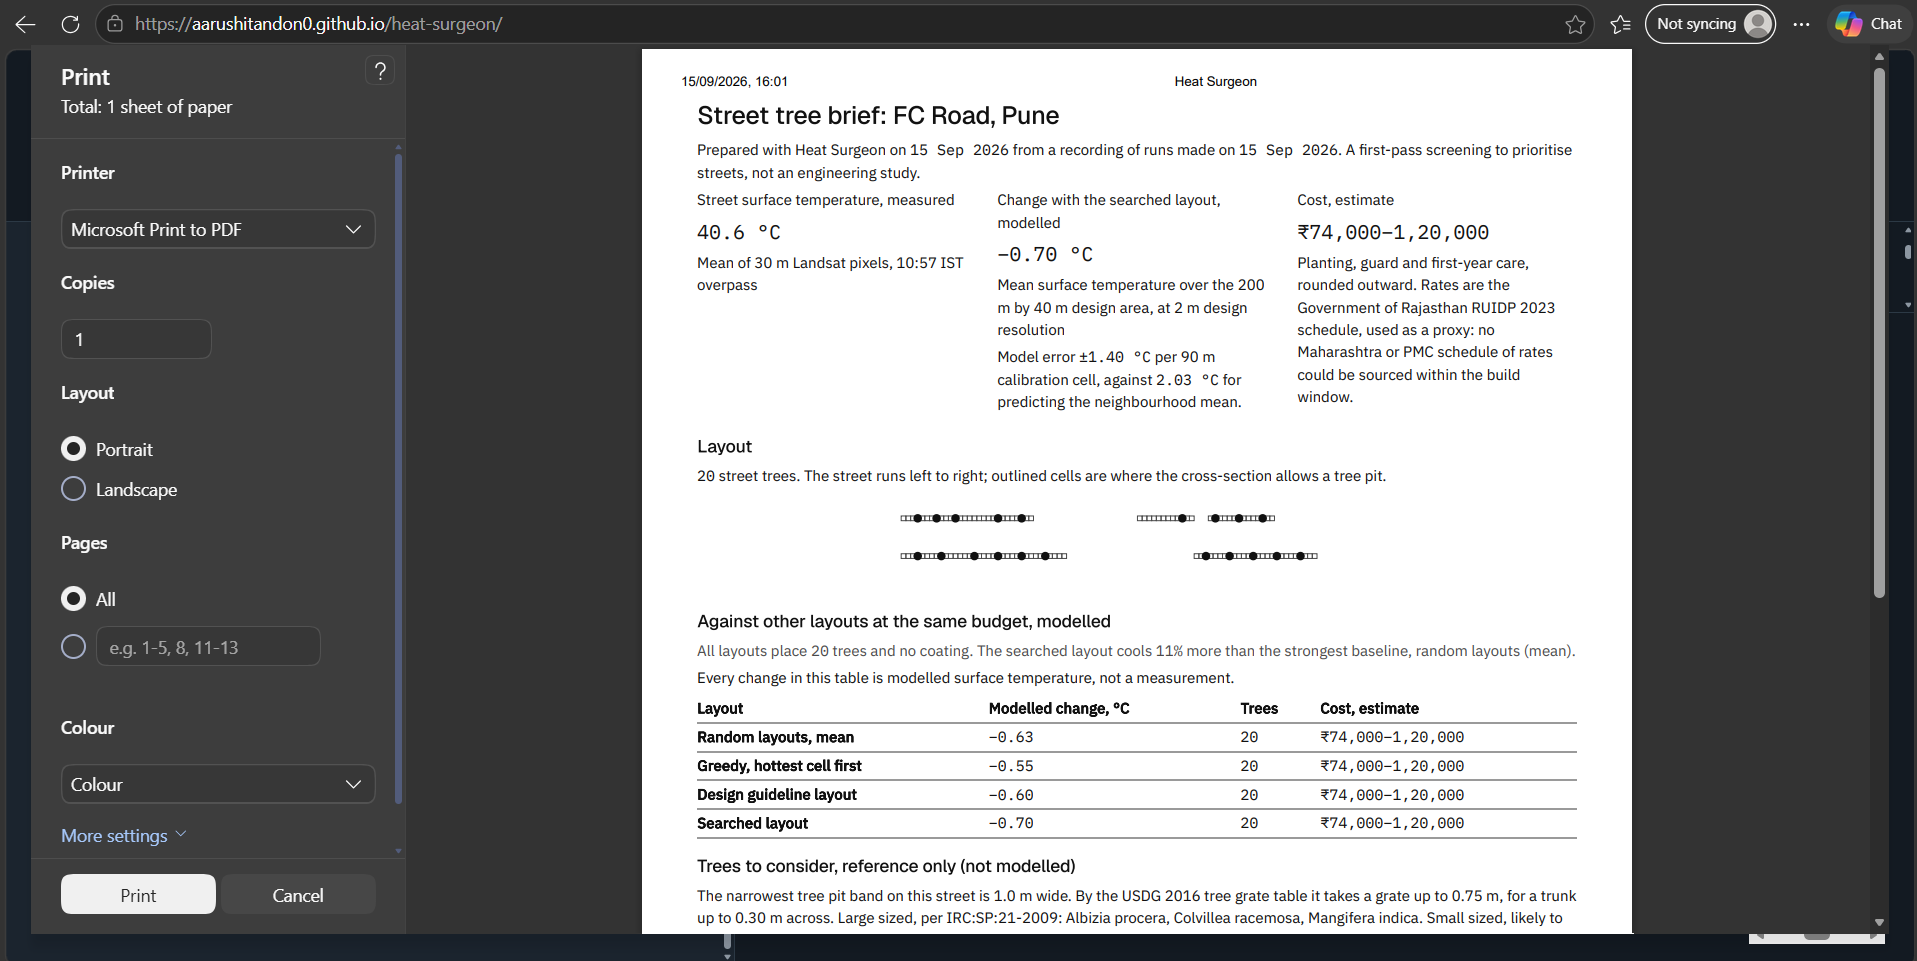
The printed brief: One-page ward-office summary: measured temperature, modelled change, error, cost, layout, four baselines, tree reference.
-
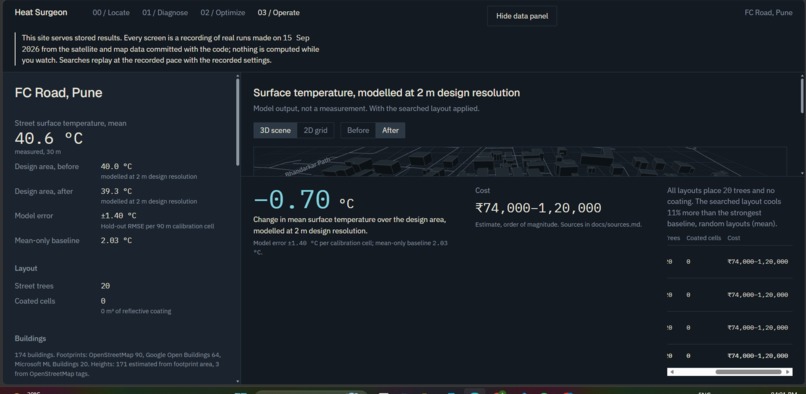
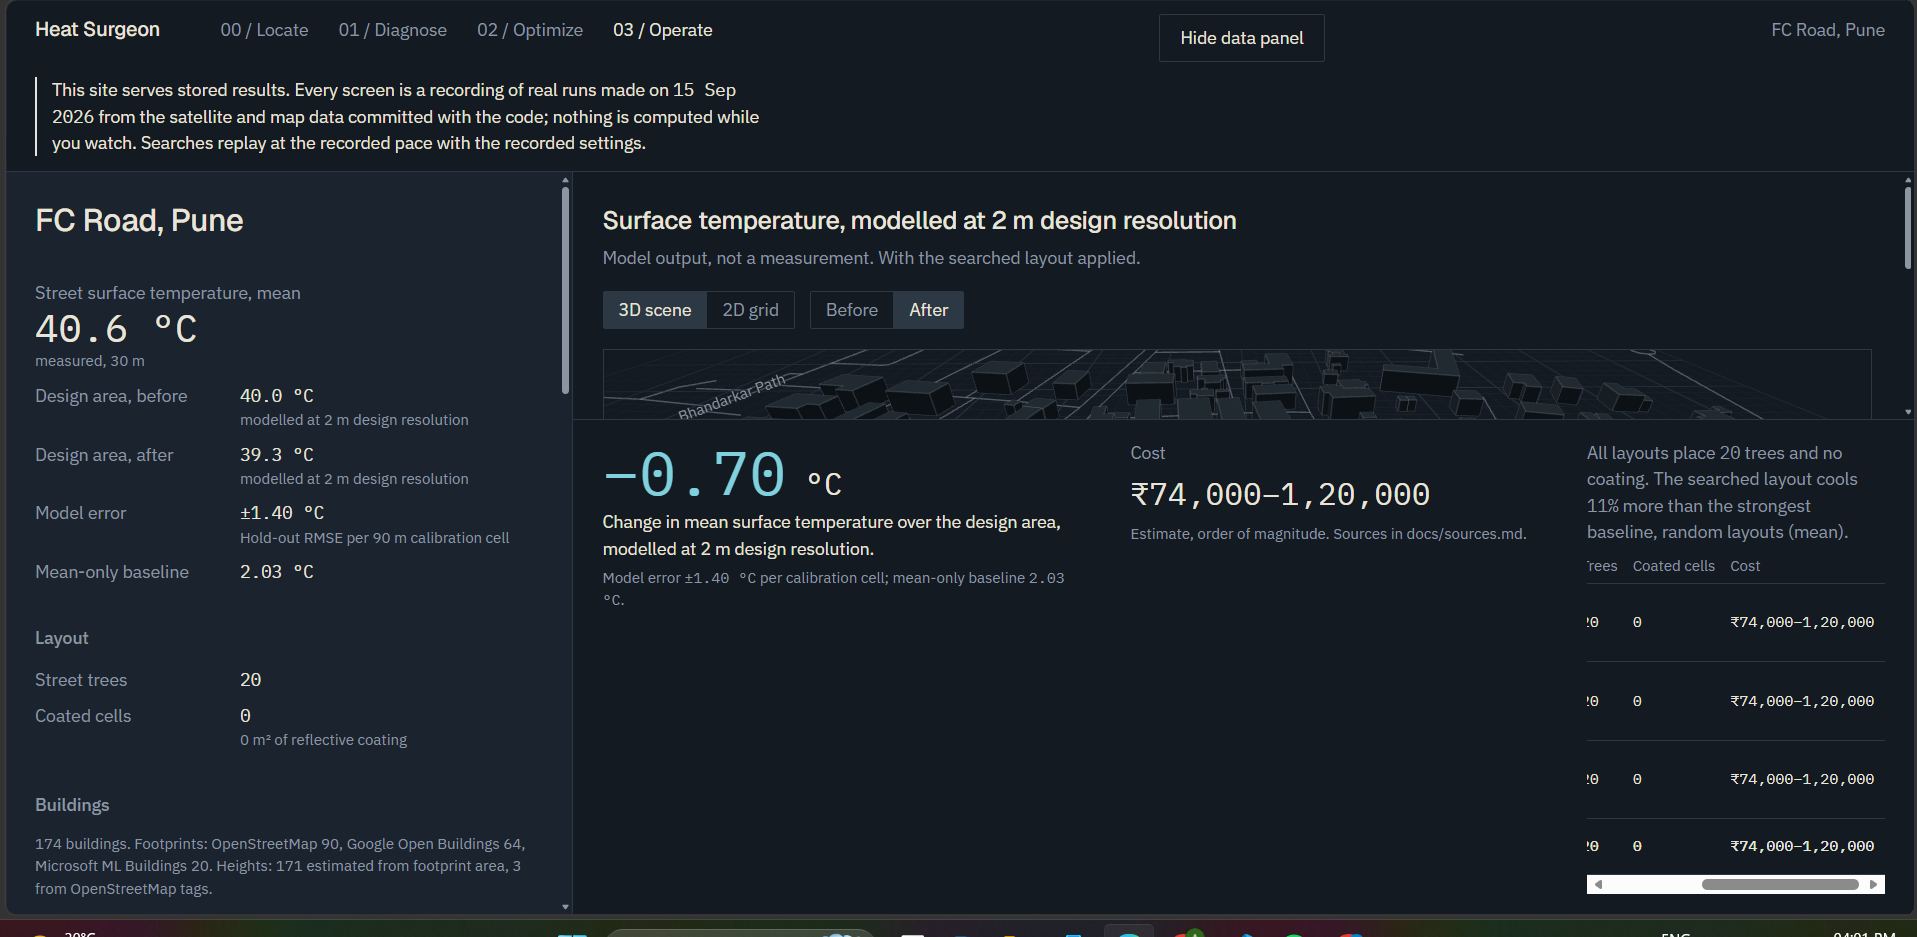
Stage 03, Operate. After reveal: −0.70 °C over the design area, ₹74,000–1,20,000 estimated, with four 20-tree comparison arms.
-
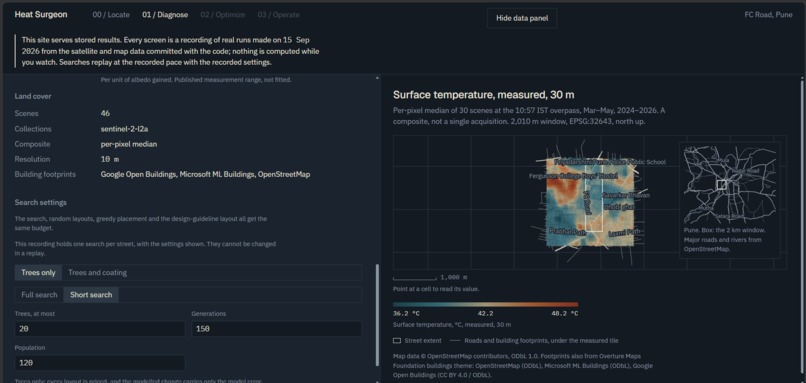
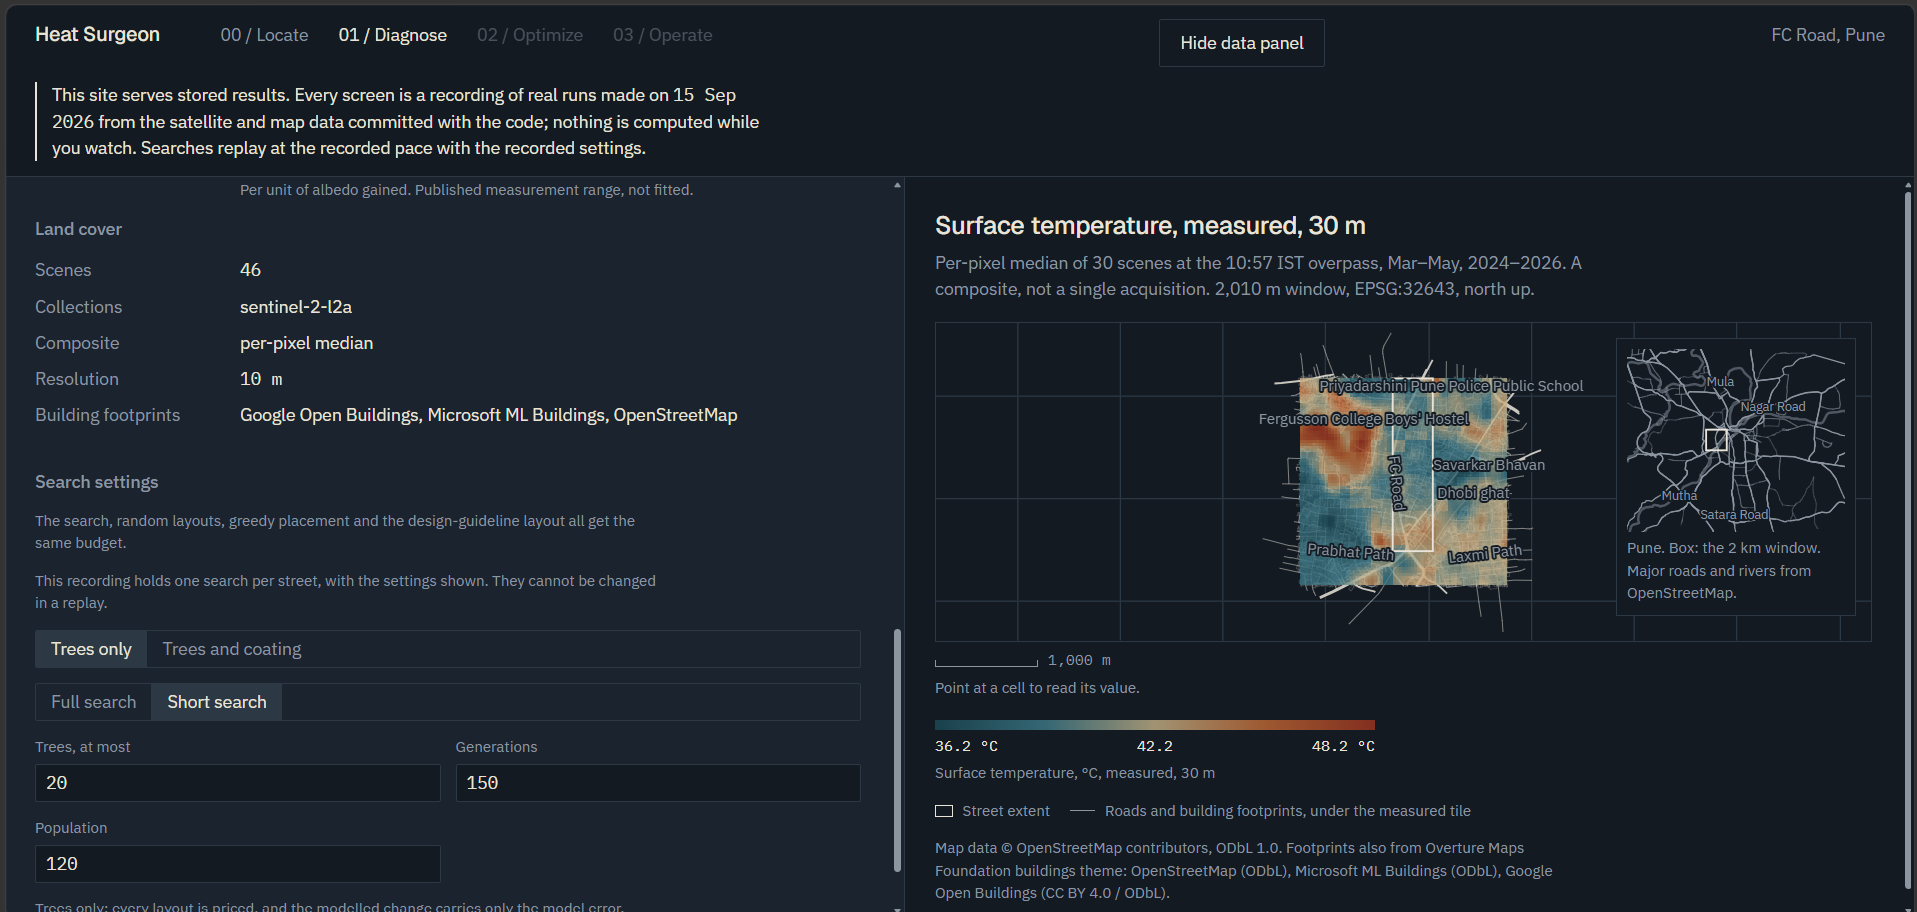
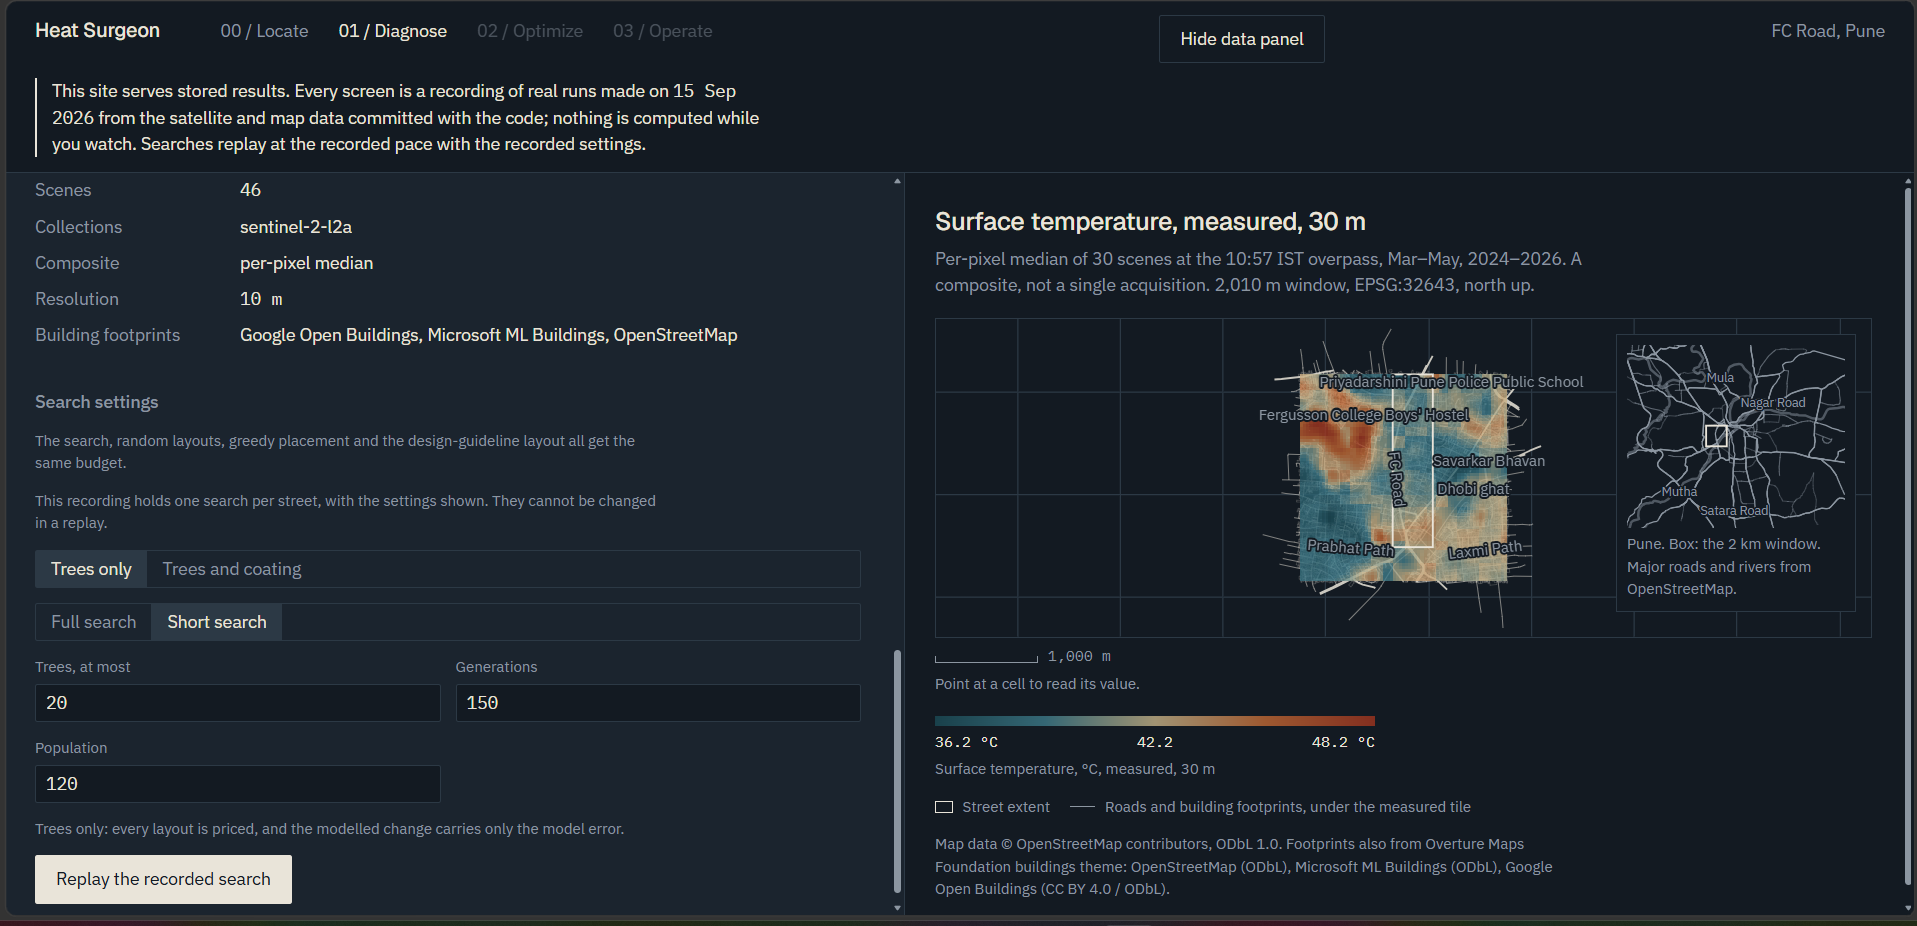
Stage 01, Diagnose. Sentinel-2 land cover and building sources, with the trees-only short-search preset: 20 trees, 150 generations.
-
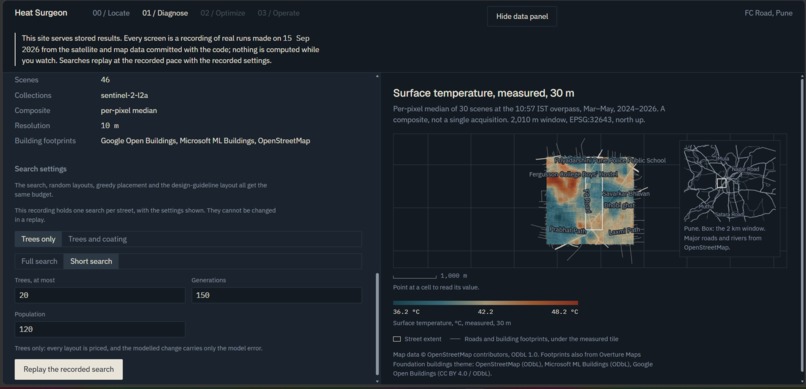
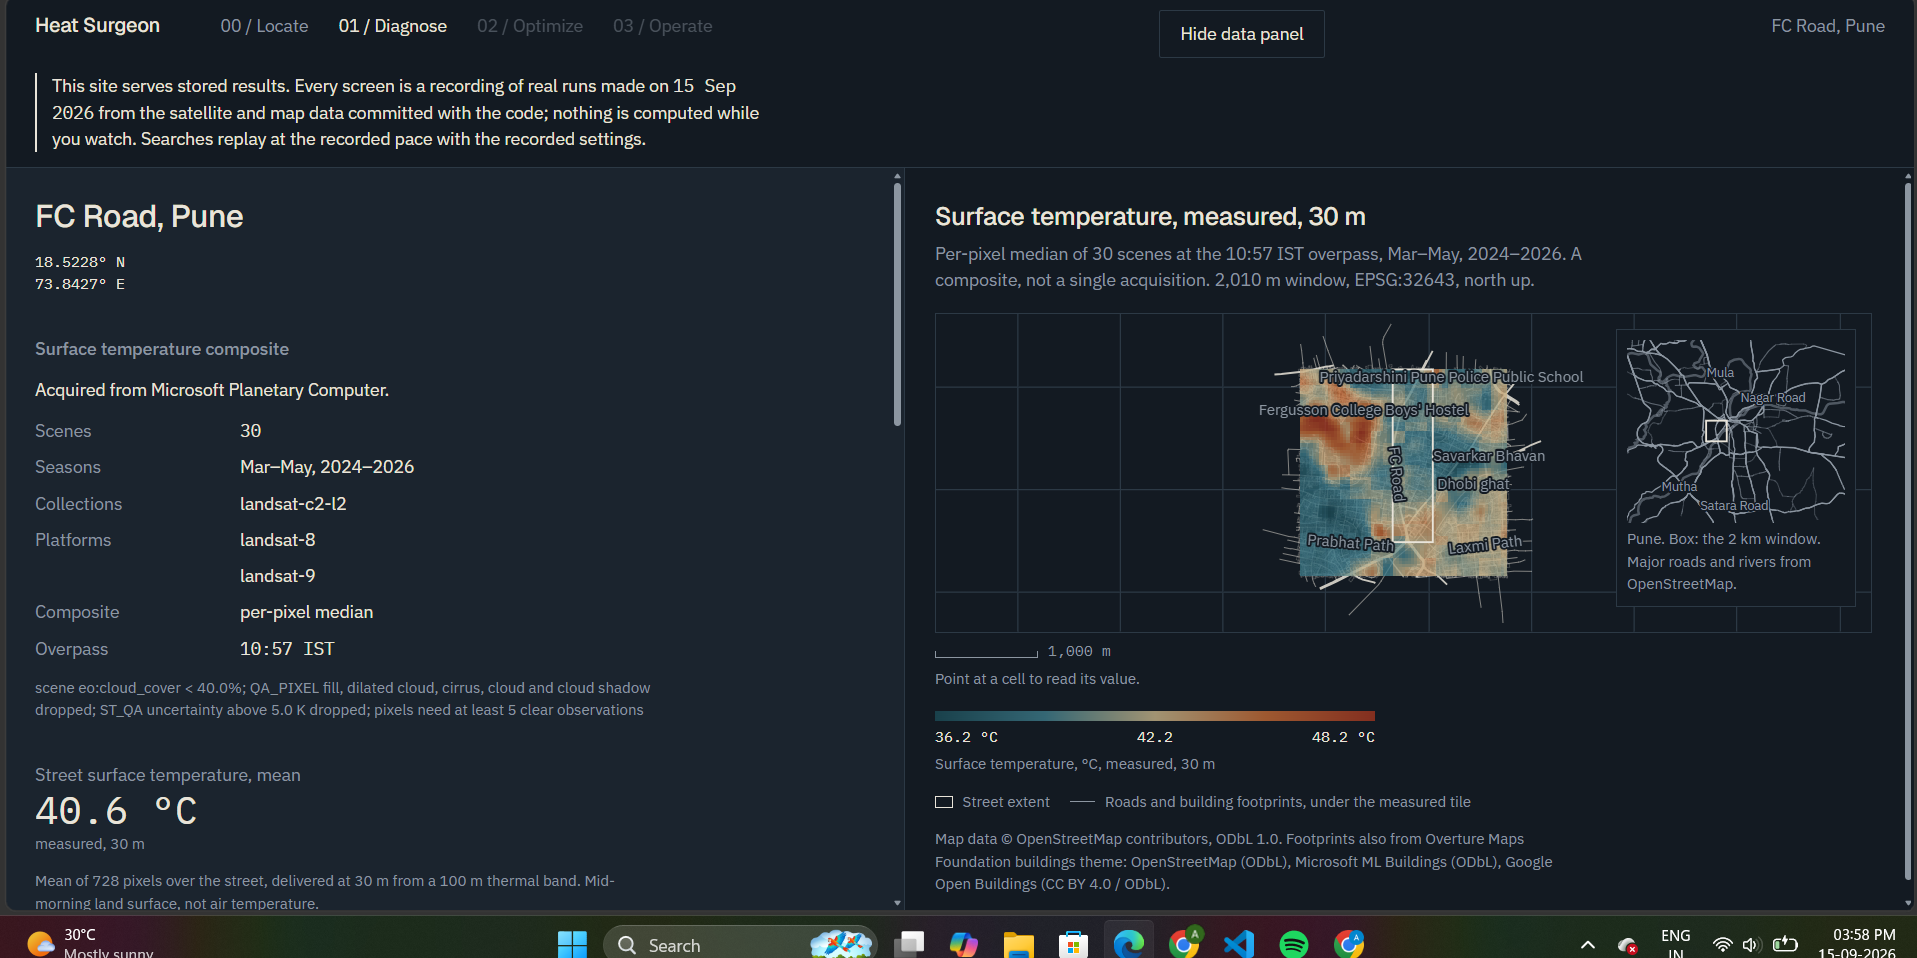
Stage 01, Diagnose. Composite provenance: scene count, seasons, masking rules, followed by search budget and generation settings.
-
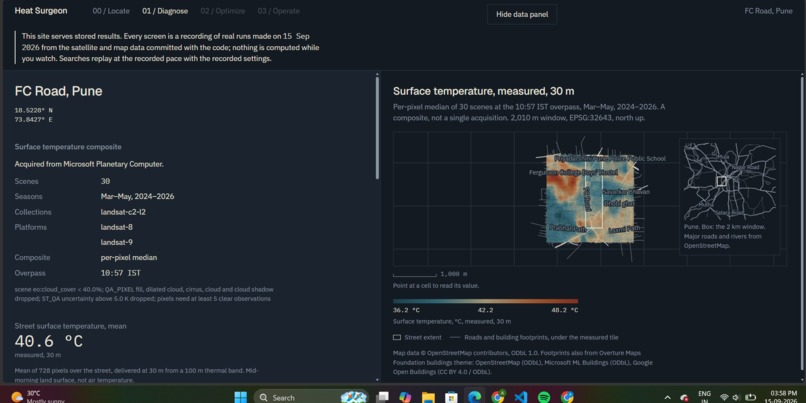
Stage 01, Diagnose. FC Road’s measured surface: Landsat LST median from 30 scenes at 10:57 IST, mapped over OSM roads and footprints.
-
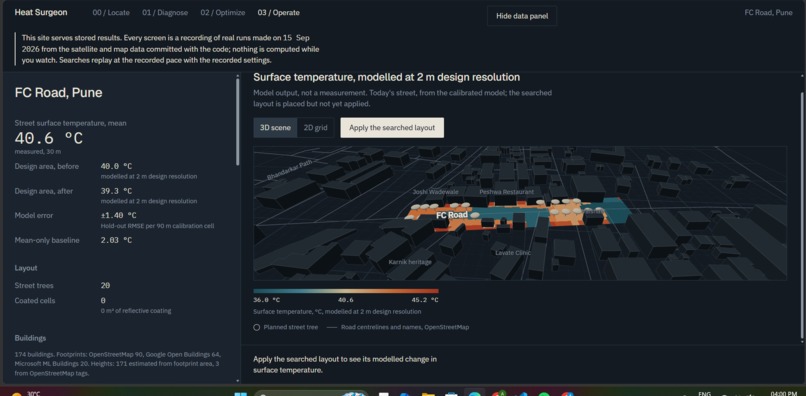
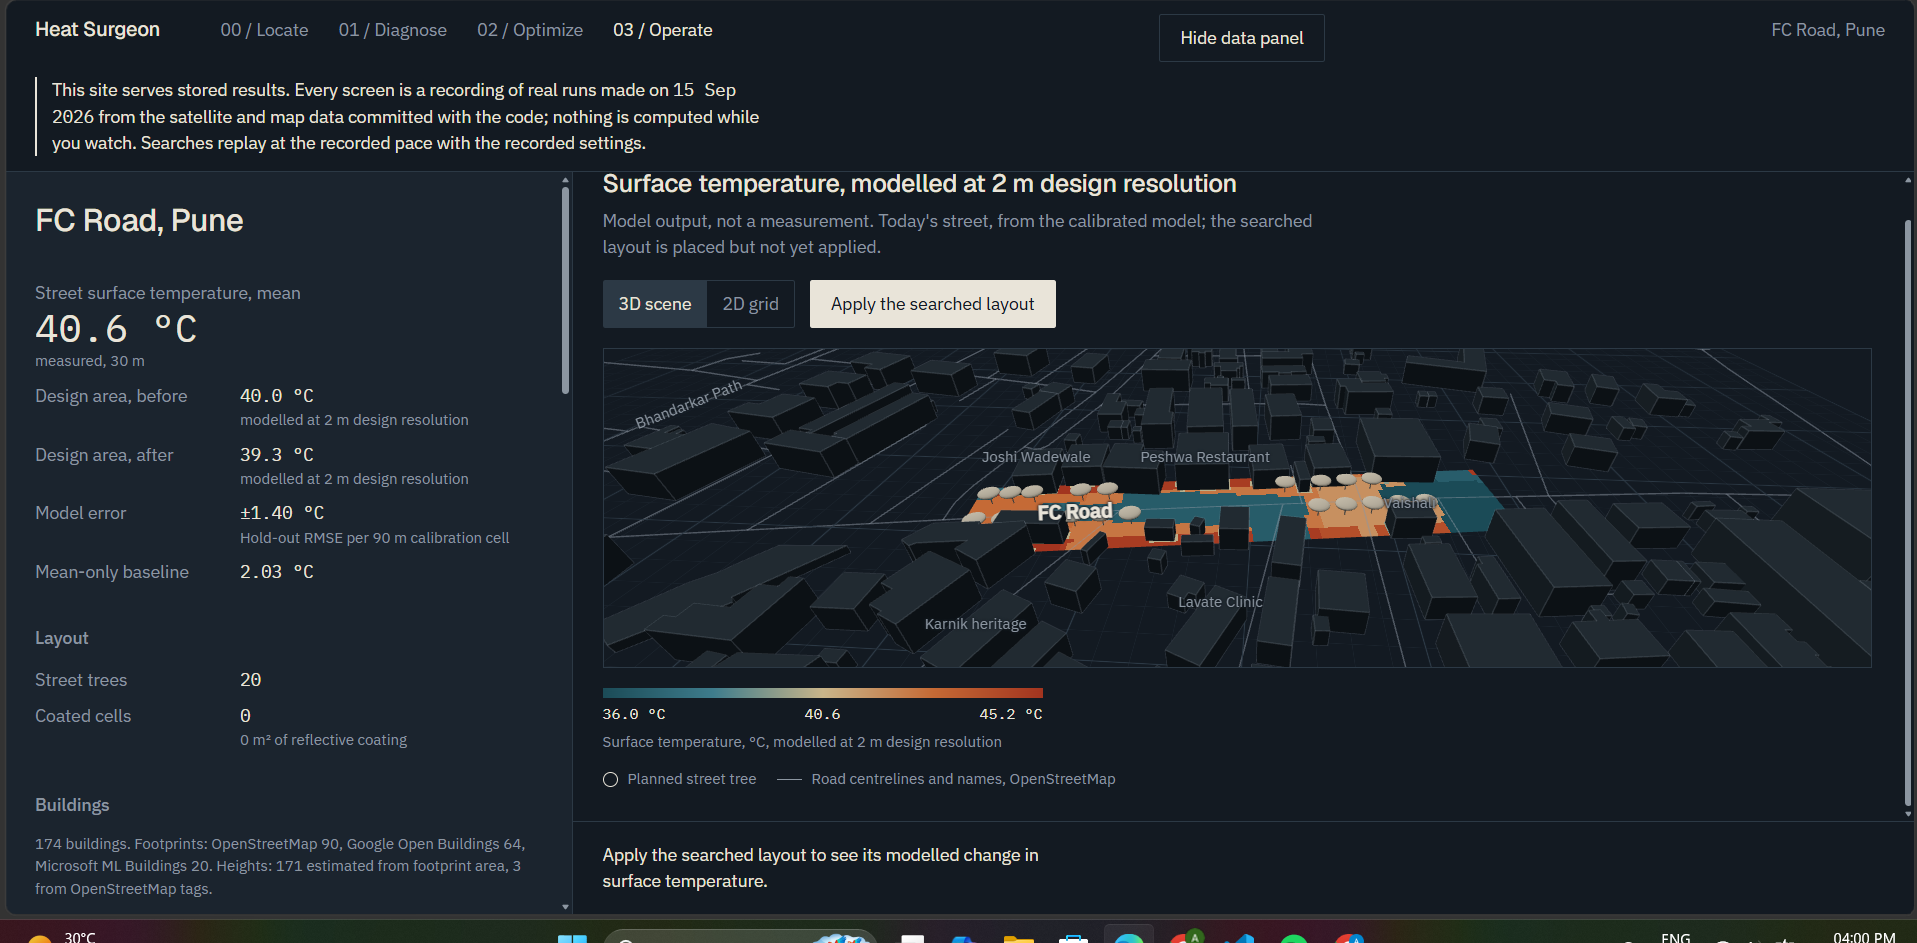
Stage 03, Operate. 3D before-state: OSM and Overture buildings over modelled ground, with 20 searched tree pits placed but not applied.
-
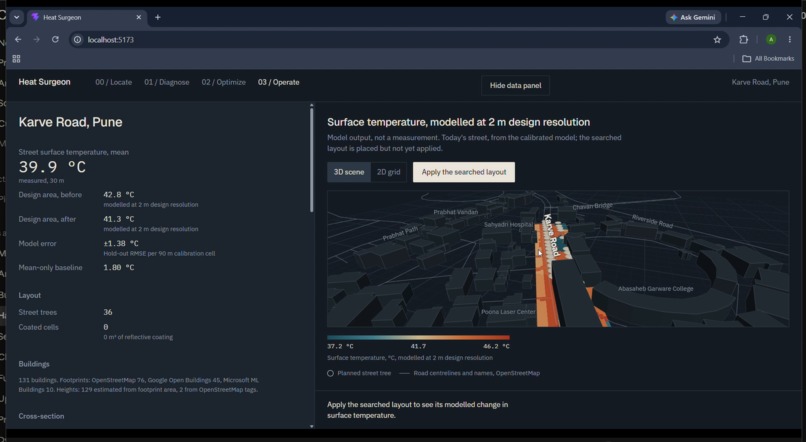
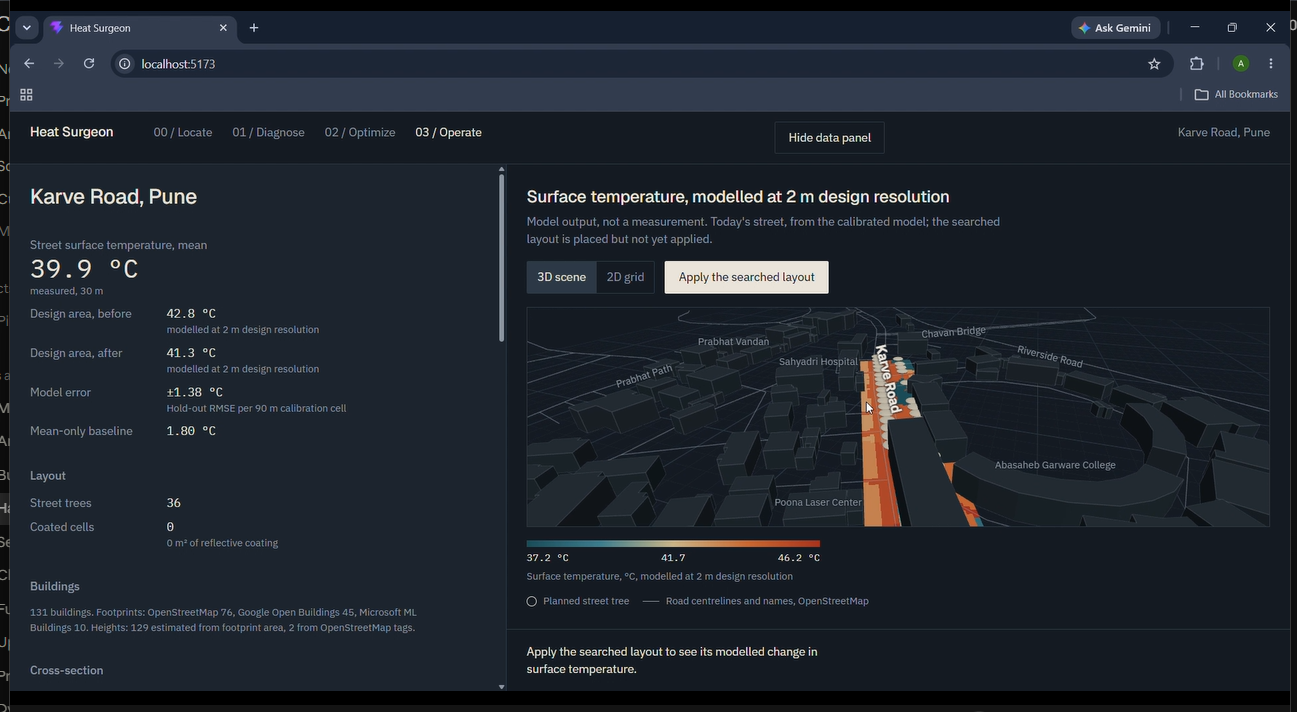
Example 2: Karve road with an estimated 150 trees
Inspiration
Our planet is heating up, and cities feel it first. Hard roofs and bare asphalt soak up the sun, and a street with no shade can run several degrees hotter than one lined with trees a few kilometres away. In Pune, where we built this, the pre-monsoon months of March to May are the hardest: the city bakes before the rains arrive.
Cities already respond by planting trees, and that is one of the best tools for climate adaptation we have. But planting drives are usually decided by target counts, not by evidence. A ward office has a fixed budget and a list of streets. Which street should get trees first? Where on that street should they go? How much cooler will it be, and how sure can anyone be about that?
Heat maps show a city where it is hot. We could not find a tool that answered the next question: what should we do about it, here, for this much money? That gap between measuring heat and acting on it is the environmental problem Heat Surgeon tackles, in direct answer to the Earth Forward call to help communities adapt to climate change.
What it does
Heat Surgeon takes one real street and turns satellite data into a planting plan a city office could use.
Measures the street. It pulls Landsat 8 and 9 land surface temperature for March to May of 2024, 2025 and 2026, removes clouds pixel by pixel, and builds a median composite. Bajirao Road's surface is 2.9 °C hotter than North Main Road's, 5.3 km away, on the same overpass.
Learns how this neighbourhood heats up. Sentinel-2 vegetation, OpenStreetMap roads and Overture building footprints give every square metre of a 2 km window a surface type. A model fitted on that neighbourhood predicts surface temperature, and tells you its own error.
Searches thousands of layouts. A genetic algorithm places street trees on a 2 m grid, only where Pune's published street design templates put tree pits, at Indian Roads Congress spacing, within a budget.
Proves the search is worth it. Every result sits beside three other ways to spend the same budget: random placement, planting the hottest spots first, and an evenly spaced design guideline.
Shows it in 3D over the real buildings, with a single before-and-after reveal of the modelled surface temperature.
Ranks where to plant first across 93 streets by modelled cooling per ₹1 lakh, and prints a one-page brief for any street.
Suggests which trees fit the street, as a cited reference, not a model output: species from the Indian Roads Congress list for the Deccan Plateau, Pune's own list of trees to avoid, and the largest trunk each street's tree pits can take. Every species is checked against the model's 8 m crown and flagged if it is likely to cool less.
On FC Road, 20 trees: the searched layout cools the design area by 0.70 °C, for an estimated ₹74,400 to ₹1,18,040, and that is 11% more cooling than the strongest baseline at the same budget.
How we built it
Data. Landsat Collection 2 Level 2 and Sentinel-2 L2A come from Microsoft Planetary Computer's public STAC catalogue, behind an interface that can swap in Google Earth Engine. Roads come from OpenStreetMap through Overpass, and building footprints from Overture Maps, read with DuckDB over GeoParquet. Everything is cached, so the demo runs fully offline.
Landsat stores temperature as scaled integers, so the first function we tested was the conversion to Celsius, checked against the USGS worked example (DN 44,947 to 302.6 K):
$$T_{°C} = 0.00341802 \cdot \mathrm{DN} + 149.0 - 273.15$$
Model. On 90 m calibration cells across the window, we fit ordinary least squares on the share of each surface type:
$$T = t_{\text{base}} - k_{\text{canopy}} f_{\text{canopy}} + k_{\text{built}} f_{\text{built}} + k_{\text{bare}} f_{\text{bare}}$$
with paving as the reference class. A seeded 20% of cells are held out. On FC Road the model predicts held-out cells to within \( \pm 1.40\ °\mathrm{C} \), against \( 2.03\ °\mathrm{C} \) for simply predicting the neighbourhood mean, and the app shows both numbers.
Optimizer. A DEAP genetic algorithm searches layouts on the 2 m grid, with a repair step that forces every layout to respect tree spacing, placement rules and the budget, instead of rejecting invalid ones. The fitness for a trees-only layout is the modelled drop in mean surface temperature, and the search streams live over a WebSocket.
Uncertainty. A street's modelled cooling is linear in the fitted coefficients, so its standard error comes straight from the coefficient covariance:
$$\mathrm{SE}(\Delta T) = \sqrt{g^{\top} \Sigma g}$$
where \( g \) counts the crown cells over each surface type. Two streets are treated as tied when their difference is within 1.96 standard errors, so every rank in the batch of 93 is shown as a range, never a single number the model cannot support.
App. FastAPI and pydantic contracts, mirrored field for field in TypeScript, with every physical quantity carrying its unit in its name (temp_delta_c, cost_inr_low). The frontend is React, TypeScript and Vite, with three.js through React Three Fiber, a GLSL ground shader, zustand and recharts. The public site is a static replay of real recorded runs, hosted on GitHub Pages.
Challenges we ran into
Monsoon clouds. A generic "summer" window returned almost nothing over Pune. We switched to March to May across three years and masked clouds per pixel, not per scene.
Resolution honesty. Landsat's thermal band is 100 m. A 150 m street is only one or two real measurements. We calibrate on the whole neighbourhood and apply the model at 2 m, and every screen says which of the three resolutions it shows.
A coefficient with the wrong sign. Fitted from data, brighter ground looked hotter, because in pre-monsoon Pune the brightest ground is also the driest. We refused to ship it and used published field measurements instead.
Our own baselines humbled our headline. We first compared the search with the design guideline and reported 17% more cooling. Checking every arm showed that random placement beats the guideline, so the honest number is 5% to 11% over the strongest baseline.
Does the model travel? We tested it: a model borrowed from another neighbourhood is worse by 0.08 to 0.75 °C of hold-out accuracy. The canopy effect transfers between neighbourhoods; the base temperature and the roof and bare-ground effects do not. So every neighbourhood keeps its own calibration.
Ranking without false precision. Within the model's error, no street's rank is certain. The top street could be anywhere from 1st to 27th. We show that range instead of pretending.
A slow search. Profiling showed 75% of the time went into copying layouts, because DEAP's default clone is a deep copy of 2,000-gene lists. A shallow copy made the search three times faster, with results identical down to the hash.
Accomplishments that we're proud of
- An error bar on every prediction, and a baseline beside every result. Nothing ships without both.
- Nothing fabricated. Every temperature, land cover value and cost on screen comes from pulled data or a cited source, and every assumption is written down with what changing it would change.
- We tested our own method's limits. A borrowed model is worse in all twelve neighbourhood pairings we checked, which is exactly why the product calibrates per neighbourhood instead of assuming one model fits a whole city.
- A printable brief that labels what is measured, what is modelled, what it costs, and where every number comes from, fit to one A4 page.
What we learned
Every part of this stack was new to us:
- Satellite data: Landsat and Sentinel-2 products, quality bands, cloud masking, compositing, and map projections.
- Statistics: regression, hold-out validation, standard errors, and the difference between how wrong a number is and how stable a ranking is.
- Optimization: genetic algorithms, constraint repair, fair baselines, and profiling.
- 3D graphics: three.js, React Three Fiber and writing a shader.
- Full-stack web: FastAPI, WebSockets, typed contracts and React state.
Most of all, we learned that being honest about uncertainty makes a tool more useful, not less.
What's next for Heat Surgeon
- Calibrate more 2 km windows to cover a whole ward, and rank all of its streets.
- Share the printed brief with Pune Municipal Corporation's tree authority and local environmental groups, and adjust the placement rules and costs with their feedback.
- Replace the proxy tree costs with a Maharashtra schedule of rates, and add a sourced rate for cool pavement coatings.
- Test whether mid-morning rankings hold at afternoon peak heat, using ECOSTRESS.
Built during the hackathon
All code, data pulls and documentation were created during NextStep Hacks 2026.
Built With
- deap
- duckdb
- fastapi
- github
- glsl
- landsat
- microsoft-planetary-computer
- numpy
- openstreetmap
- overture-maps
- pydantic
- python
- rasterio
- react
- react-three-fiber
- recharts
- scipy
- sentinel-2
- three.js
- typescript
- vite
- websockets
- zustand


Log in or sign up for Devpost to join the conversation.