Inspiration
When Hurricane Helene hit Asheville in September 2024, the French Broad and Swannanoa rivers rose faster than anyone expected, and roads like Riverside Dr went under within hours. The data to see it coming existed: NOAA publishes river gauge readings and official river forecasts. But that data is built for professionals. Nobody turns "21 ft at the Asheville gauge" into "your street floods around 2 AM, so leave by midnight using this road." We built Haven to close that gap.
What it does
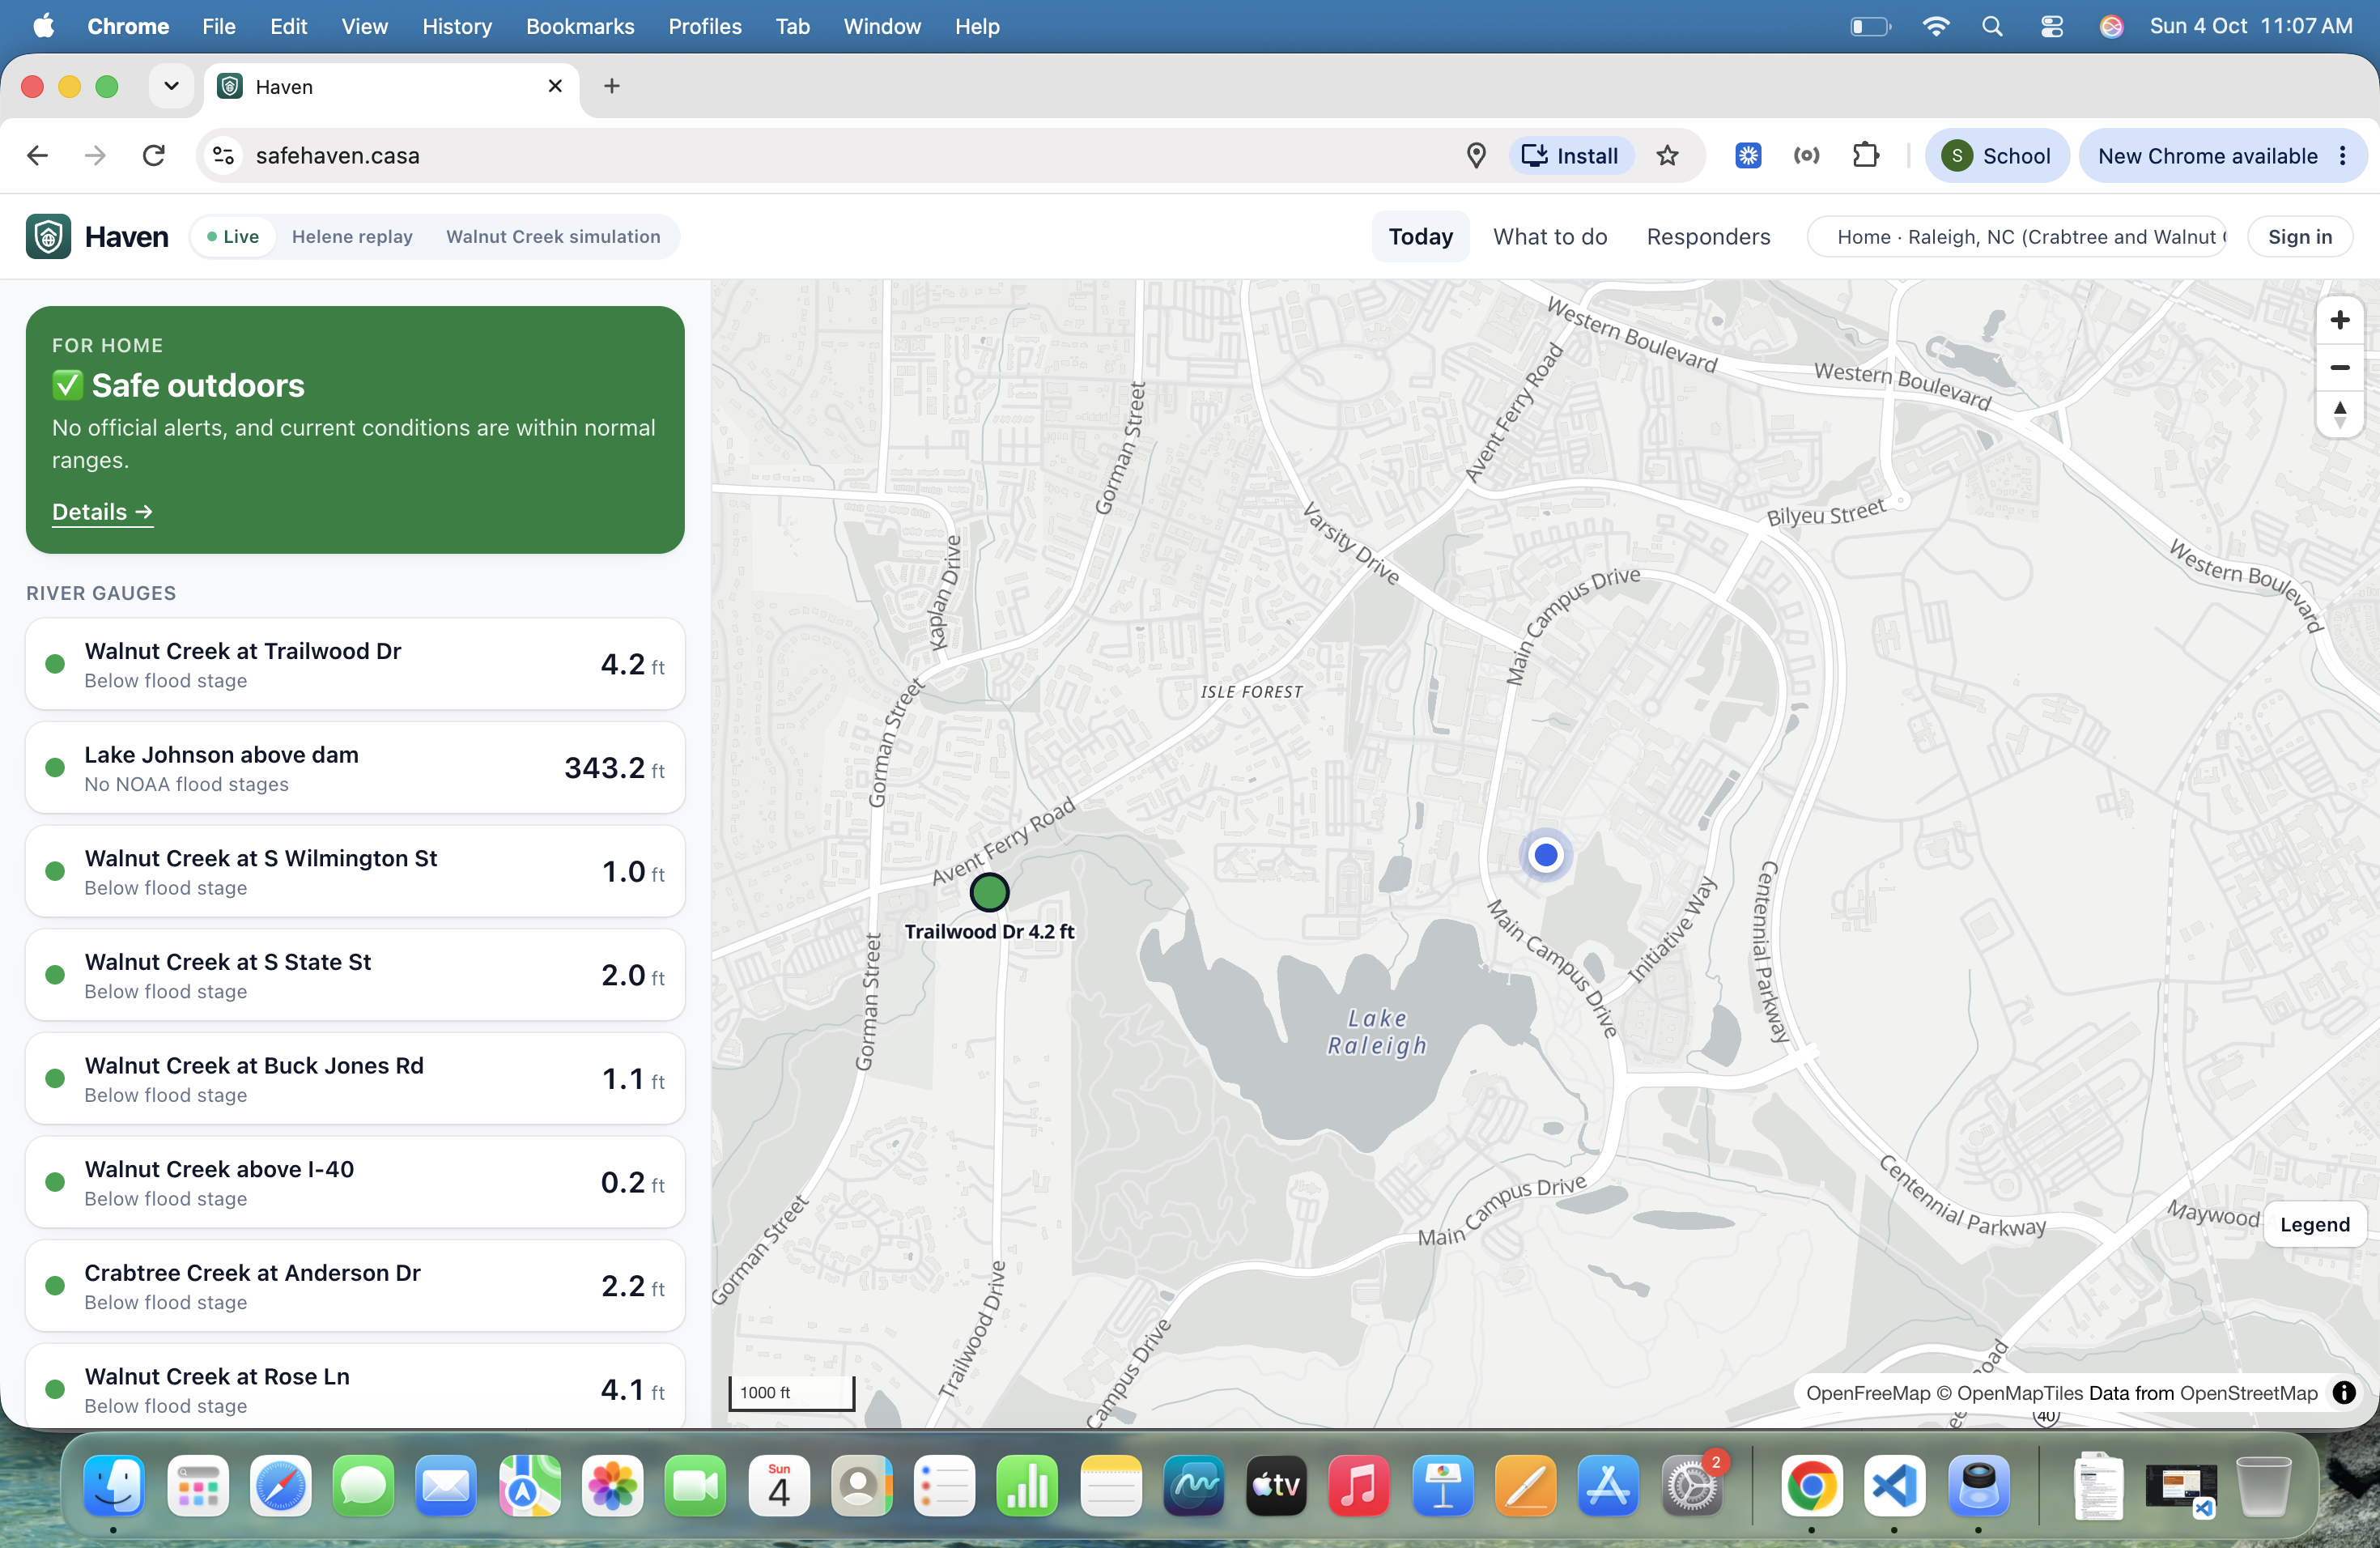
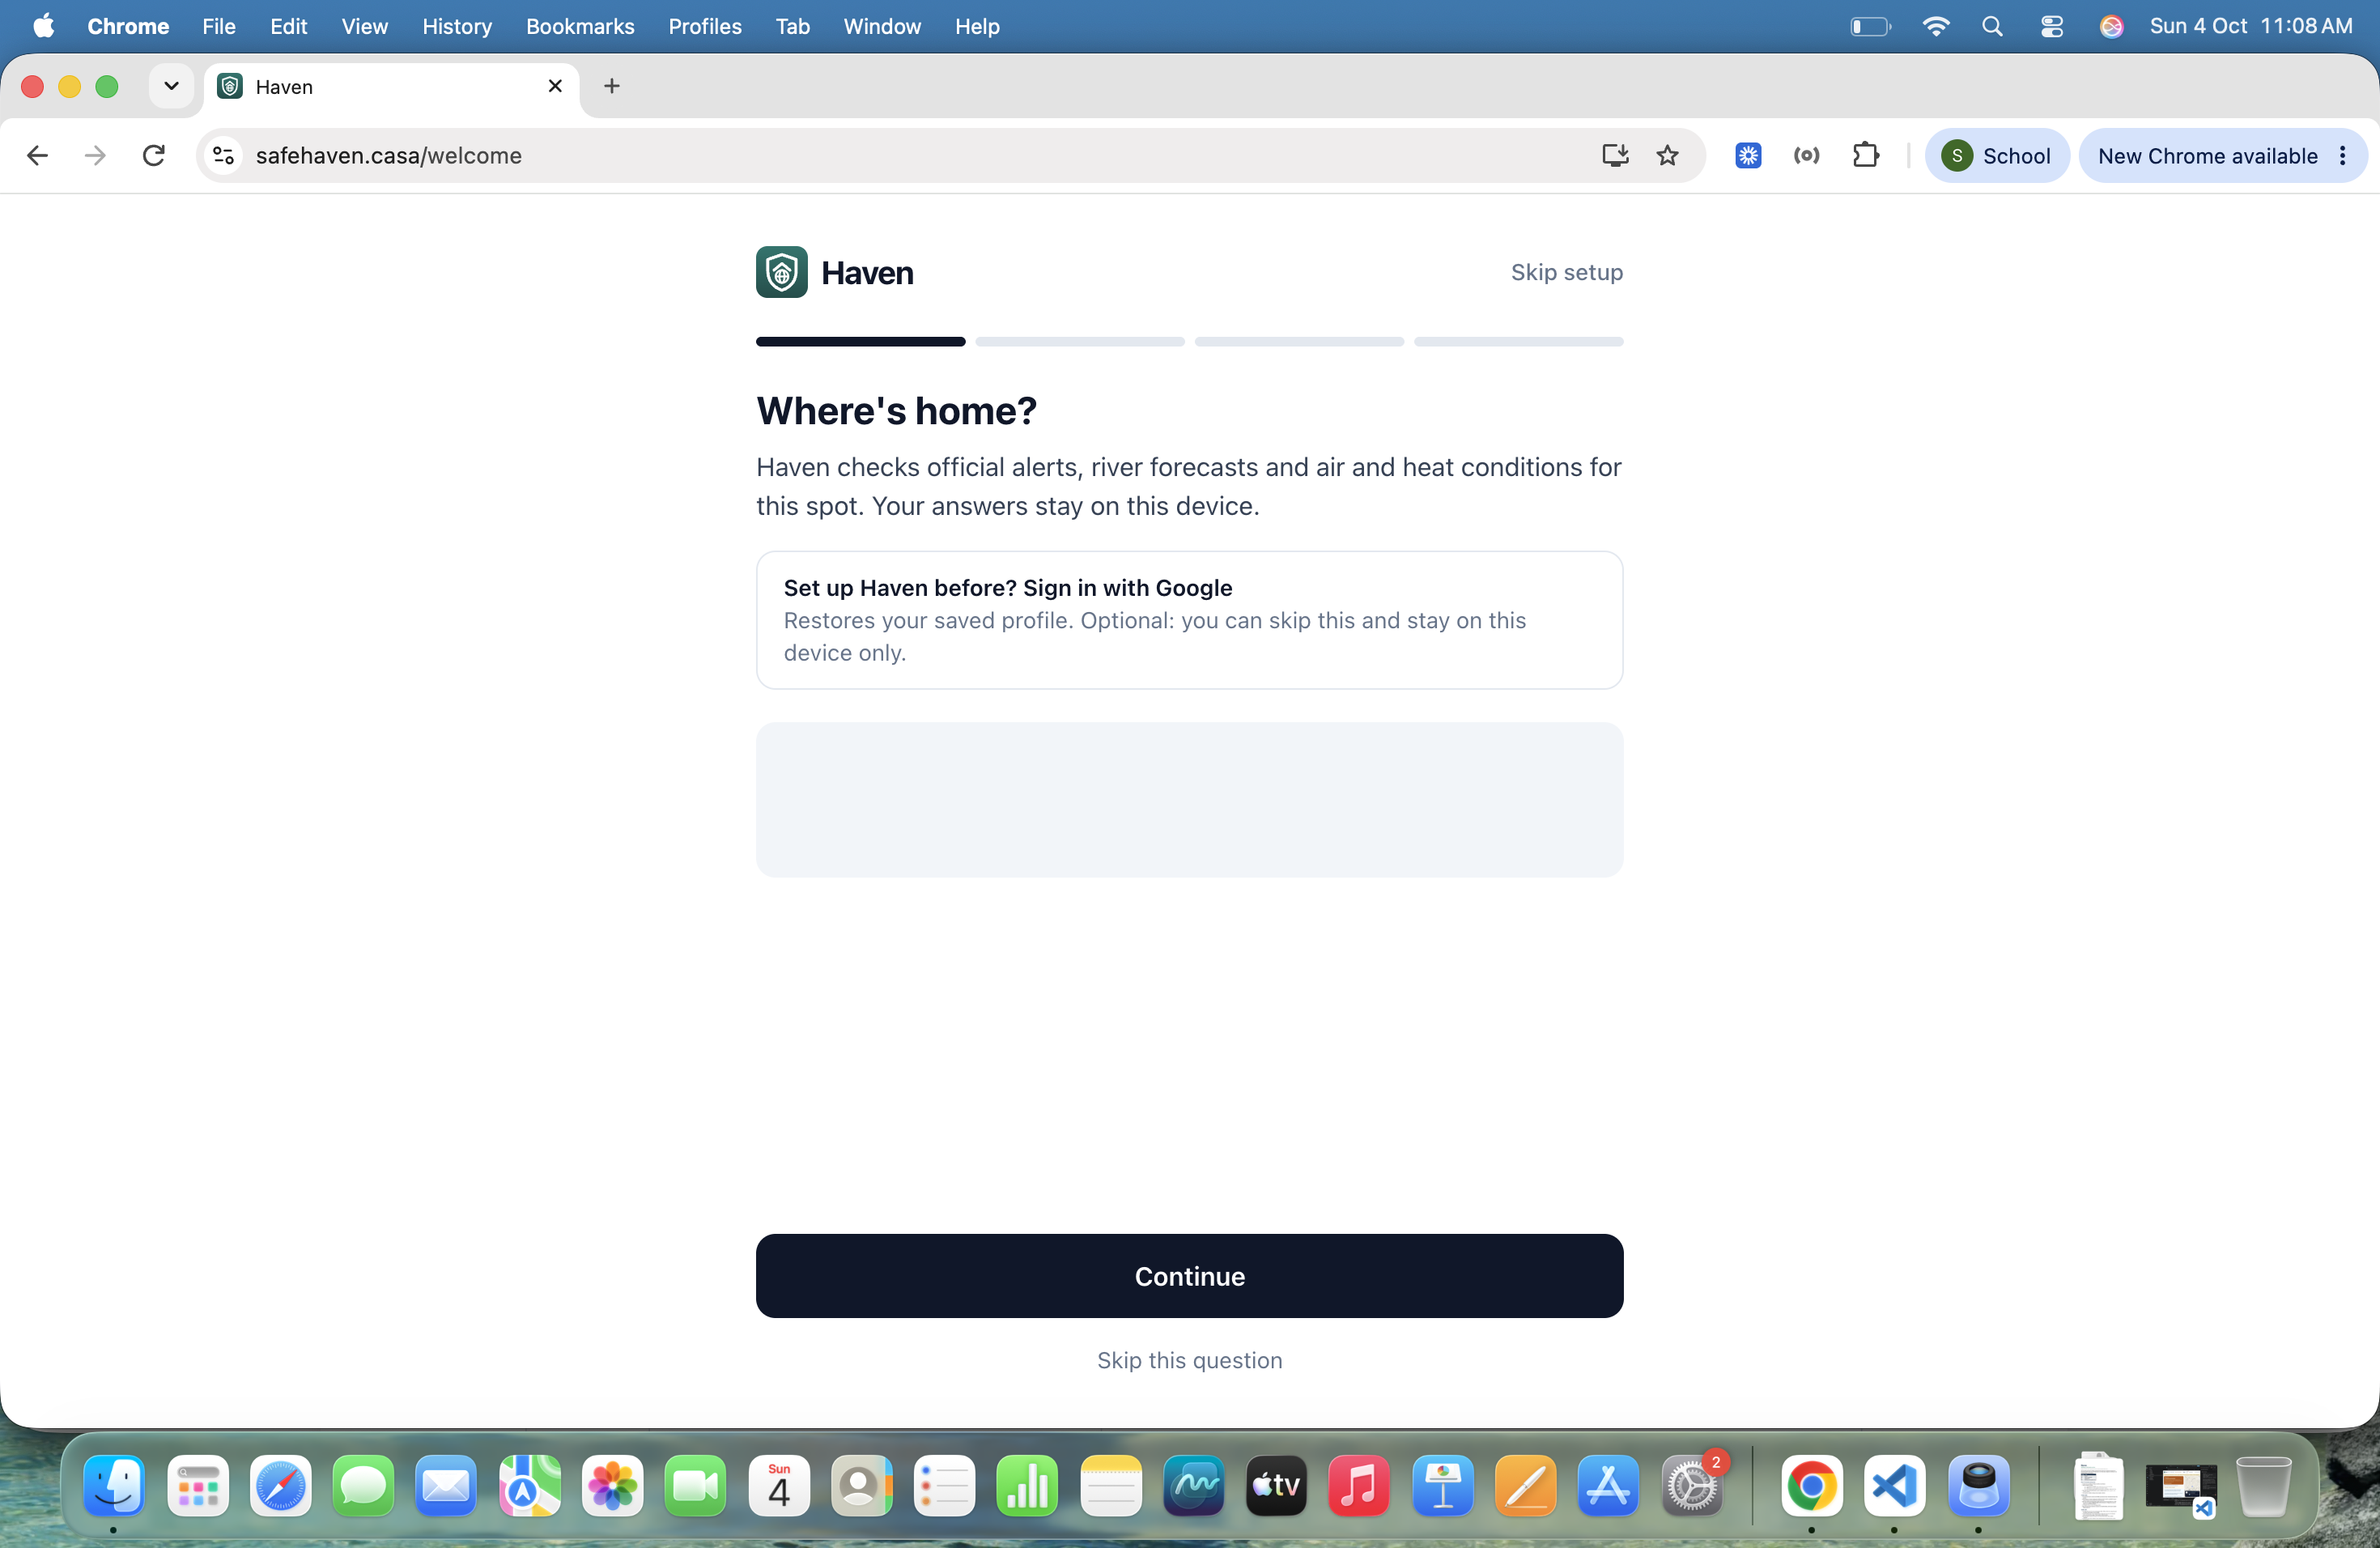
Haven turns official forecasts into a personal plan: what's happening, what's coming, and exactly what to do, for where you are right now.
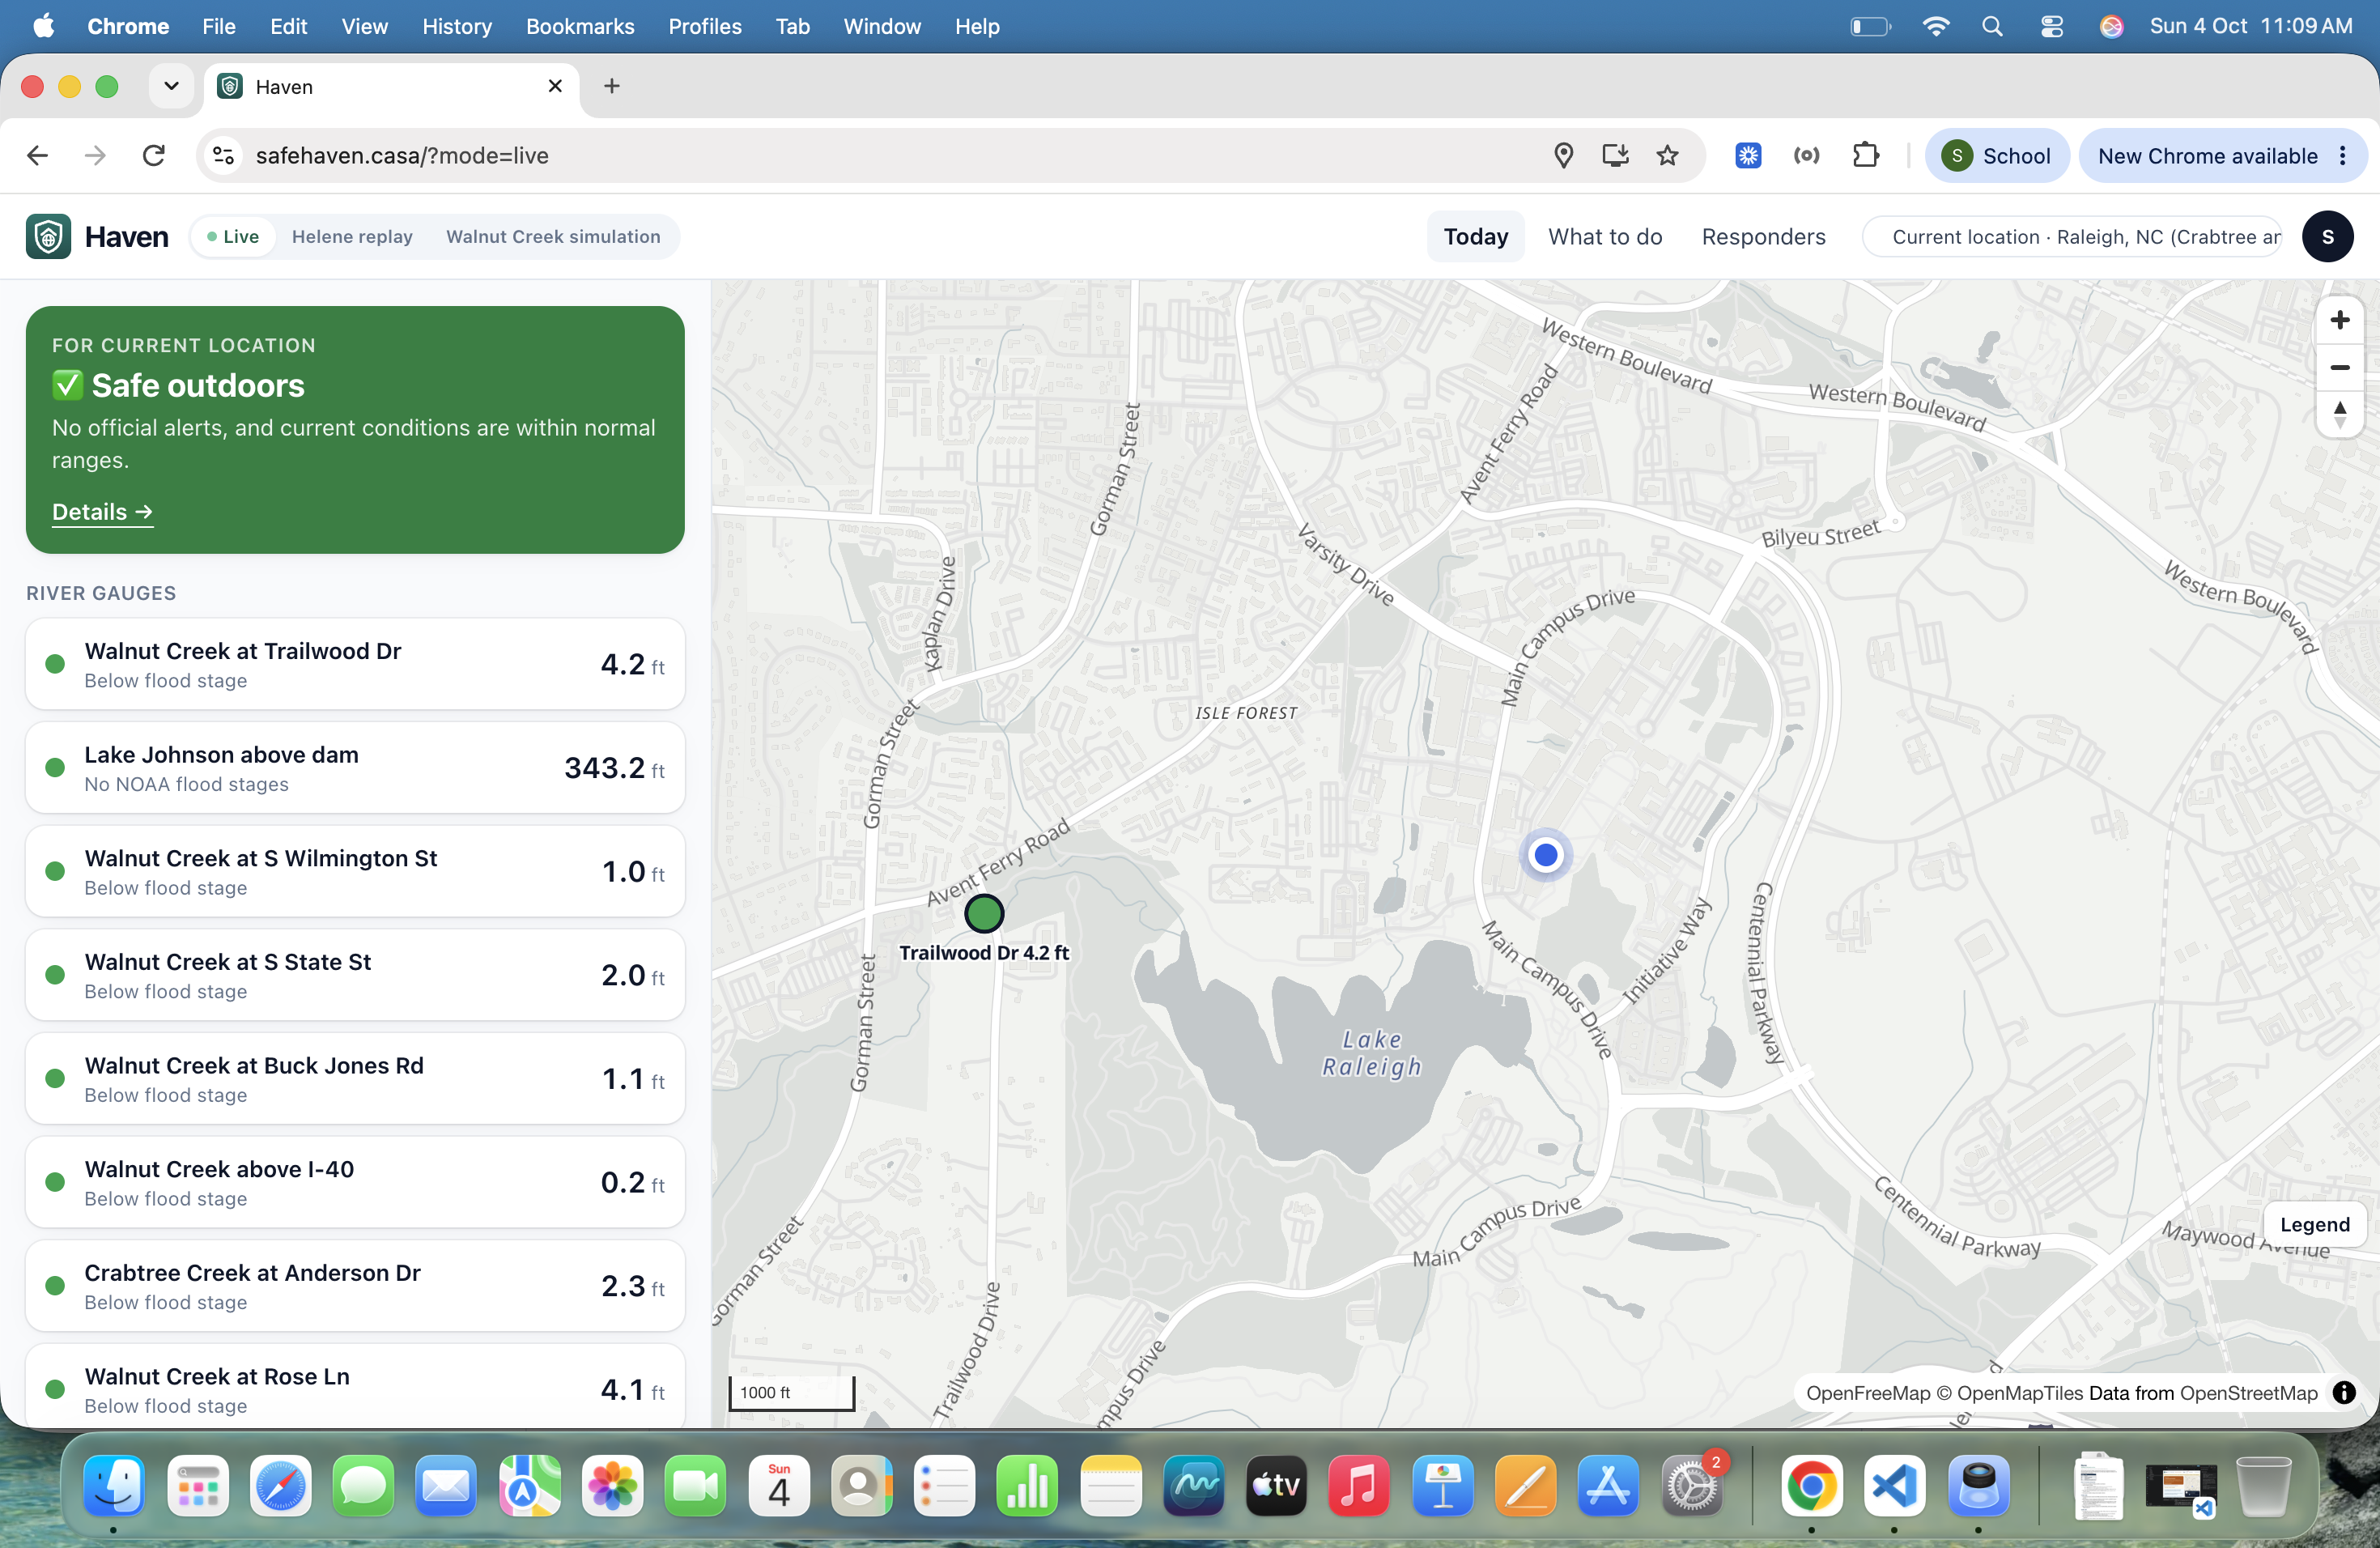
- Calm mode: live conditions and official heads-ups (NWS alerts, river gauges, heat, UV), each with one line of advice.
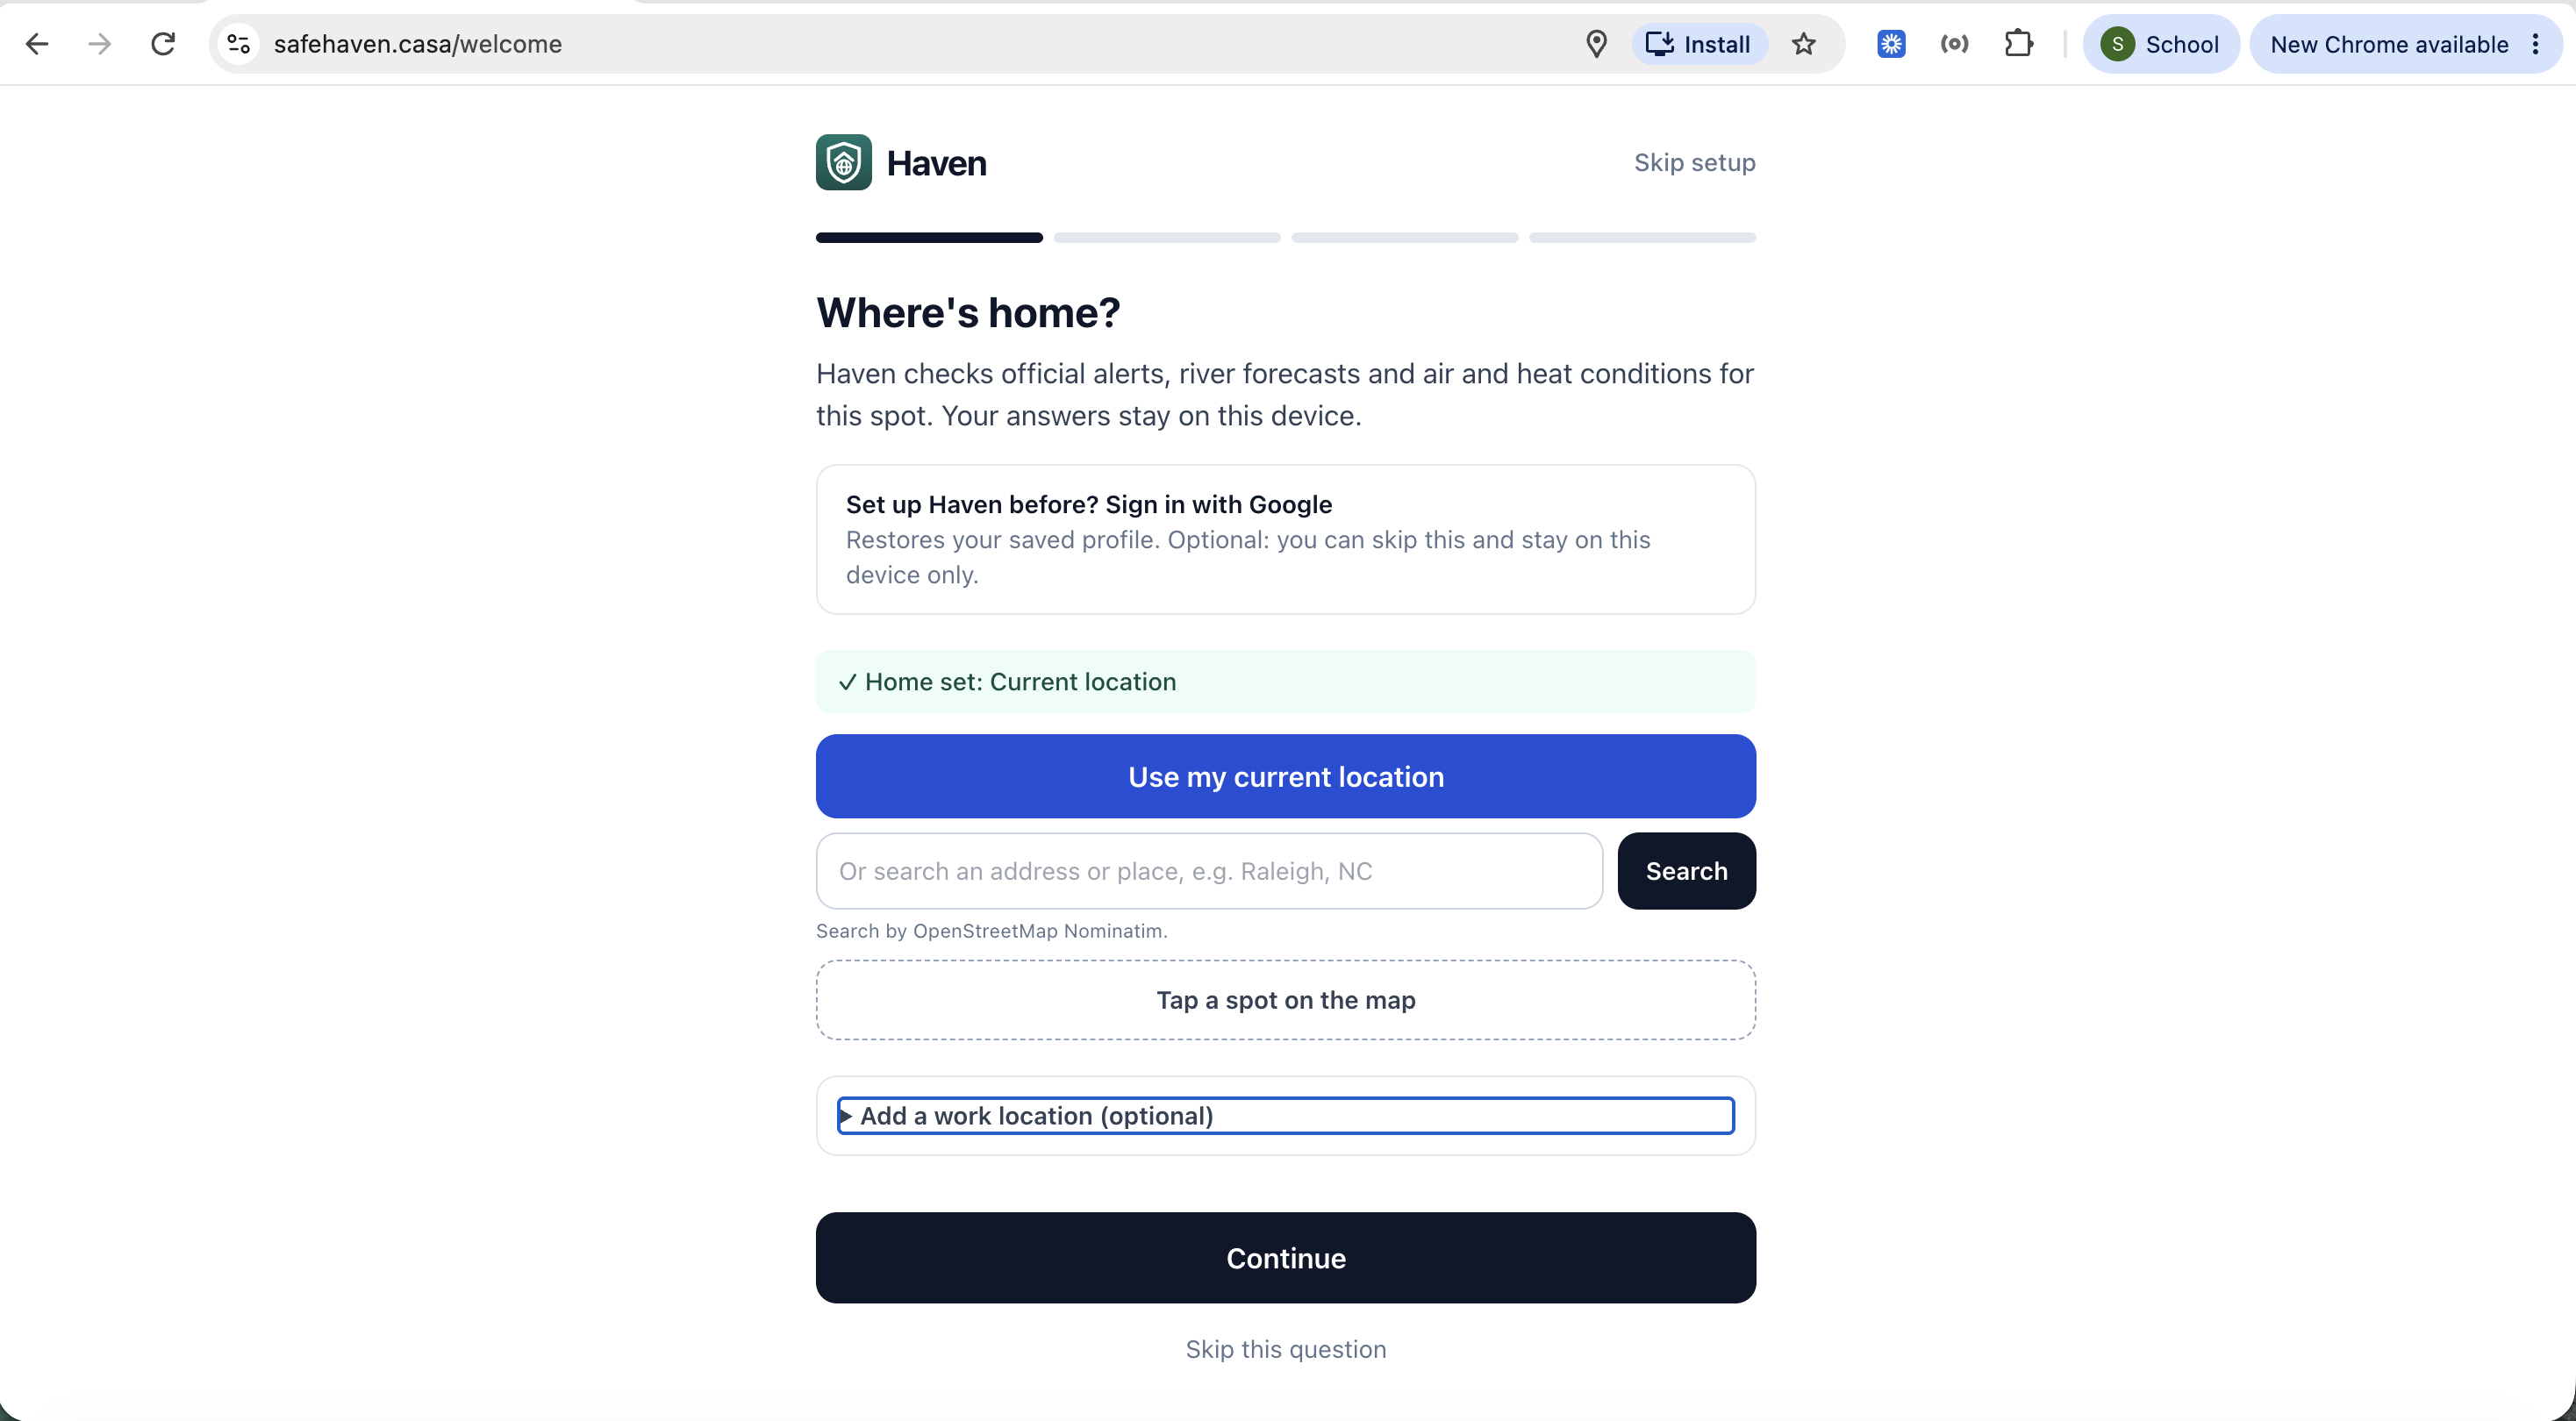
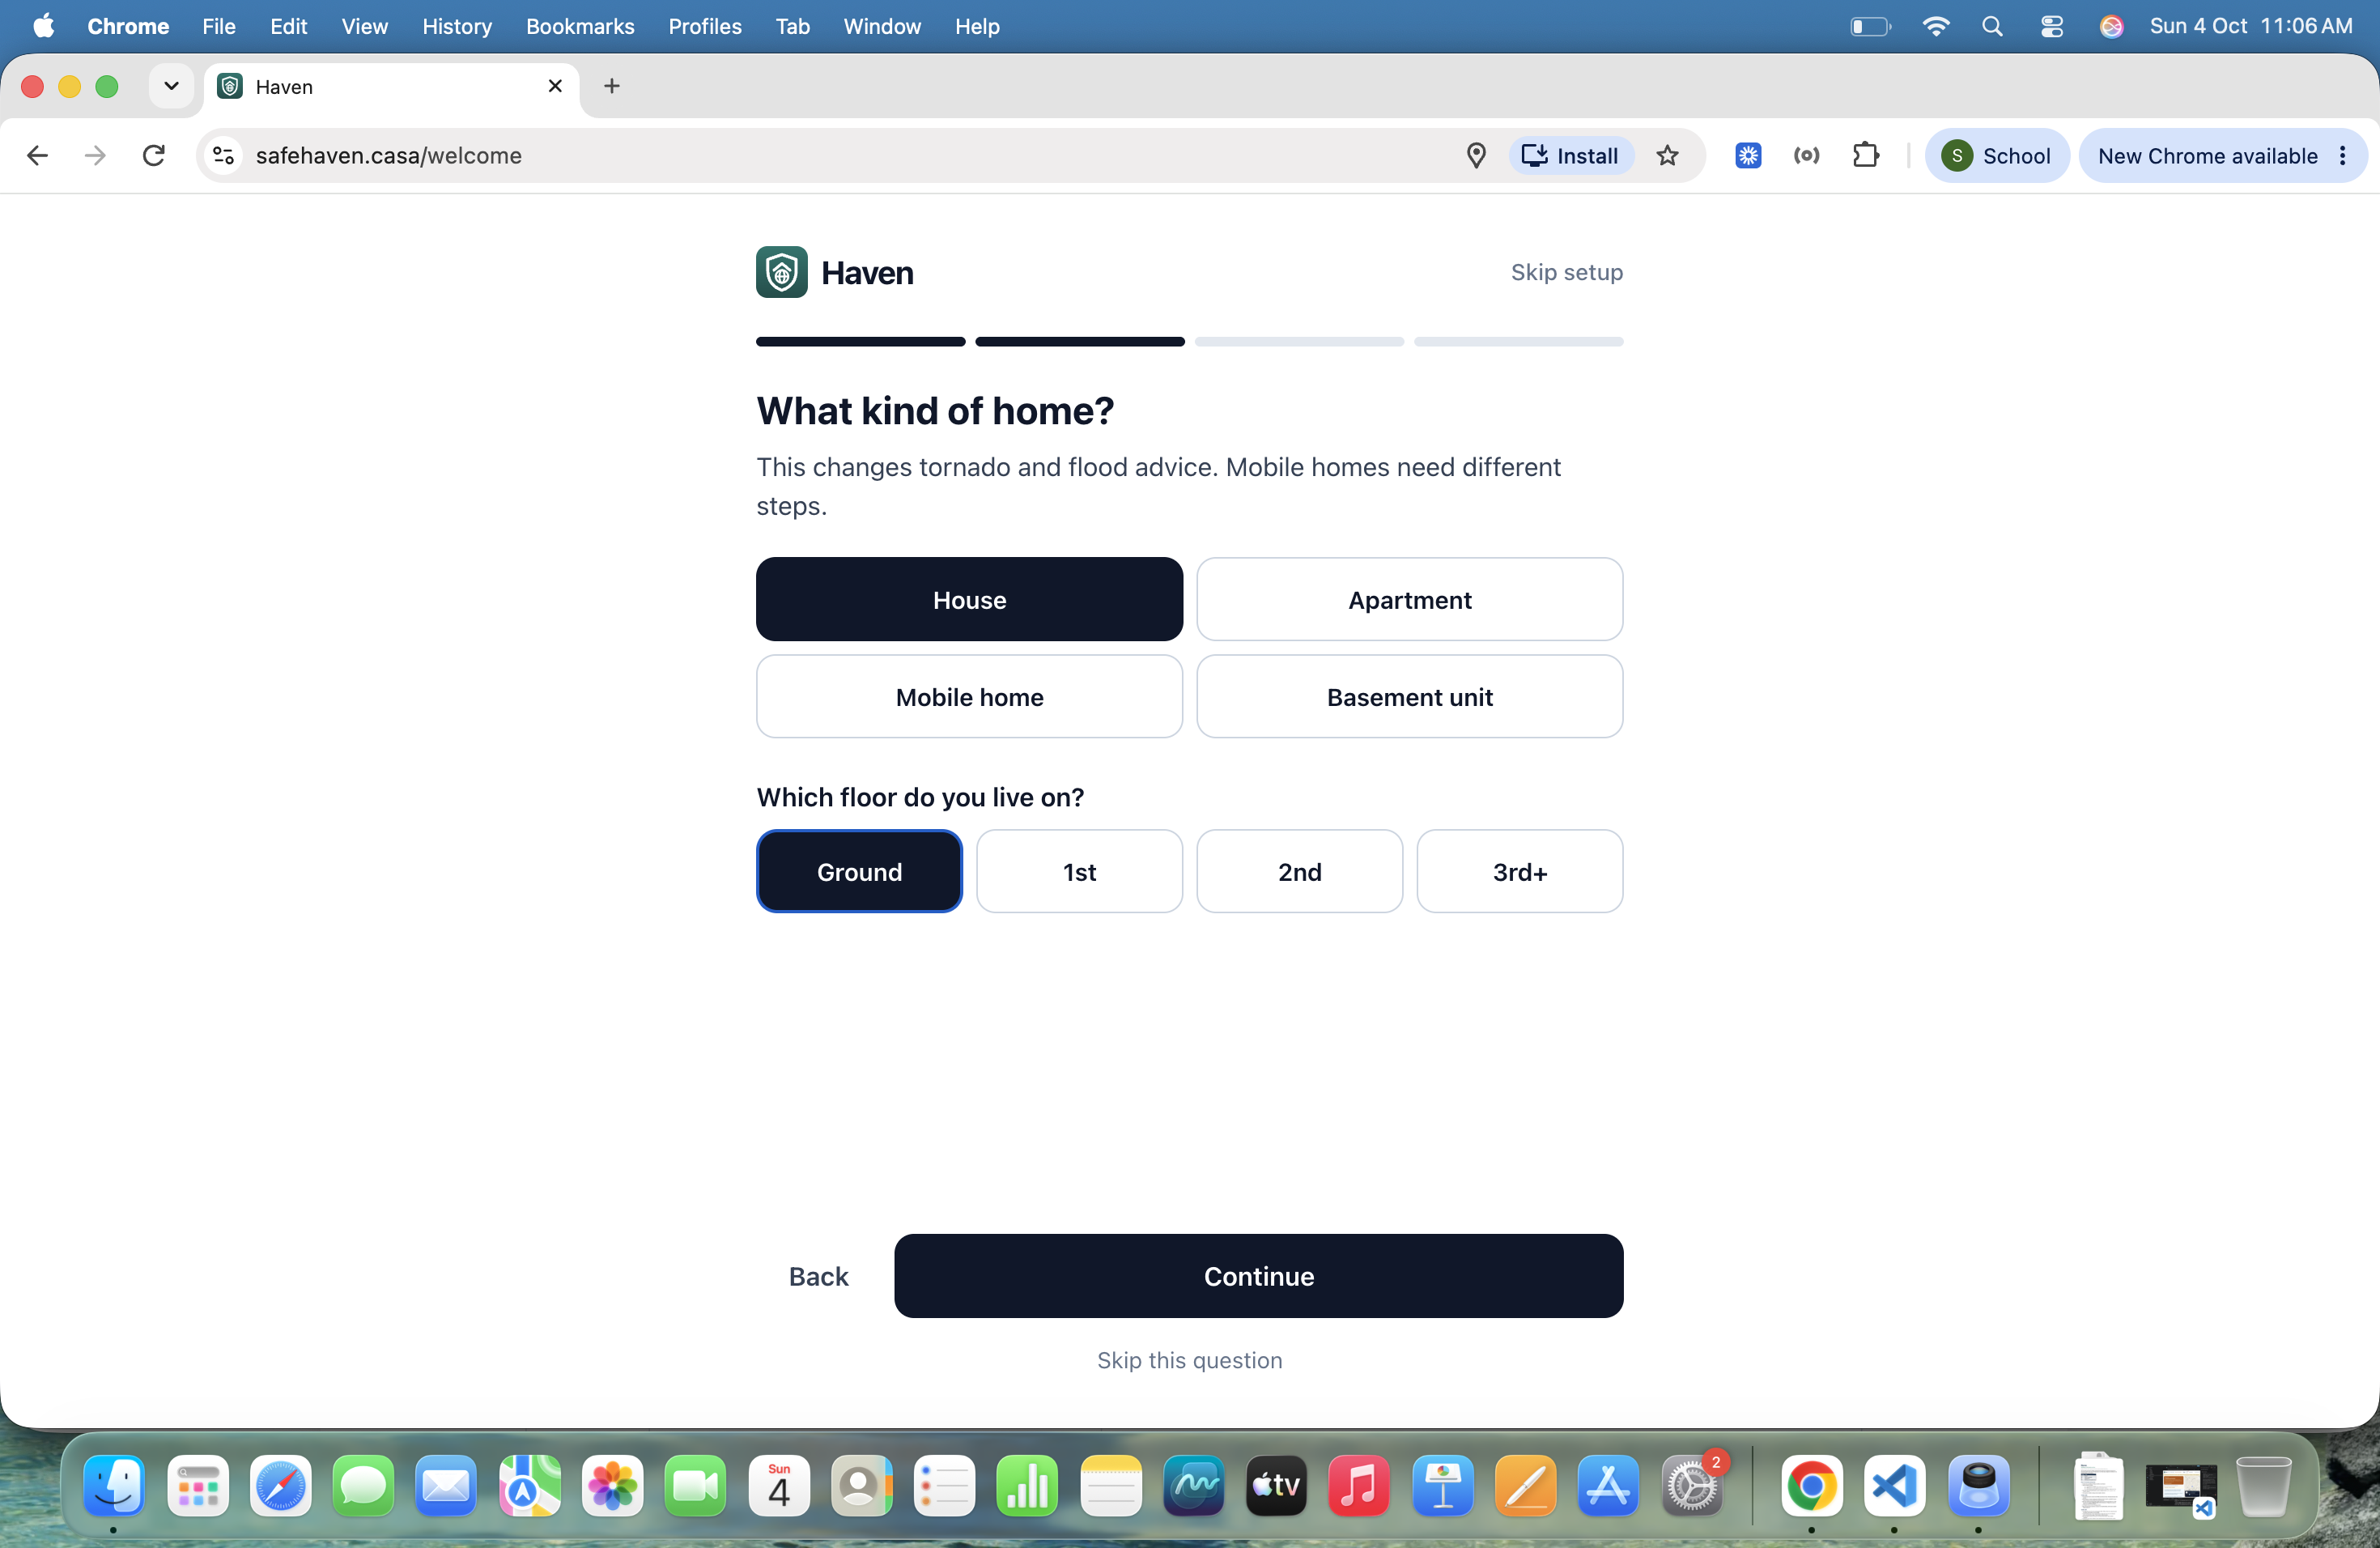
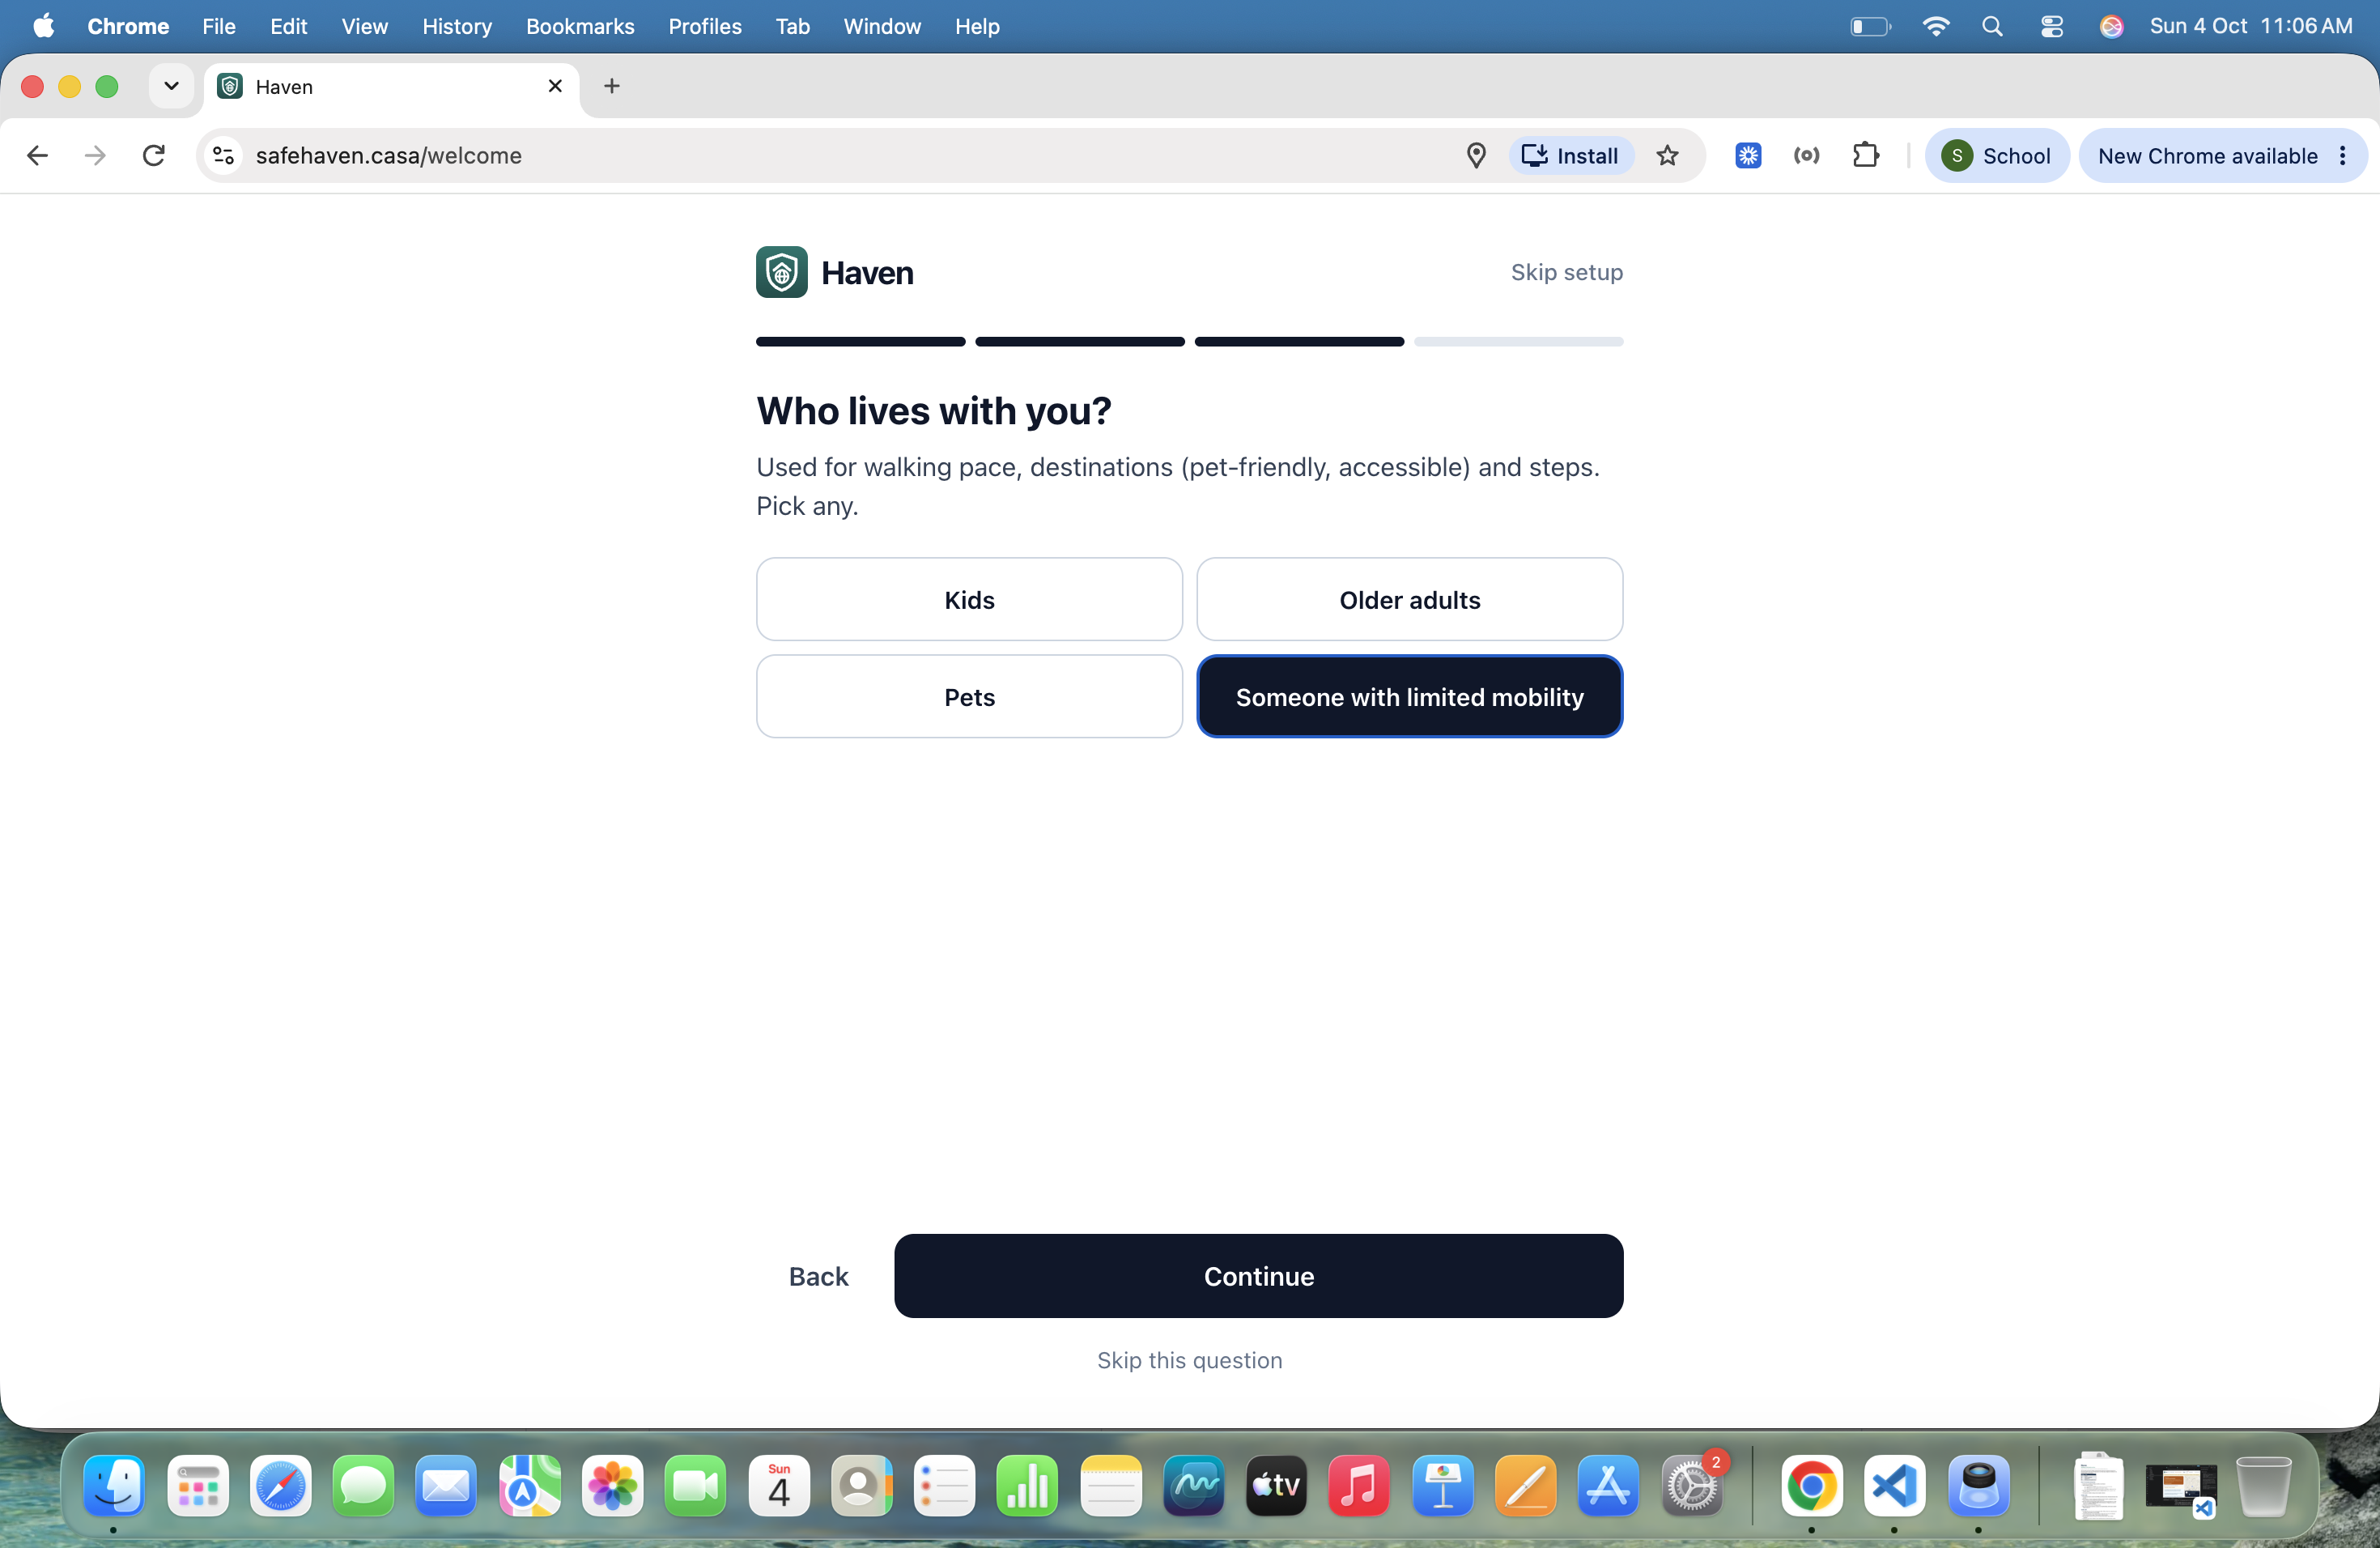
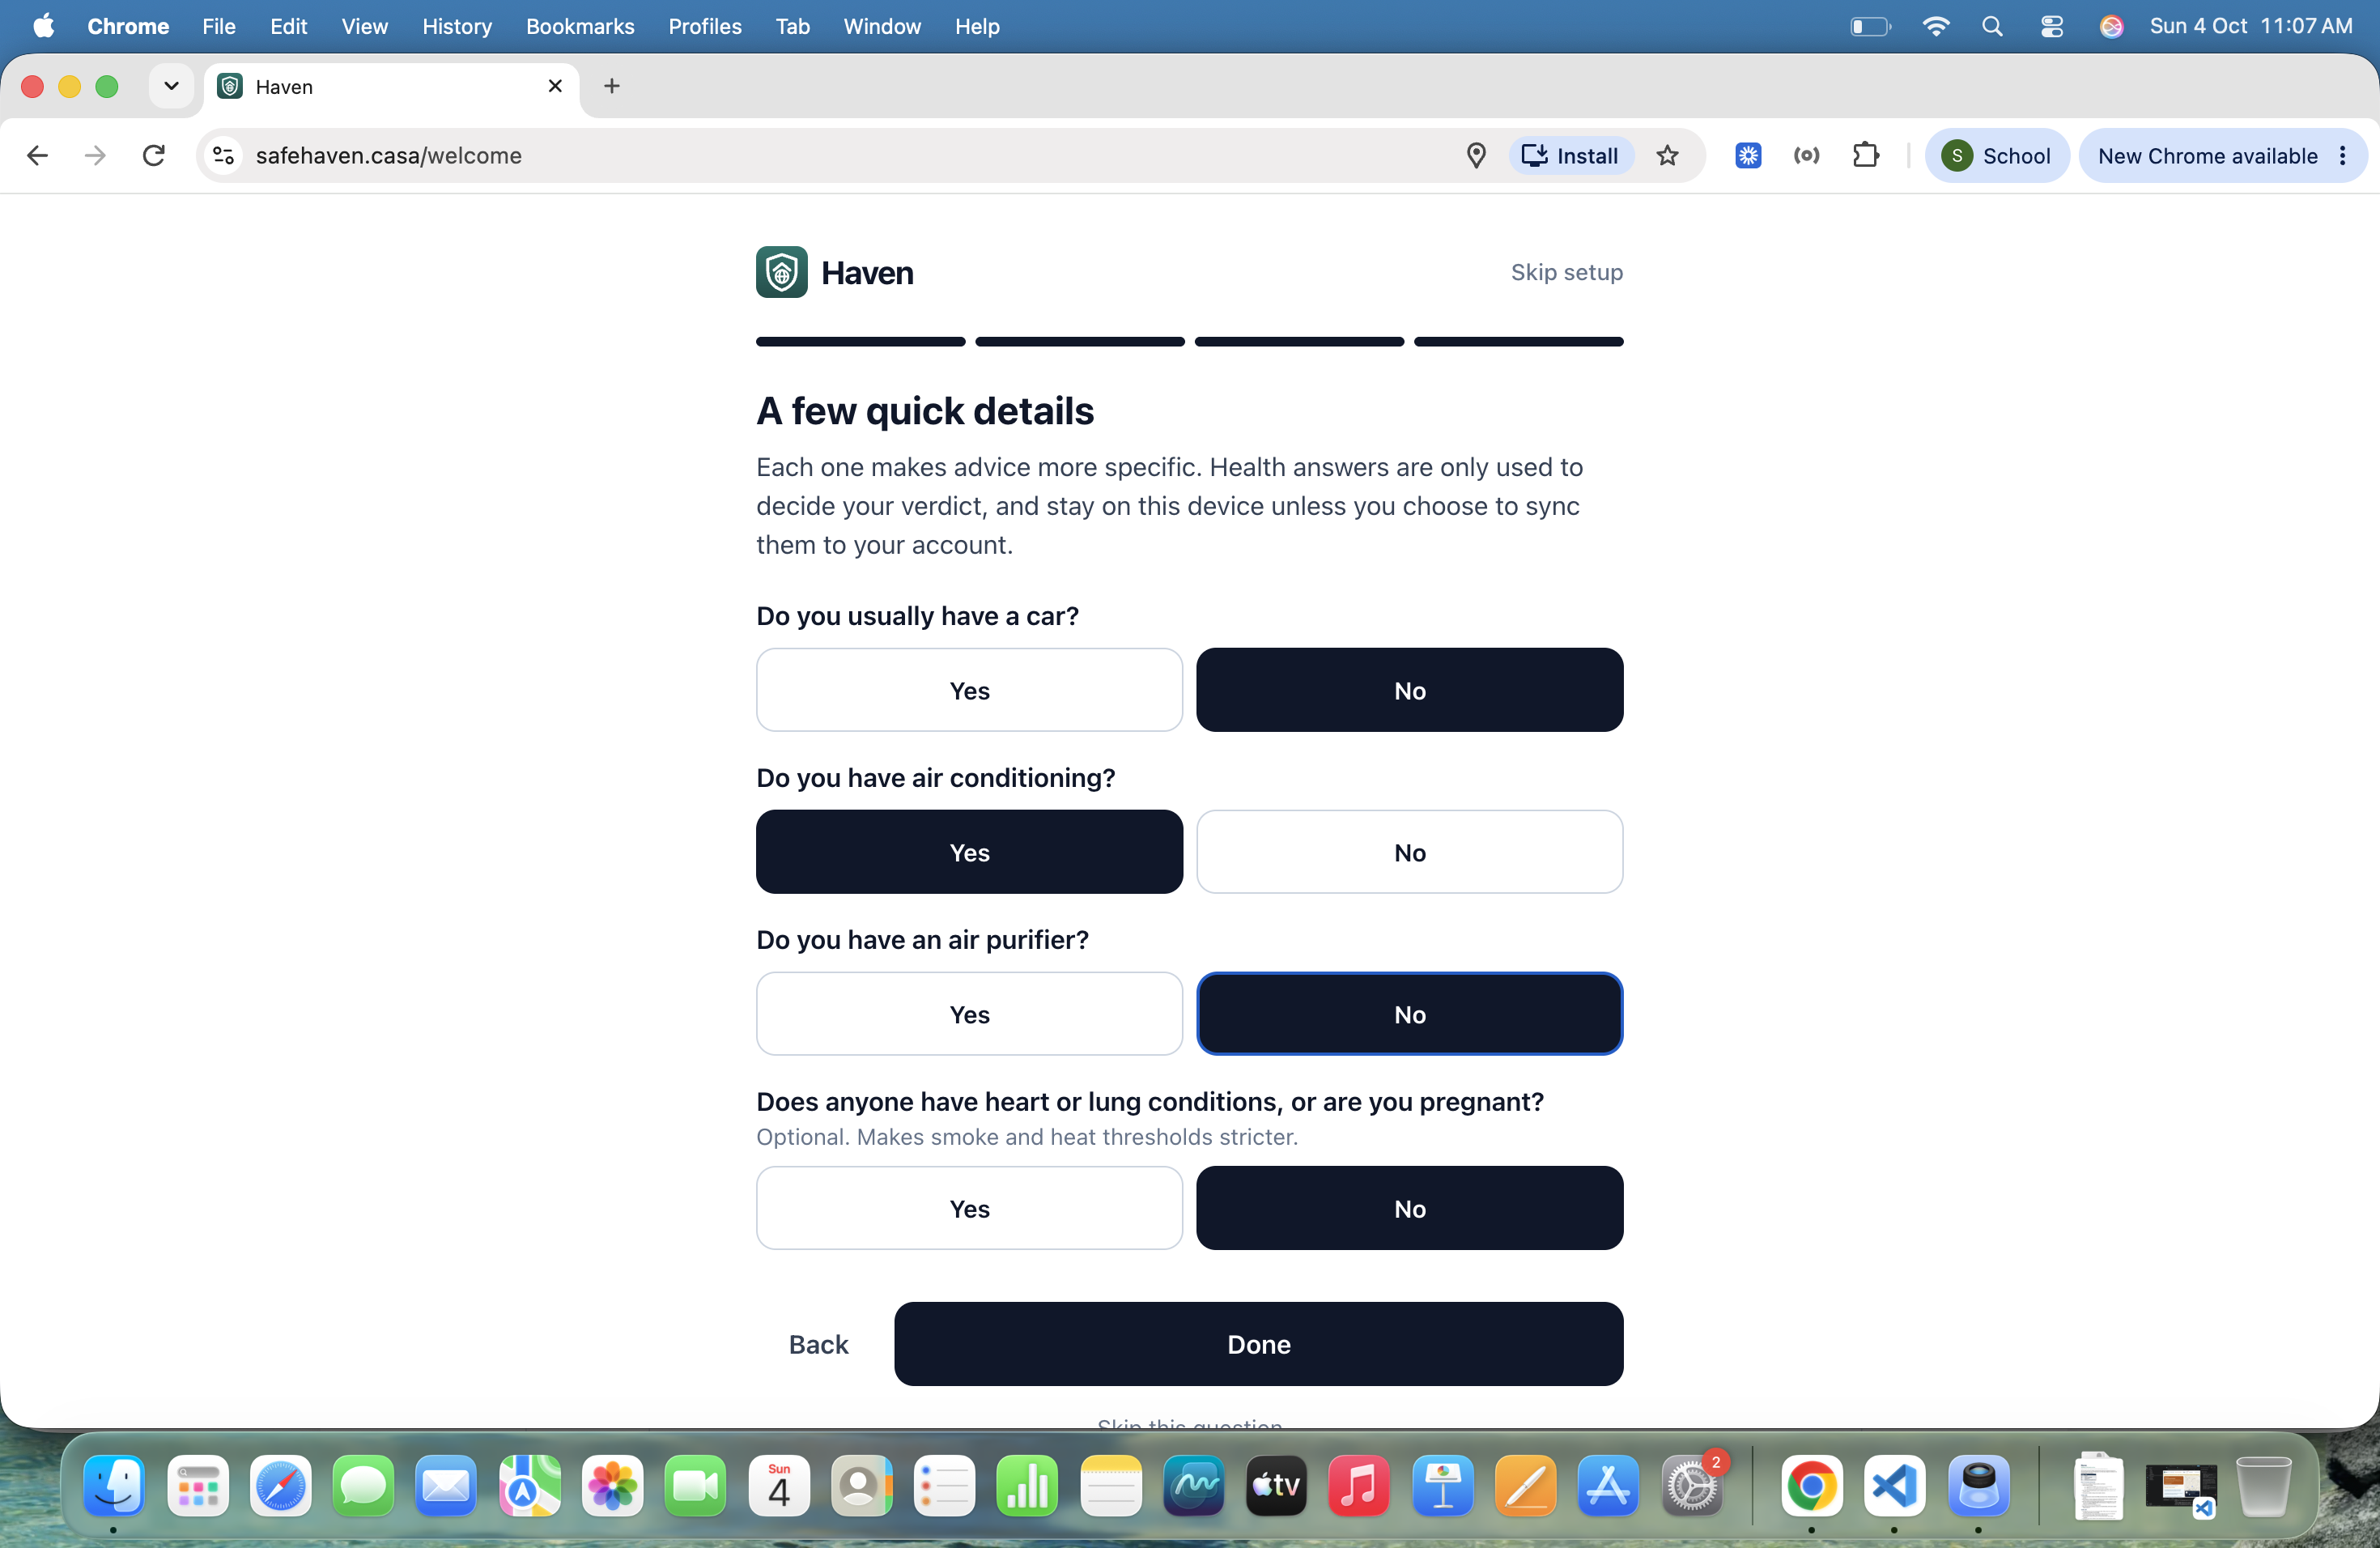
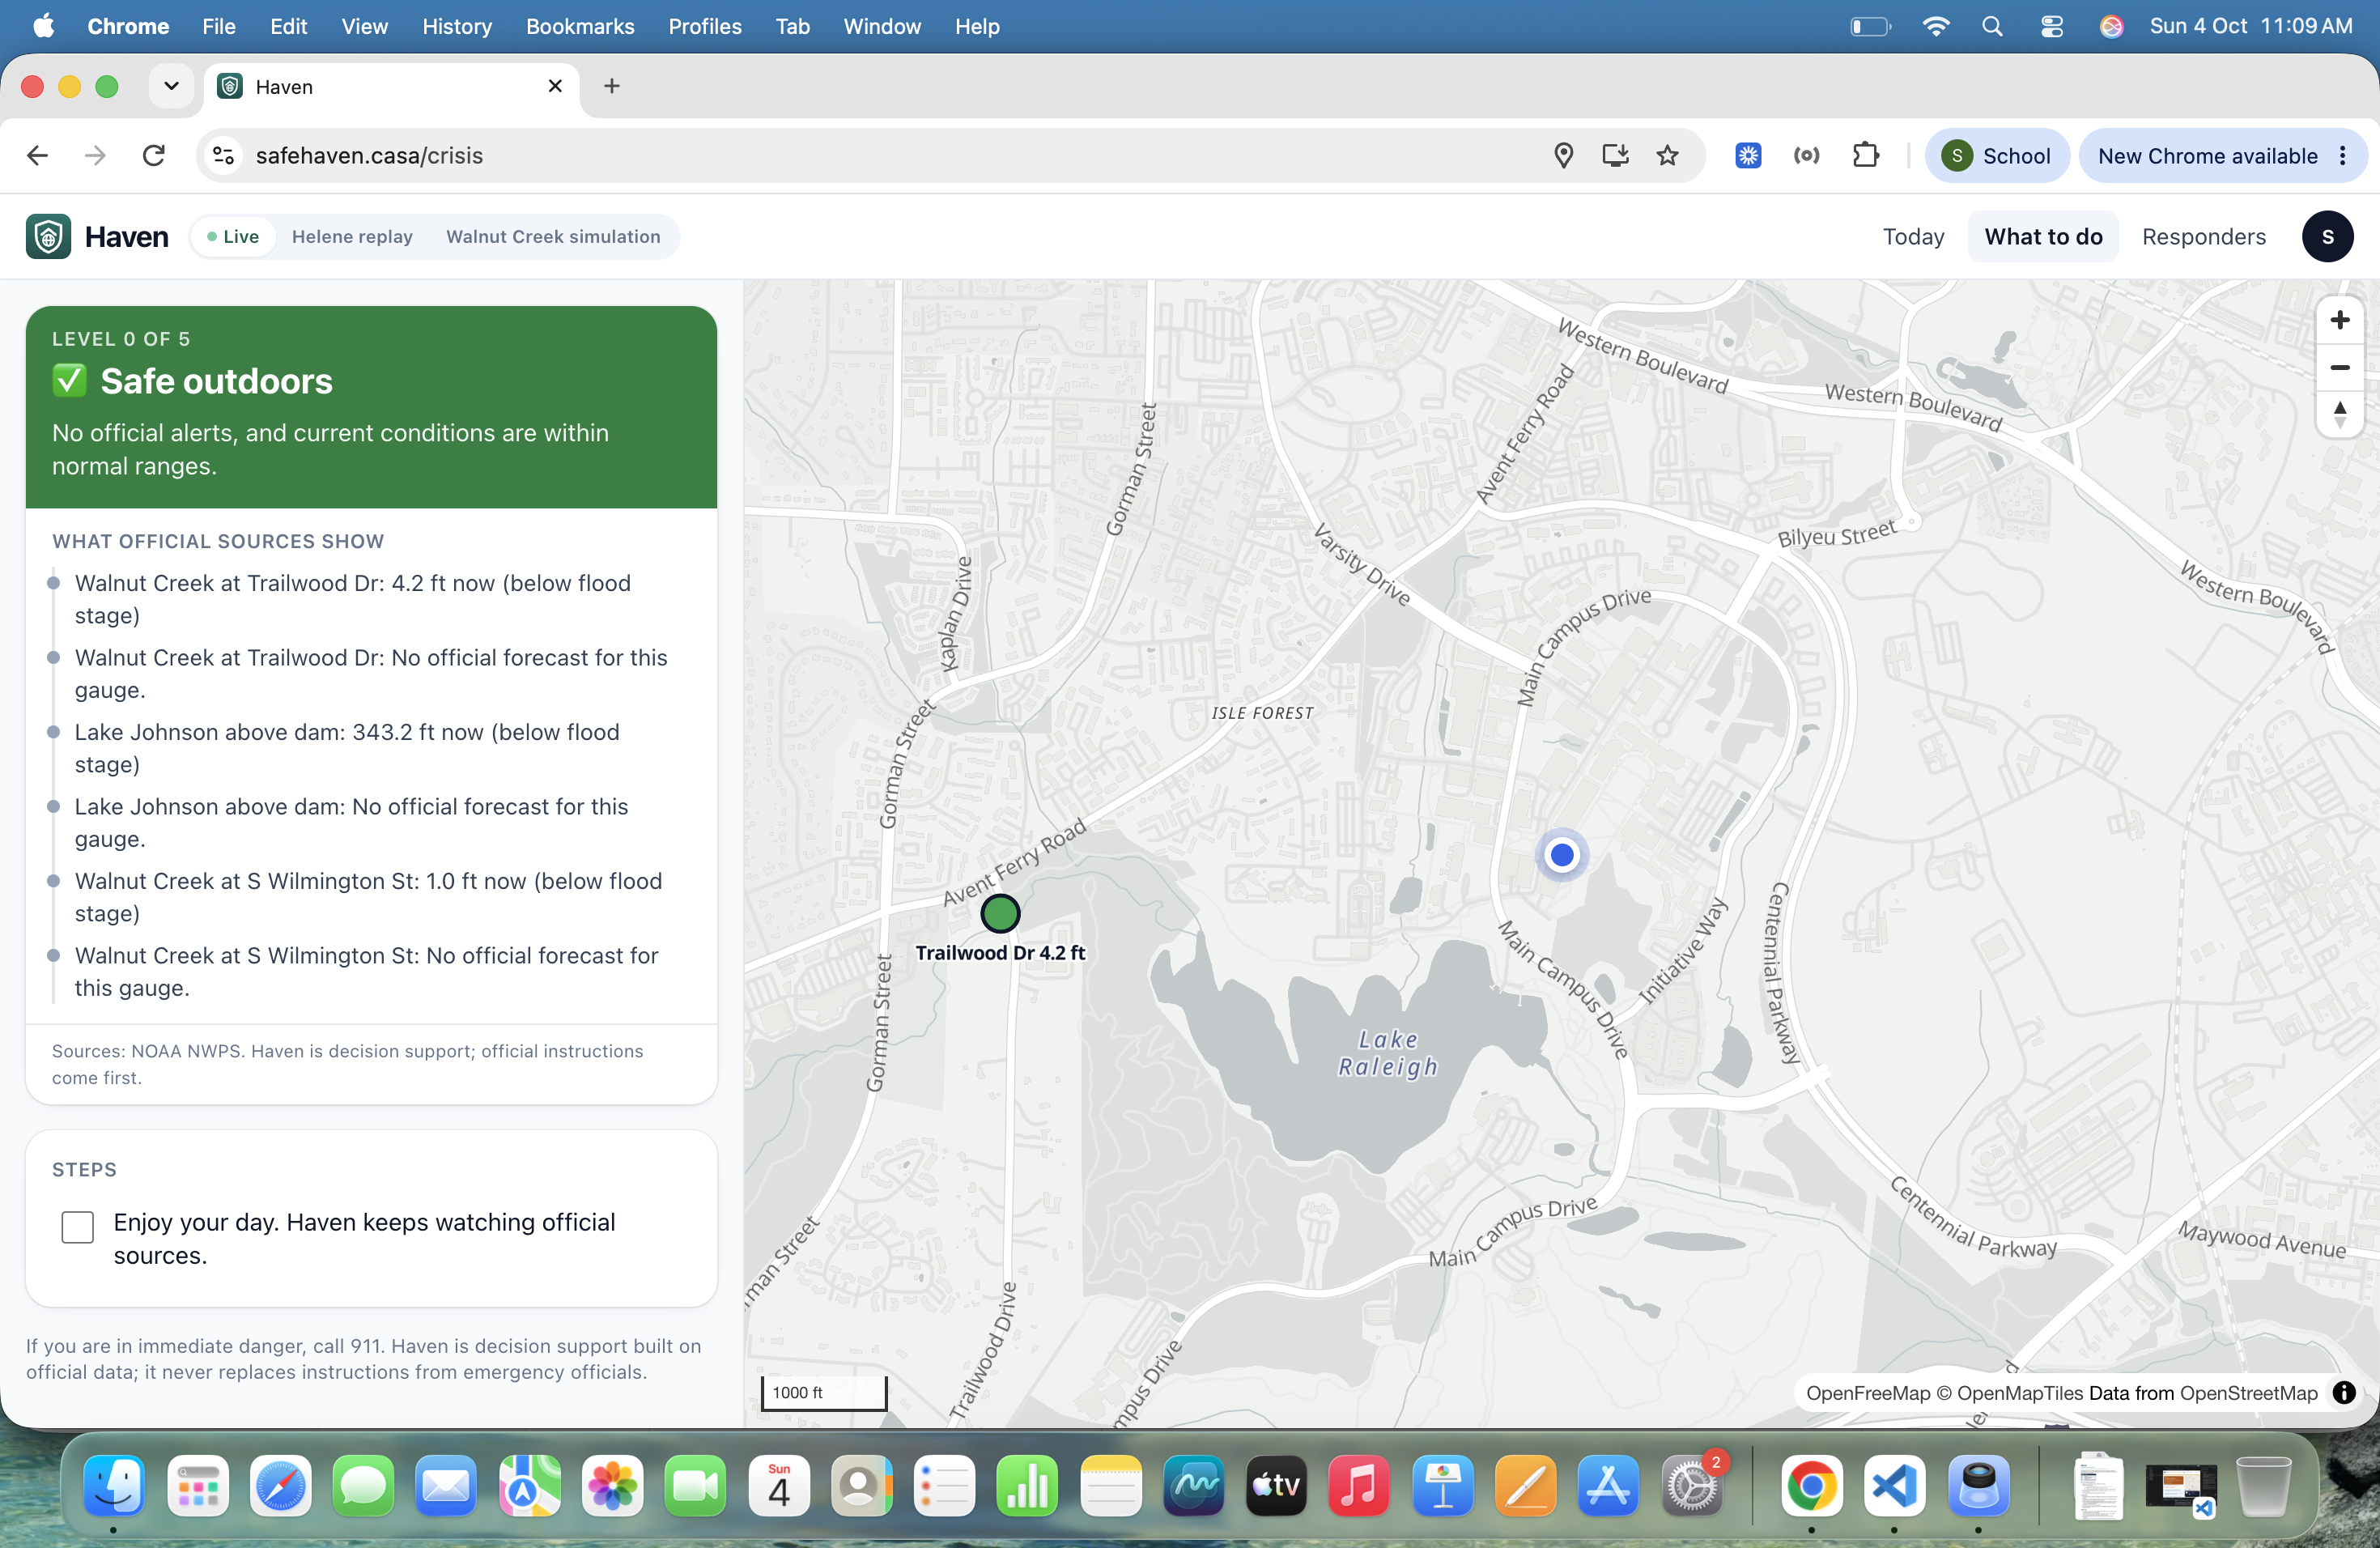
- Crisis mode: when an official alert or forecast puts you at risk, Haven gives a clear verdict (from Limit time outdoors up to Leave now), a short check-in (which floor are you on, do you have a car, who's with you), action steps, and the least risky route in this data to a shelter or higher ground.
- Leave-by deadline: routes skip any road NOAA's forecast floods before you'd get there, plus a 15-minute buffer. If no route makes it in time, Haven says so and switches to shelter-in-place guidance.
- Live navigation: follow mode, turn-by-turn directions, warnings near flooded roads, automatic rerouting when you go off route, and a Google Maps handoff that forces the safer path with waypoints.
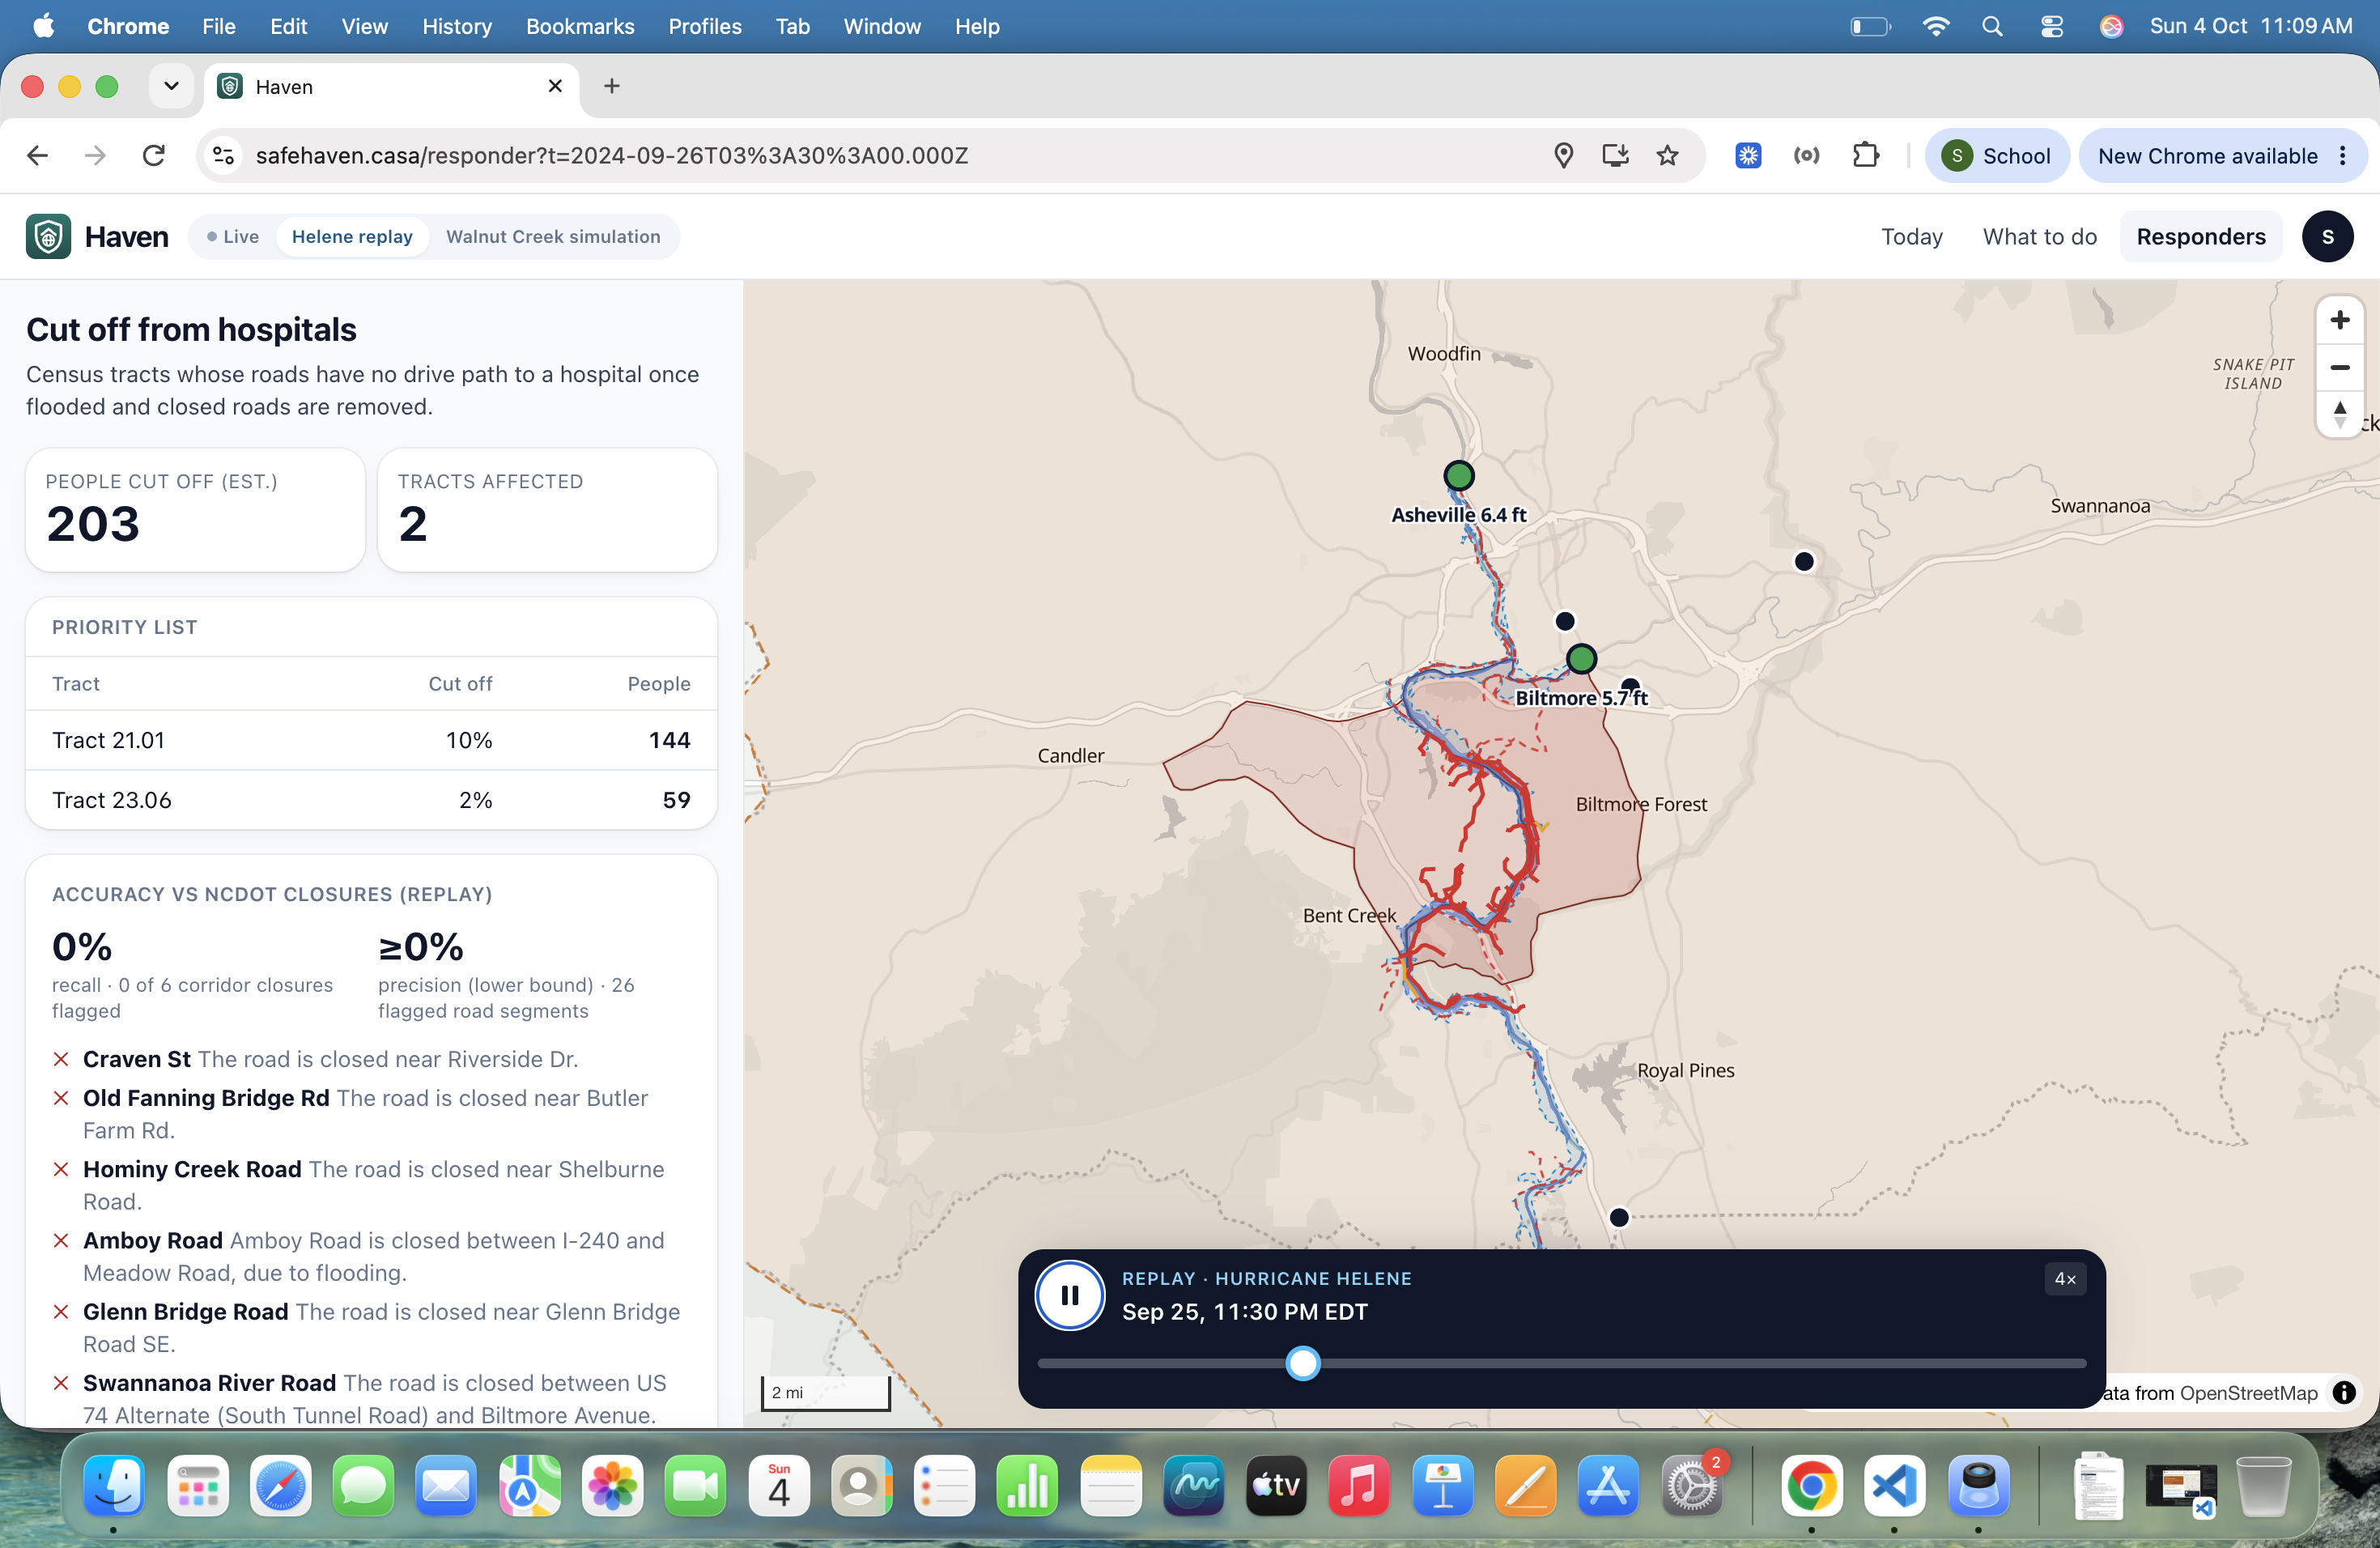
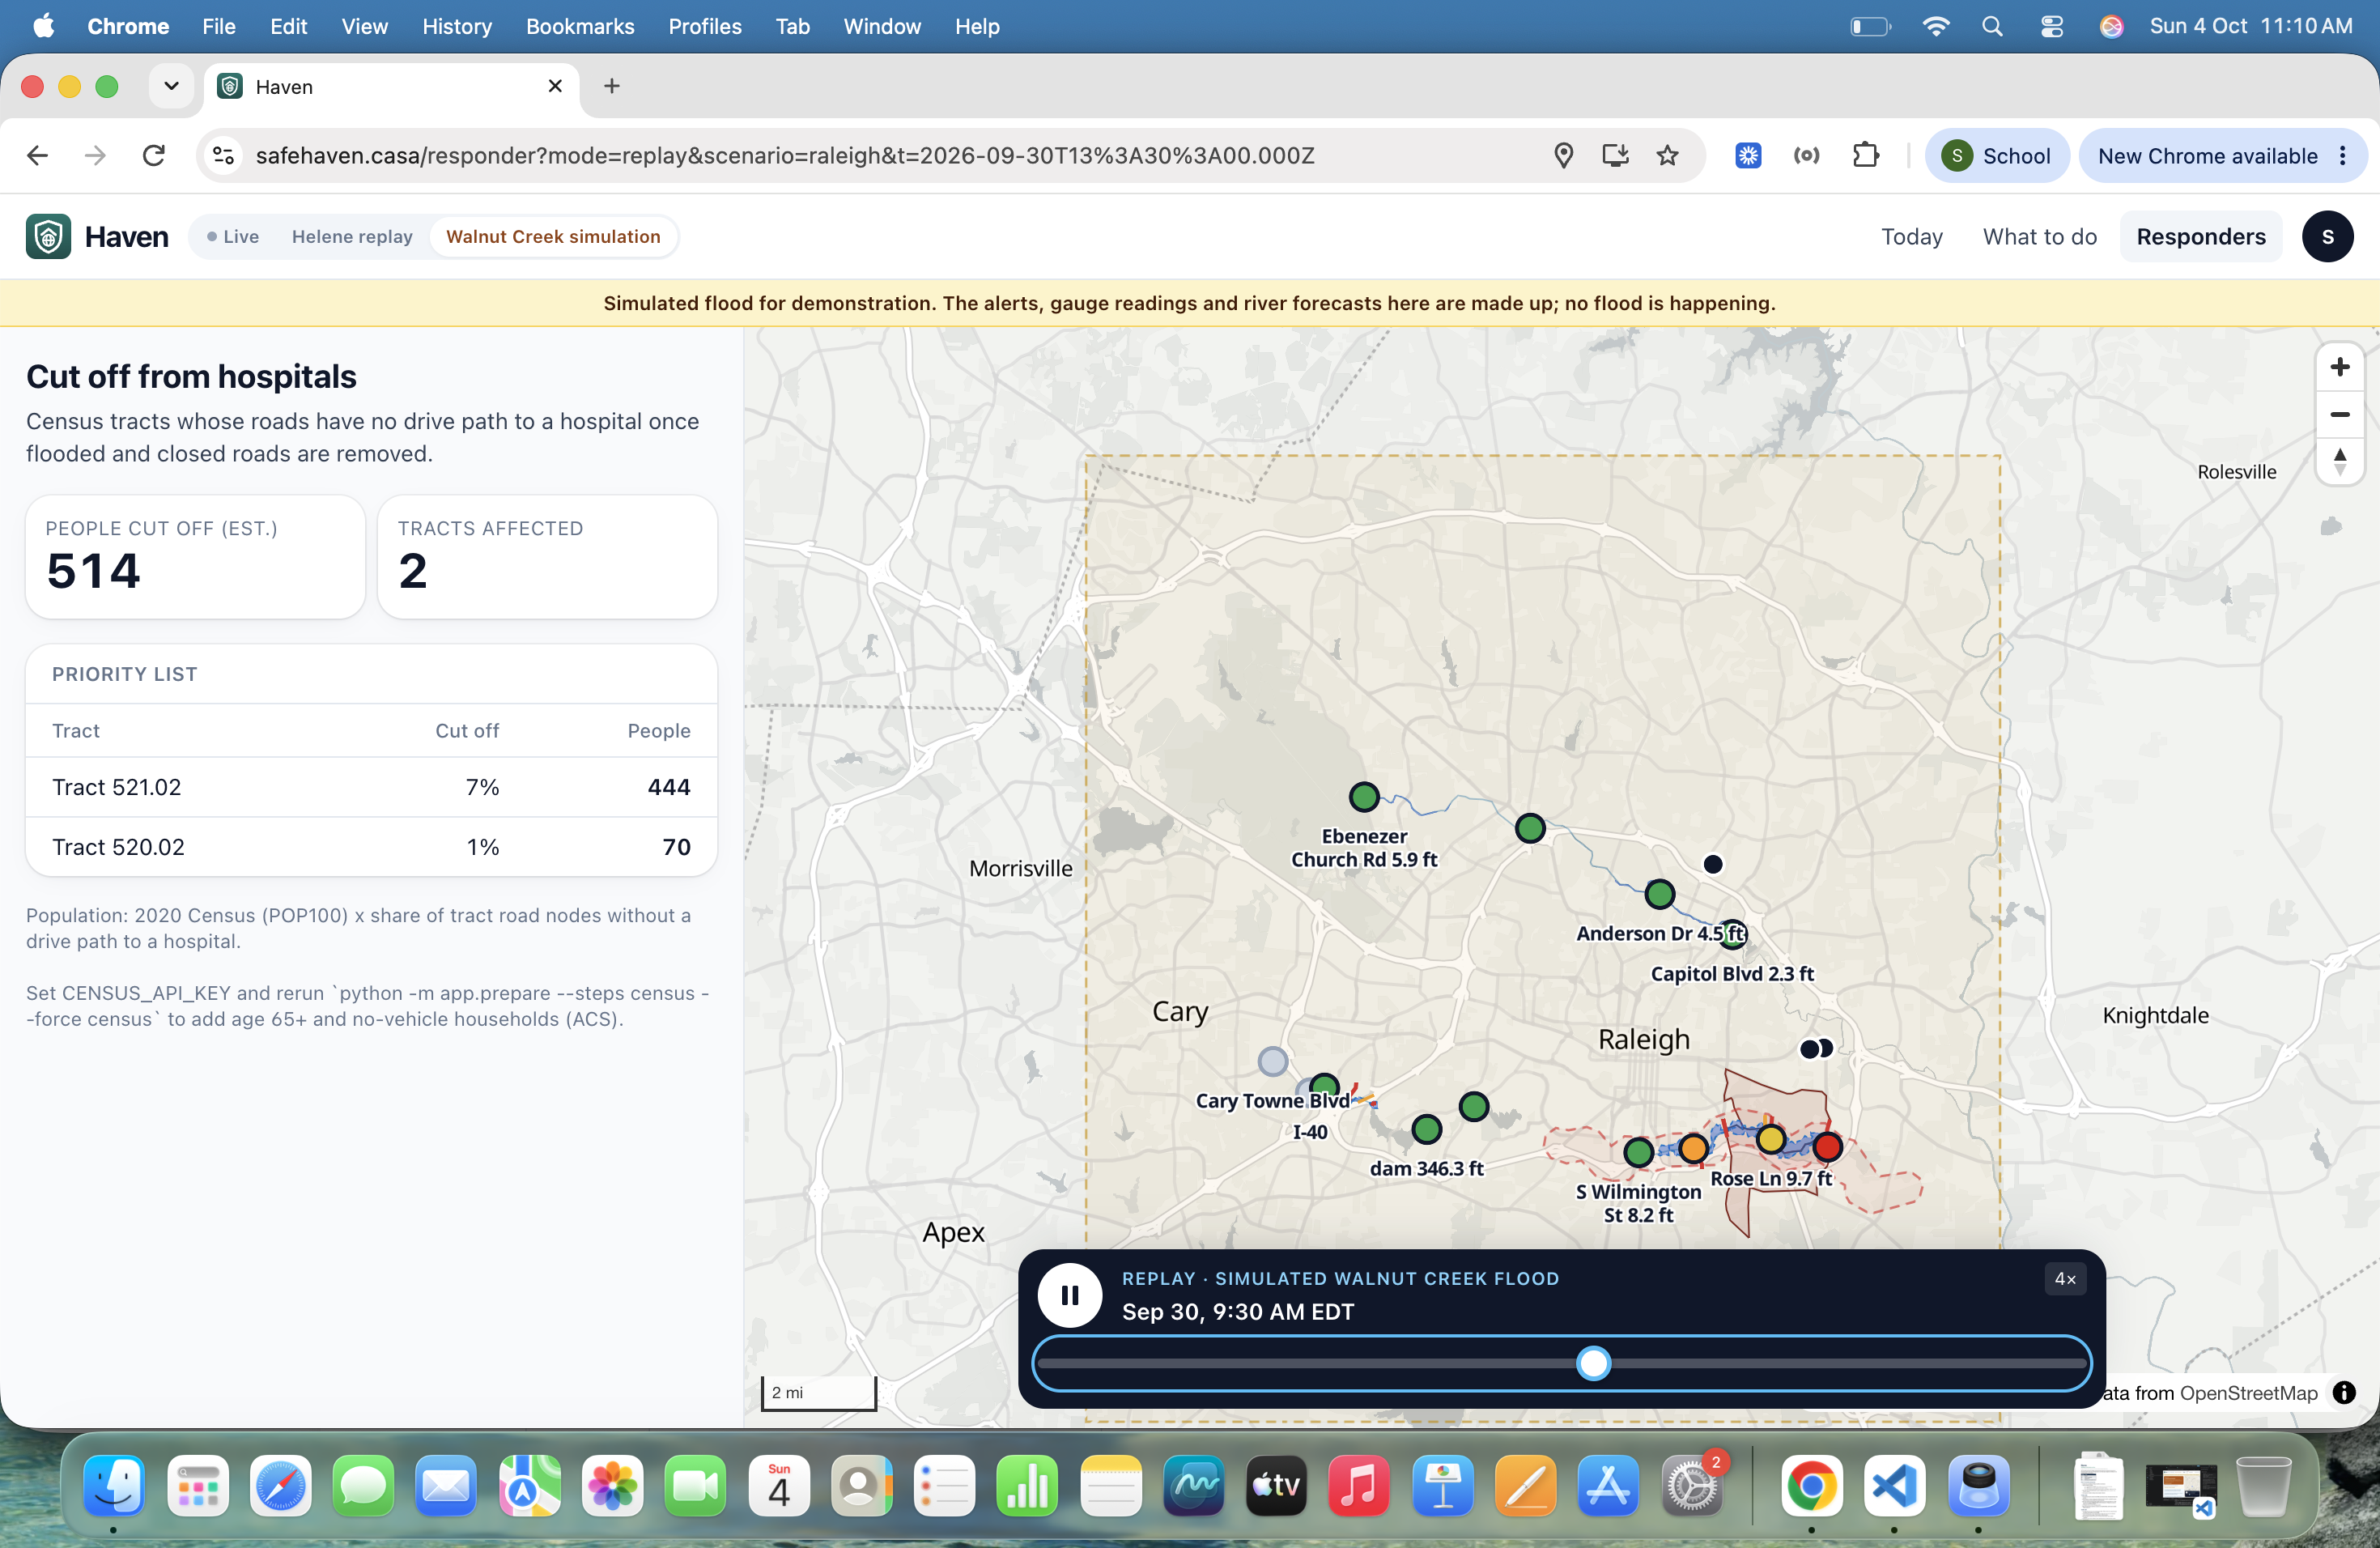
- Responder view: for emergency managers, it shows which neighborhoods are cut off from every hospital and how many people live there, which answers where to take action.
- Helene replay: scrub through Sept 25–29, 2024 in Asheville using only the data that was available at each moment.
How we built it
- Water height: each gauge's surveyed elevation (NAVD88) plus its reading gives the water surface height. We interpolate it along the OpenStreetMap river centerline between gauges (31.2 km of the French Broad, from Fletcher to Asheville).
- Flooded roads: we sample every road segment within 500 m of the river every 8 m against USGS 3DEP 1 m lidar elevation, resampled to 4 m. Bridges are handled separately so the riverbed under them never floods the road. Recomputing about 7,000 road segments takes about 0.1 s, so the replay slider responds instantly.
- Routing: OSMnx and NetworkX, with walking and driving networks. One Dijkstra search covers every candidate destination, using forecast-aware road filtering, and walking speed adjusts for kids, older adults or limited mobility.
- Decision engine: transparent, ordered rules. Official NWS warnings always come first, and Haven never invents its own forecast.
- Stack: FastAPI backend, React + TypeScript + Vite + MapLibre GL frontend, server-sent events for live updates, and an installable web app.
- Data: NOAA National Water Prediction Service, NWS alerts and forecasts, USGS Water Data, USGS 3DEP, OpenStreetMap, NHC, FEMA open shelters, EPA UV, US Census.
- We used Claude Code to help write and test the code; details are in our README.
Challenges we ran into
- Elevation units and datums: gauges report in feet relative to their own datum, while the lidar is in meters (NAVD88). One mistake and hillsides "flood," so we wrote tests that fail if that happens.
- Historical forecasts: we found the official NOAA river forecasts issued during Helene in the Iowa Environmental Mesonet archive, and wrote a parser for their text format. They under-forecast Asheville's crest, at 21.0 ft forecast vs 24.82 ft observed, and Haven shows that honestly.
- No peeking ahead: replay must never use data from after the selected time, so we added tests for that.
- Gauges failing at the peak: the Swannanoa gauge stopped reporting near the crest, and Haven marks it offline instead of guessing.
- Raleigh has no 1 m lidar, so Haven falls back to 10 m USGS elevation there and says so in the app.
Accomplishments that we're proud of
- In replay, Haven flagged 5 of the 6 NCDOT road closures in our river corridor, using only river data.
- At the height of the flood, the responder view finds about 2,000 people in 14 census tracts with no drive path to a hospital.
- 45 automated tests, covering the decision scenarios, flood-road checks, routing and the no-peeking-ahead rule.
What we learned
Official data is excellent but hard to act on. The hard part isn't predicting the flood, it's translating a forecast into a decision a person can make in 10 seconds, with honest limits ("least risky route in this data," never "safe route").
What's next for Haven
- Add our own upstream warning model as a plug-in (a rise at Fletcher arrives at Asheville hours later), checked against NOAA's forecast.
- Model creeks and flash floods, and landslides, which caused many of Helene's road closures.
- Work with county emergency managers on the responder view.
- Add more regions; any area with river gauges and elevation data can be set up with one command.
Built With
- census
- fastapi
- geopandas
- maplibre
- national-weather-service
- networkx
- noaa
- numpy
- openstreetmap
- osmnx
- python
- rasterio
- react
- shapely
- tailwindcss
- typescript
- usgs
- vite

Log in or sign up for Devpost to join the conversation.